Venn Keynote Charts
Bring clarity and visual impact to your ideas with our premium Venn diagram templates for Keynote. These ready-to-use designs help you illustrate overlaps, similarities, and differences in a way that instantly engages your audience and simplifies complex concepts.
Each template is 100% editable in Apple Keynote, allowing you to adjust colors, fonts, text, and circle sizes to perfectly match your branding or presentation theme. No advanced design skills needed - just open, customize, and present.
From classic two-circle layouts to advanced multi-set diagrams, our collection offers versatile options for any scenario. Save valuable time while delivering professional, polished slides that stand out in meetings, classrooms, or pitches.
Perfect for professionals who demand quality and efficiency, these templates turn ordinary data into compelling visual stories that resonate.
 (16)
(16) Editable Financial Charts Keynote Template: Transform Data into Impactful StoriesID: #KC01036$25.00
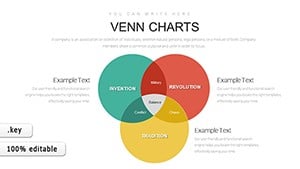 (1171)
 Venn Diagram Keynote Templates: Create Impactful PresentationsID: #KC00885$12.00
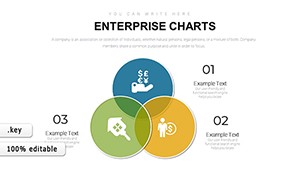 (977)
Premium Enterprise Charts Template for Keynote: Master Data VisualizationID: #KC00883$14.00
(977)
Premium Enterprise Charts Template for Keynote: Master Data VisualizationID: #KC00883$14.00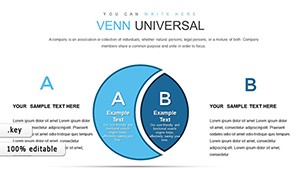 (1112)
 Universal Venn Keynote Charts Template - 39 Editable SlidesID: #KC00873$18.00
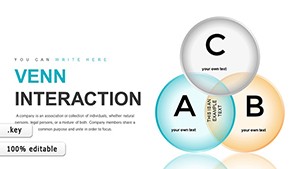 (64)
Graphic Venn Keynote Charts Template - 39 Editable SlidesID: #KC00871$22.00
(64)
Graphic Venn Keynote Charts Template - 39 Editable SlidesID: #KC00871$22.00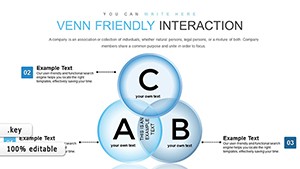 (179)
Venn Friendly Interaction Keynote Charts for RelationshipsID: #KC00870$22.00
(179)
Venn Friendly Interaction Keynote Charts for RelationshipsID: #KC00870$22.00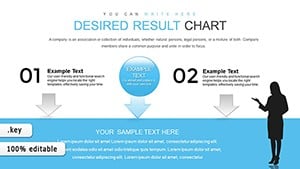 (485)
Desired Result Keynote Charts for Marketing ResearchID: #KC00867$17.00
(485)
Desired Result Keynote Charts for Marketing ResearchID: #KC00867$17.00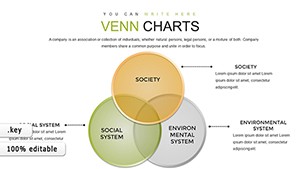 (624)
Science Technology Society Venn Keynote Template - 30 SlidesID: #KC00863$20.00
(624)
Science Technology Society Venn Keynote Template - 30 SlidesID: #KC00863$20.00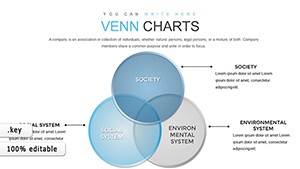 (1082)
Venn Problem Solving Keynote Charts: Elevate Your Analysis GameID: #KC00862$19.00
(1082)
Venn Problem Solving Keynote Charts: Elevate Your Analysis GameID: #KC00862$19.00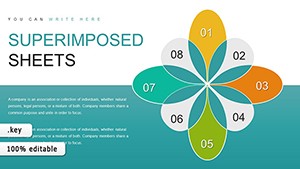 (650)
Superimposed Boundary Sheets Keynote Charts Template: Elevate Your ComparisonsID: #KC00849$14.00
(650)
Superimposed Boundary Sheets Keynote Charts Template: Elevate Your ComparisonsID: #KC00849$14.00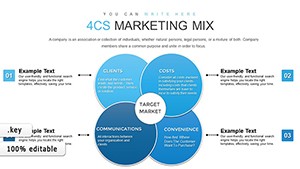 (607)
4Cs & 7Ps Marketing Mix Keynote Charts TemplateID: #KC00833$15.00
(607)
4Cs & 7Ps Marketing Mix Keynote Charts TemplateID: #KC00833$15.00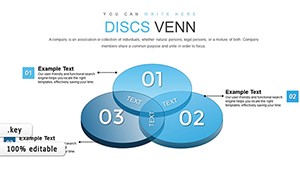 (529)
Transforming Complex Data with 3D Venn Keynote ChartsID: #KC00811$22.00
(529)
Transforming Complex Data with 3D Venn Keynote ChartsID: #KC00811$22.00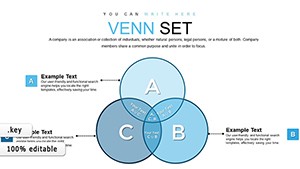 (1031)
Infographic Mastery: Venn Unions and Intersections in KeynoteID: #KC00810$18.00
(1031)
Infographic Mastery: Venn Unions and Intersections in KeynoteID: #KC00810$18.00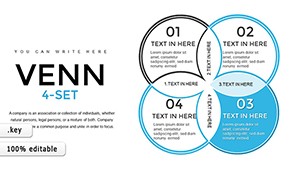 (1136)
4-Set Venn Keynote Template - Fully Editable | ImagineLayoutID: #KC00790$18.00
(1136)
4-Set Venn Keynote Template - Fully Editable | ImagineLayoutID: #KC00790$18.00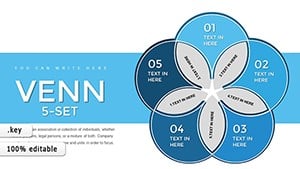 (17)
Venn 5-Set Keynote Charts: Decode Multifaceted OverlapsID: #KC00789$22.00
(17)
Venn 5-Set Keynote Charts: Decode Multifaceted OverlapsID: #KC00789$22.00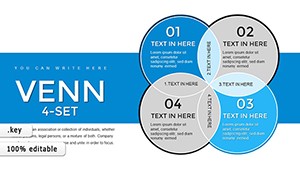 (449)
4-Set Venn Keynote Charts Template: Unlock Intricate Data RelationshipsID: #KC00788$22.00
(449)
4-Set Venn Keynote Charts Template: Unlock Intricate Data RelationshipsID: #KC00788$22.00 (743)
Versatile Venn Keynote Diagrams Template: Illuminate Connections EffortlesslyID: #KC00787$22.00
(743)
Versatile Venn Keynote Diagrams Template: Illuminate Connections EffortlesslyID: #KC00787$22.00 (687)
Venn Diagram Keynote Template - 34 Fully Editable Slides | Instant Download | ImagineLayoutID: #KC00786$20.00
(687)
Venn Diagram Keynote Template - 34 Fully Editable Slides | Instant Download | ImagineLayoutID: #KC00786$20.00 (904)
Banking Keynote Charts Template - Editable | ImagineLayoutID: #KC00703$24.00
(904)
Banking Keynote Charts Template - Editable | ImagineLayoutID: #KC00703$24.00 (507)
Venn Compiled Keynote Charts - Fully Editable | ImagineLayoutID: #KC00668$22.00
(507)
Venn Compiled Keynote Charts - Fully Editable | ImagineLayoutID: #KC00668$22.00 (50)
Venn Diagram Keynote Charts - Editable Keynote | ImagineLayoutID: #KC00625$14.00
(50)
Venn Diagram Keynote Charts - Editable Keynote | ImagineLayoutID: #KC00625$14.00 (1035)
Research & Innovation Infographic Keynote Charts: Spark Creative InsightsID: #KC00538$19.00
(1035)
Research & Innovation Infographic Keynote Charts: Spark Creative InsightsID: #KC00538$19.00 (39)
Venn Keynote Charts: Intersect Architectural Ideas with PrecisionID: #KC00490$20.00
(39)
Venn Keynote Charts: Intersect Architectural Ideas with PrecisionID: #KC00490$20.00 (65)
Drive Sales Success: Sales Marketing Keynote Charts TemplateID: #KC00455$18.00
(65)
Drive Sales Success: Sales Marketing Keynote Charts TemplateID: #KC00455$18.00 (1149)
 Venn Animation Keynote Charts - Instant Download | ImagineLayoutID: #KC00434$18.00
 (730)
Mortgage Transfer Keynote Charts - Fully Editable | ImagineLayoutID: #KC00421$15.00
(730)
Mortgage Transfer Keynote Charts - Fully Editable | ImagineLayoutID: #KC00421$15.00 (900)
Transfer Credits Keynote Charts Template: Master Financial Transfers with Dynamic VisualsID: #KC00420$18.40
(900)
Transfer Credits Keynote Charts Template: Master Financial Transfers with Dynamic VisualsID: #KC00420$18.40 (401)
Personality Types Keynote Template: Unlock Team DynamicsID: #KC00393$15.00
(401)
Personality Types Keynote Template: Unlock Team DynamicsID: #KC00393$15.00 (926)
Estimation Edge: Versatile Keynote Venn ChartsID: #KC00366$14.00
(926)
Estimation Edge: Versatile Keynote Venn ChartsID: #KC00366$14.00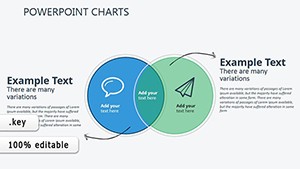 (613)
Venn Analysis: Strategic Keynote Chart TemplatesID: #KC00365$14.00
(613)
Venn Analysis: Strategic Keynote Chart TemplatesID: #KC00365$14.00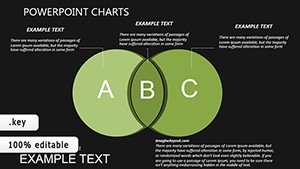 (346)
Dark Construction Venn Charts: Keynote Paradox ProsID: #KC00359$14.00
(346)
Dark Construction Venn Charts: Keynote Paradox ProsID: #KC00359$14.00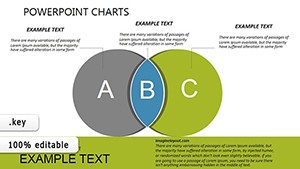 (21)
Construction Venn Diagrams: Editable Keynote ChartsID: #KC00358$14.00
(21)
Construction Venn Diagrams: Editable Keynote ChartsID: #KC00358$14.00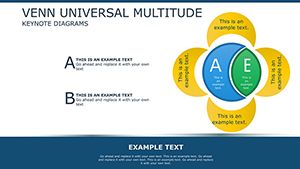 (77)
Venn Collection Diagrams - Download Venn Keynote Charts TemplateID: #KC00309$18.00
(77)
Venn Collection Diagrams - Download Venn Keynote Charts TemplateID: #KC00309$18.00
Why Choose Professional Venn Diagram Templates for Keynote?
Apple Keynote includes basic shape tools, but they often result in generic, time-consuming diagrams that lack visual polish. Our professional templates solve this by providing ready-made, thoughtfully designed layouts that look refined from the first slide.
Key advantages include:
- Modern, balanced designs optimized for screen and projector display
- Full editability of every element - colors, text, shapes, and positions
- High-resolution graphics that stay crisp when zoomed or projected
- Optional subtle animations for smooth, professional reveals
- Consistent styling that maintains brand coherence across slides
These features save hours of manual formatting while delivering presentations that appear custom-designed.
Real-World Applications of Venn Diagrams in Keynote
Business Strategy and Reports
Compare market segments, highlight competitive advantages, or map strategic partnerships. For instance, show where your product features overlap with customer pain points to emphasize unique value in investor or board presentations.
Education and Training Sessions
Teach set theory, contrast historical events, or compare scientific classifications. Students grasp concepts faster when relationships are shown visually rather than listed in bullet points.
Marketing and Sales Pitches
Illustrate target audience overlaps, position brands against competitors, or demonstrate campaign channel synergies. This helps stakeholders quickly understand positioning strategies.
Research and Data Analysis
Present survey result intersections, patient cohort comparisons, or dataset commonalities in academic or medical conferences. Clear visuals make complex findings accessible.
Ready to make your next presentation more effective? Browse the templates above and download the perfect Venn diagram for your needs.
Best Practices and Creative Tips for Venn Diagrams
Follow these guidelines to create diagrams that inform and impress:
- Limit sets to 3–4 circles for optimal readability - more can overwhelm viewers
- Use distinct, contrasting colors for separate sets and softer tones for overlaps
- Keep labels concise and position them clearly outside or inside circles
- Place the most critical shared elements in the central intersection
- Incorporate relevant icons or images inside circles for added visual interest
- Animate circles or text to appear sequentially for better storytelling flow
Creative variation: Pair a Venn diagram with a timeline or flowchart on adjacent slides to provide deeper context. Our templates support seamless integration with other slide types.
Elevate your Keynote presentations today - choose a template and start creating impactful visuals that communicate with confidence.
Frequently Asked Questions
What is a Venn diagram and why use it in presentations?
A Venn diagram uses overlapping circles to show relationships between sets. In presentations, it quickly clarifies similarities, differences, and commonalities, making complex information easier to understand and remember.
How do I customize these templates in Keynote?
Open the file in Keynote, select any element (circle, text, or shape), and use the Format inspector to change colors, fonts, sizes, or positions. All layers are fully unlocked for complete flexibility.
Are the templates compatible with all Keynote versions?
Yes, they are designed for full compatibility with the latest macOS, iPadOS, and iCloud versions of Keynote, ensuring smooth performance across devices.
Do any templates include animations?
Many include optional build-in animations that reveal circles or text sequentially. You can keep, modify, or remove them easily in the Animate tab.
How many circles do these Venn diagrams support?
Our collection includes designs with 2 to 5 circles, with some flexible layouts that allow duplication for additional sets if needed.