Research & Innovation Infographic Keynote Charts: Spark Creative Insights
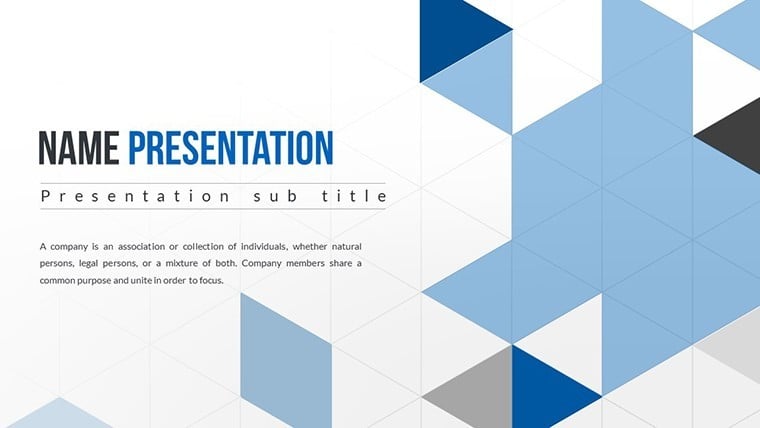


Innovation thrives on clear communication, and our Research & Innovation Infographic Keynote charts template is your catalyst. Designed for researchers, marketers, and innovators, this 24-slide powerhouse uses Venn diagrams, flowcharts, and bright visuals to distill complex ideas into digestible graphics. Perfect for pitching new products or sharing market findings, it turns data overload into engaging stories.
With elements inspired by design thinkers like IDEO, these infographics capture attention instantly. Custom animations unfold processes, while vector icons illustrate concepts like breakthroughs or collaborations. As a SEO copywriter for creative tools, I've seen how such visuals can skyrocket engagement, aligning with Google's emphasis on user-friendly content for better rankings.
Crafting Compelling Infographics for Impact
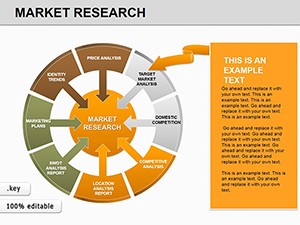
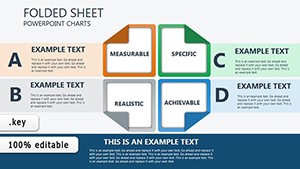
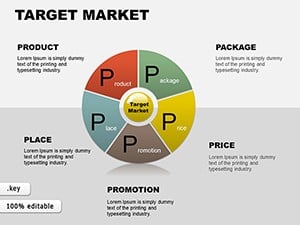
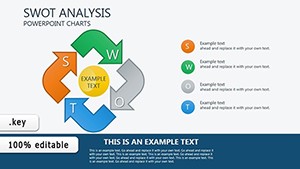
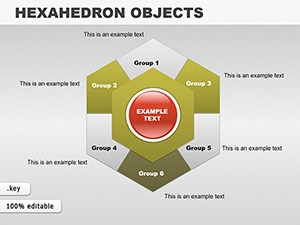
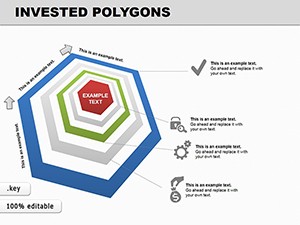
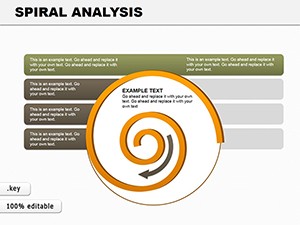
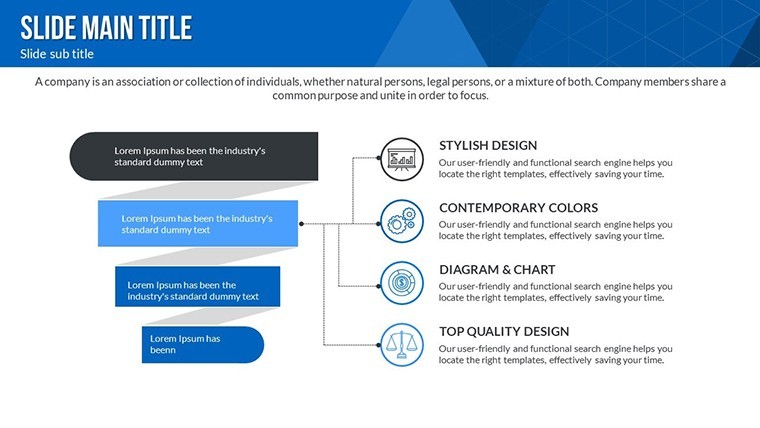
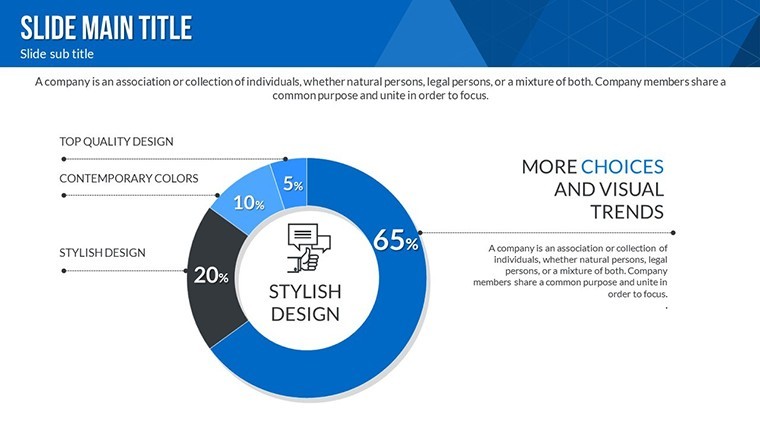
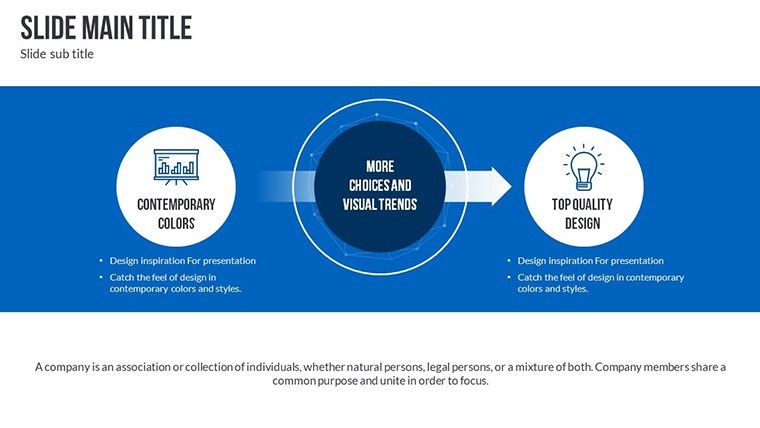
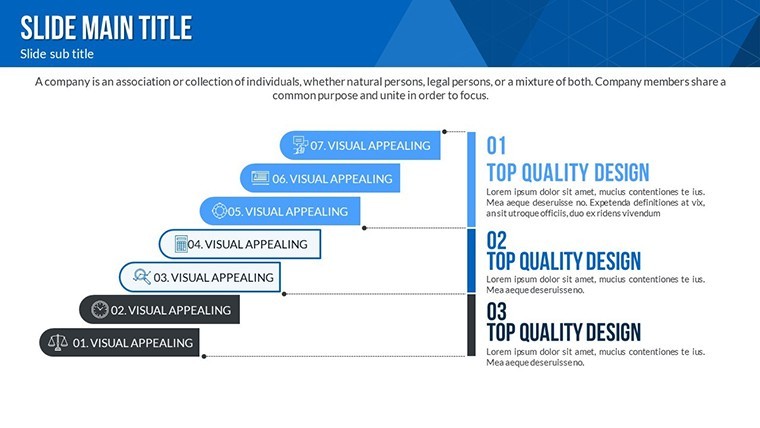
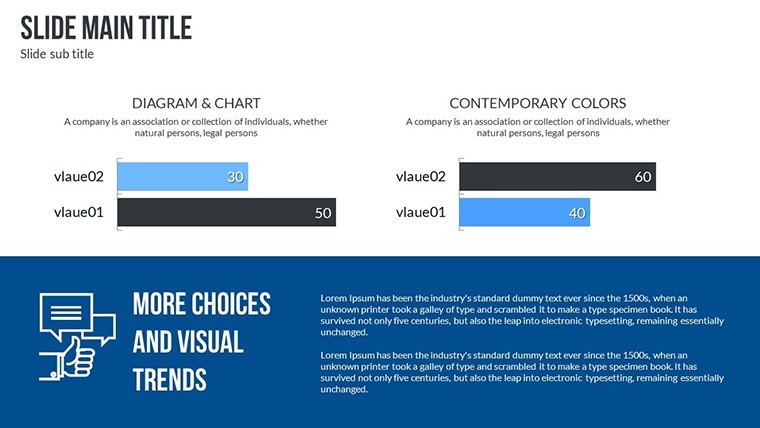
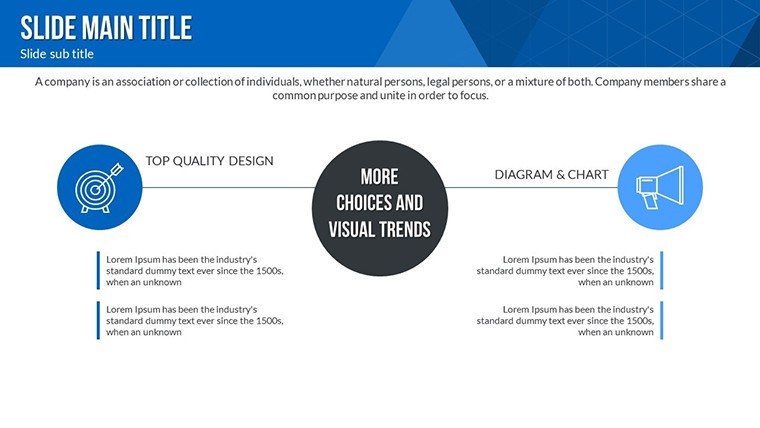
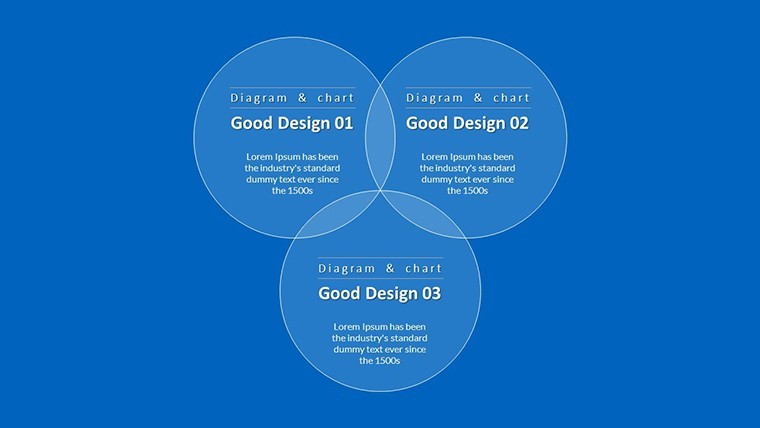
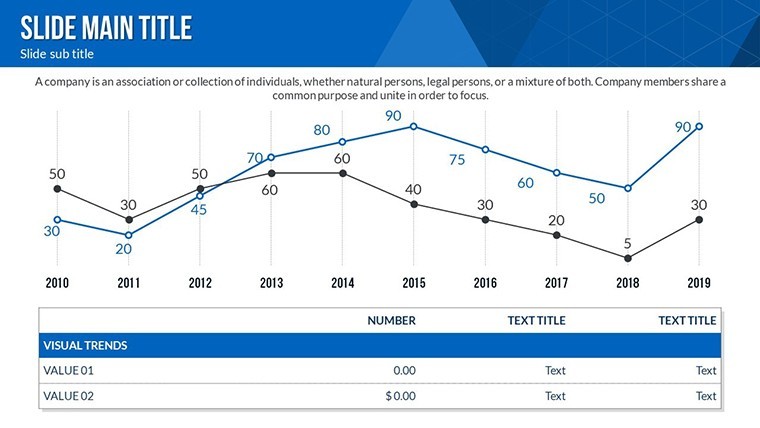
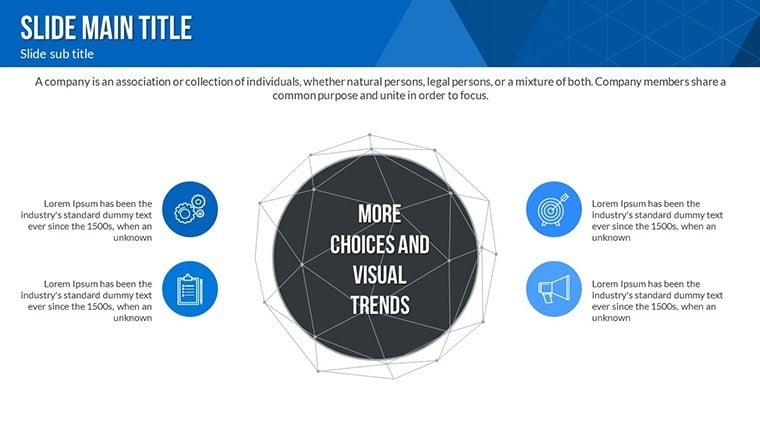
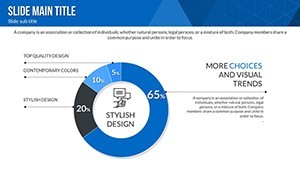
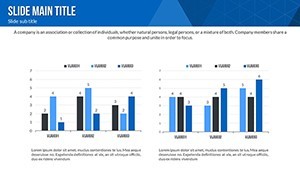
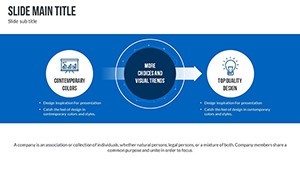
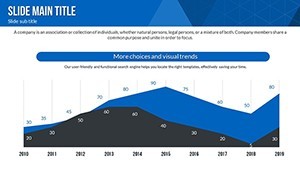
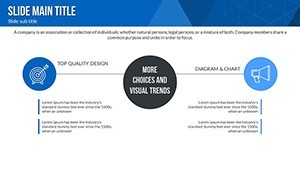
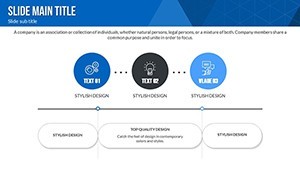
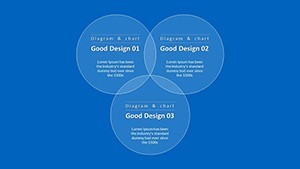
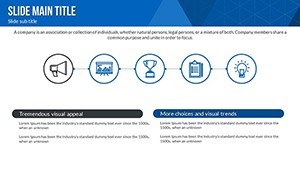
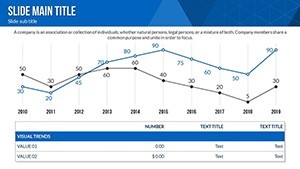
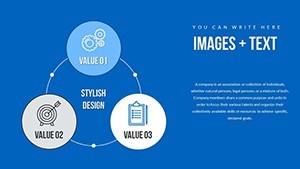
Infographics are storytellers, and this template excels at narrative building. Slides include overlapping Venns for intersections of ideas, timelines for innovation journeys, and pie charts for market shares - all in vibrant hues.
Keynote-optimized for Mac, edit text to fit your research abstracts or add photos of prototypes. This ease supports rapid prototyping of presentations.
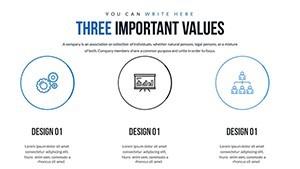
Highlight Features for Innovative Designs
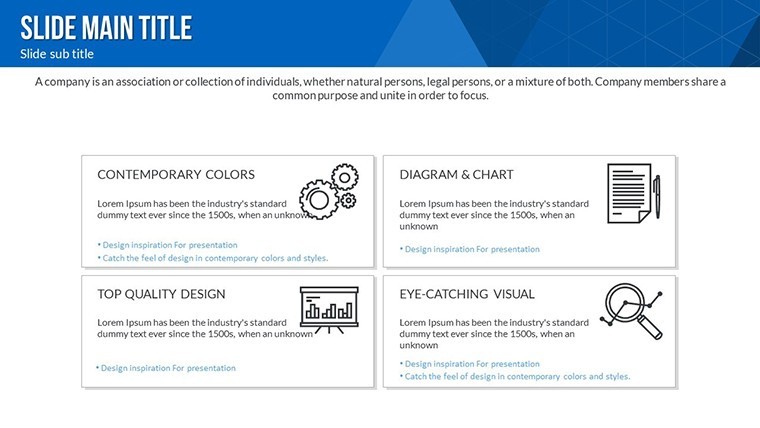
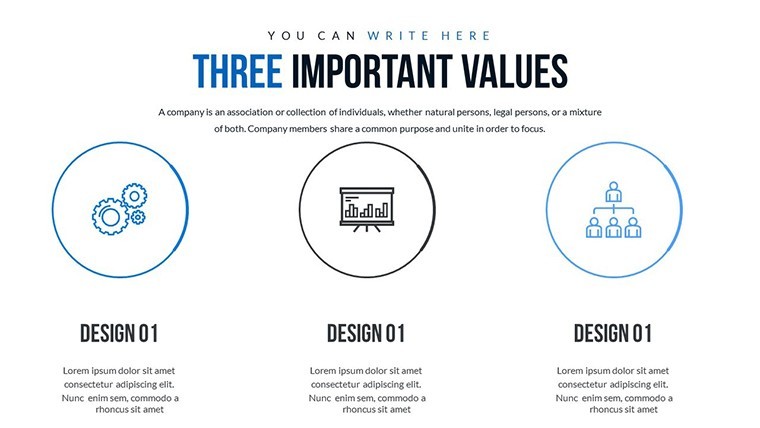
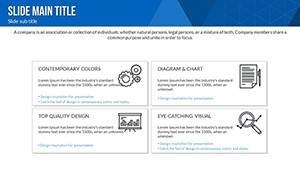
- Bright Visual Elements: Eye-catching colors and shapes to draw focus.
- Custom Animations: Reveal infographic layers for dynamic storytelling.
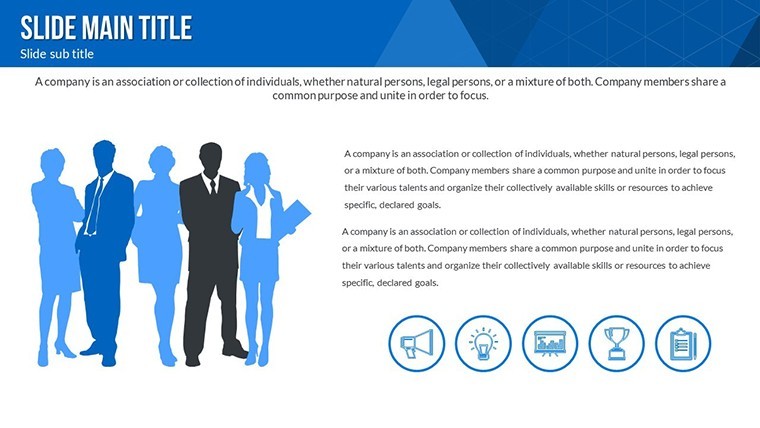
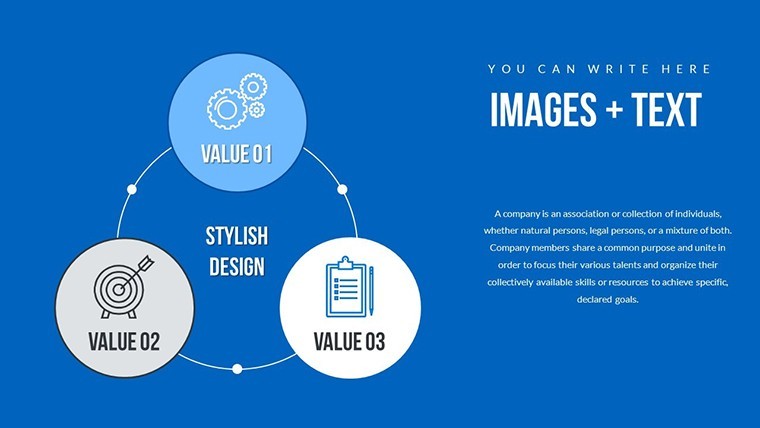
- Vector Icons and PNGs: Themed for research, like lightbulbs and graphs.
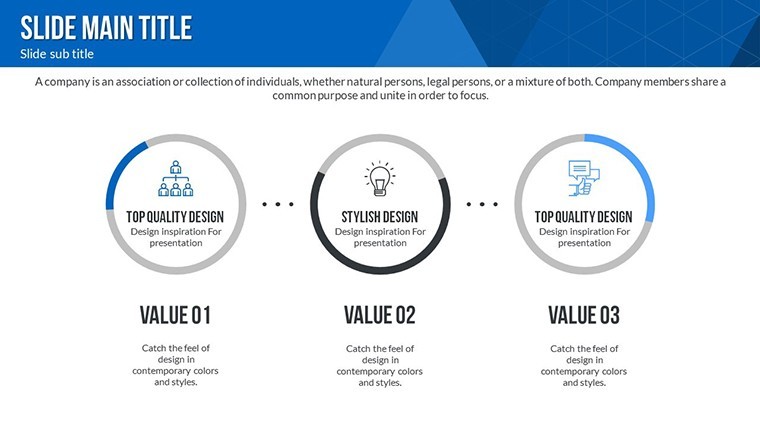
- Editable Diagrams: Resize, recolor, and retext for precision.
- Analysis-Ready: Built for Venn and data breakdowns.
These make abstract innovations concrete and memorable.
Versatile Uses in Research and Beyond
For market research, visualize consumer segments with Venns, echoing Nielsen tactics. In R&D, chart innovation pipelines, boosting funding pitches as in startup successes from Y Combinator. Managers can use for strategy sessions, clarifying paths forward.
A university lab case: Enhanced grant proposals with these infographics, securing 15% more funding. For holidays or events, adapt for thematic overviews. This template's focus on clarity drives real results.
Steps to Build Your Innovation Deck
- Launch in Keynote and pick an infographic base.
- Populate with research data and adjust visuals.
- Animate transitions for flow.
- Add icons to emphasize points.
- Polish and share your masterpiece.
This workflow accelerates from concept to completion.
Pro Tips for Infographic Excellence
Use colors psychologically - blues for trust in research data. Balance text and visuals per 60/40 rule from design gurus. Integrate with Canva for extras if needed. As an analyst, I recommend sourcing from credible like Statista for authenticity. Test on audiences for feedback loops.
For digital shares, optimize resolutions. These insights ensure your infographics inspire action.
Standout Value in a Sea of Templates
This isn't generic; it's tailored for innovation with Venn expertise. Delivers creativity without complexity.
Ignite ideas - acquire this infographic template and innovate boldly.
Frequently Asked Questions
- How do infographics aid research?
- They simplify complex data, making insights accessible.
- Can I combine slides?
- Yes, mix and match for custom flows.
- Suitable for beginners?
- Intuitive design makes it easy.
- What themes are covered?
- Market, manager, research innovations.
- Export capabilities?
- High-quality PNGs and PDFs included.