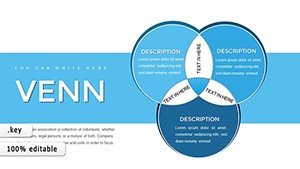
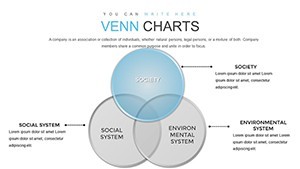
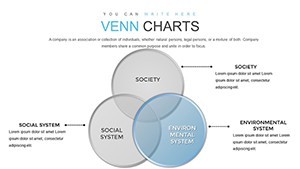
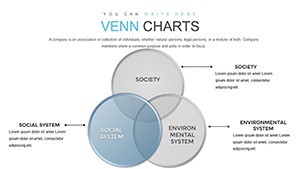
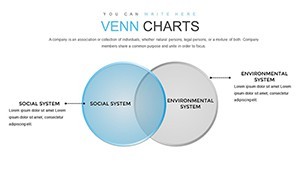
Venn Problem Solving Keynote Charts: Elevate Your Analysis Game


Type: Keynote Charts template
Category: Venn
Sources Available: .key
Product ID: KC00862
Template incl.: 30 editable slides
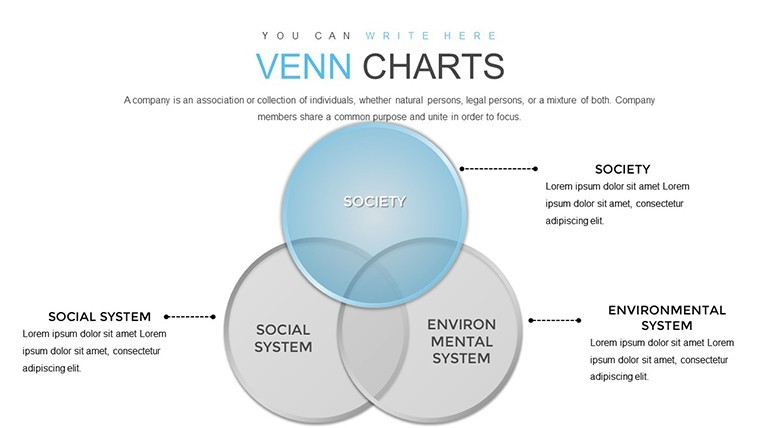
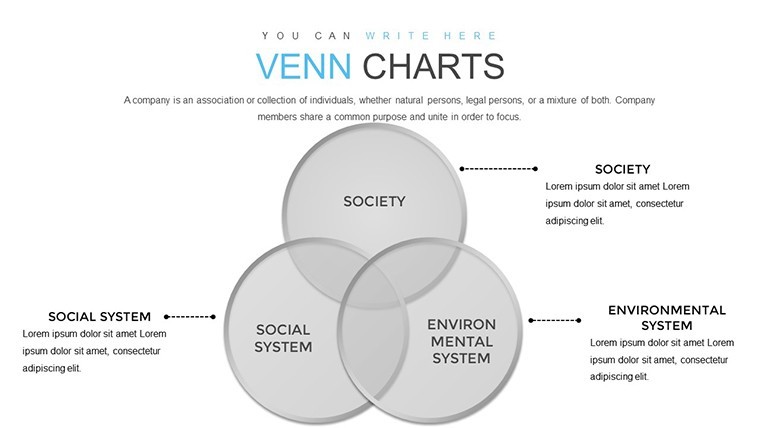
In the realm of data visualization and strategic thinking, Venn diagrams stand out as timeless tools for dissecting relationships between concepts, datasets, or ideas. Imagine transforming convoluted problems into crystal-clear insights that captivate your audience - whether you're pitching to executives, teaching students, or collaborating on research projects. Our Venn Problem Solving Keynote Charts template, featuring 30 fully editable slides, is crafted precisely for that purpose. Tailored for professionals who demand precision and flair, this template empowers you to illustrate intersections, differences, and synergies with ease. Say goodbye to bland slides and hello to dynamic visuals that foster deeper understanding and smarter decisions. Compatible with Apple Keynote, it's a versatile asset for anyone aiming to communicate complexity without losing impact. From urban planning teams mapping stakeholder interests to marketers analyzing customer segments, this template turns abstract thoughts into actionable narratives. Dive in and discover how these charts can revolutionize your next presentation, saving you hours of design time while amplifying your message's resonance.
Unlocking the Power of Venn Diagrams in Problem Solving
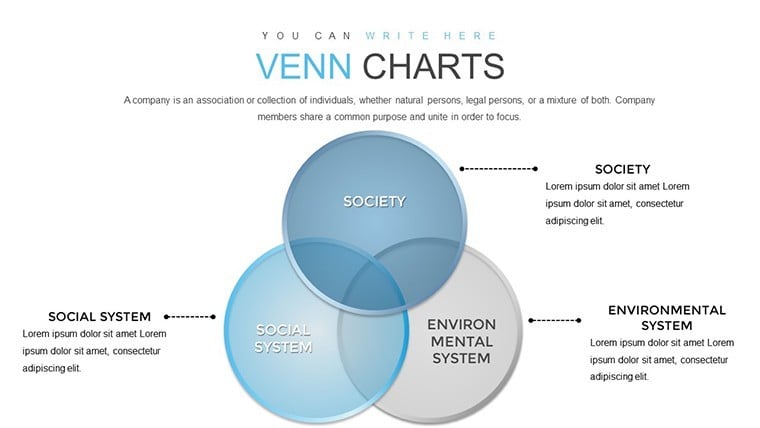
Venn diagrams aren't just circles on a page; they're gateways to profound analysis. This template harnesses their potential by offering a suite of pre-designed layouts that adapt to your unique needs. Each slide is built with high-resolution graphics, ensuring your presentations look polished on any screen or projector. The core benefit? They break down multifaceted issues into digestible parts, making it easier for teams to identify core problems and innovative solutions. For instance, in a business context, use them to compare product features across competitors, revealing untapped market opportunities. Educators might employ them to teach logical reasoning, overlapping sets in math classes with real-world examples like ecosystem interactions. Researchers can map out variable relationships in studies, such as overlapping factors in climate change impacts. The flexibility extends to color schemes - choose from professional palettes or customize to match your brand, enhancing visual coherence and audience engagement.
Key Features That Set This Template Apart
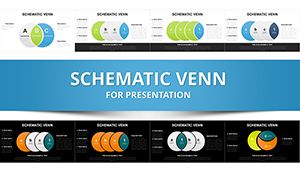
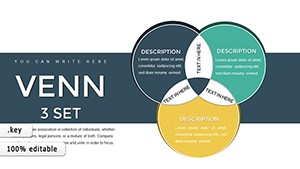
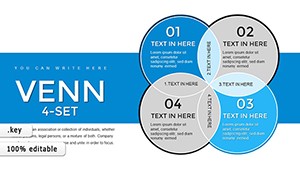
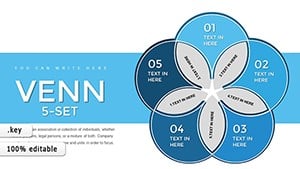
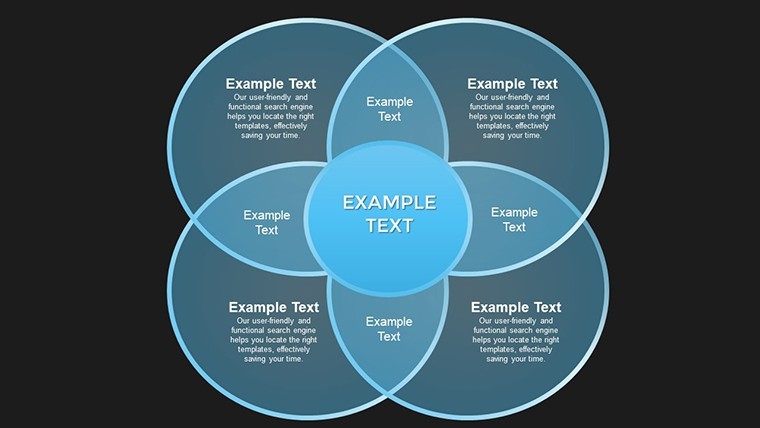
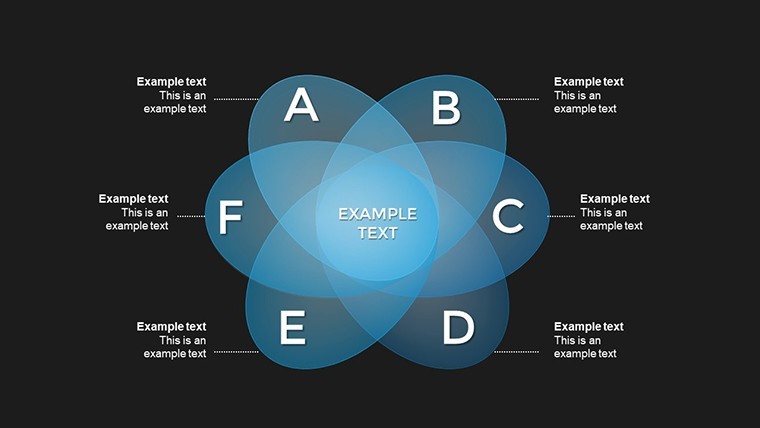
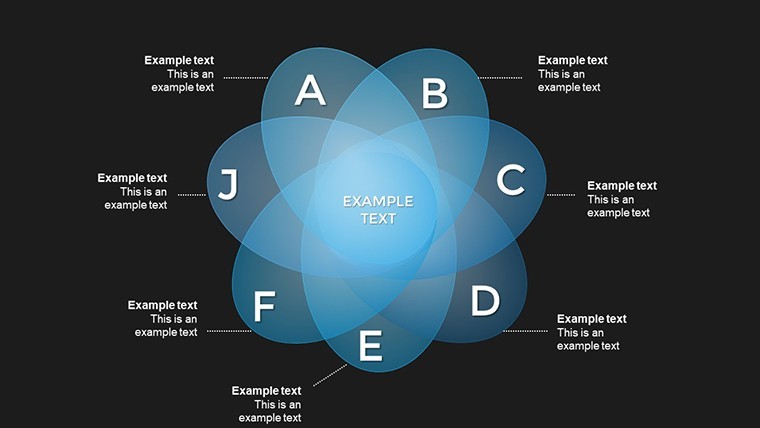
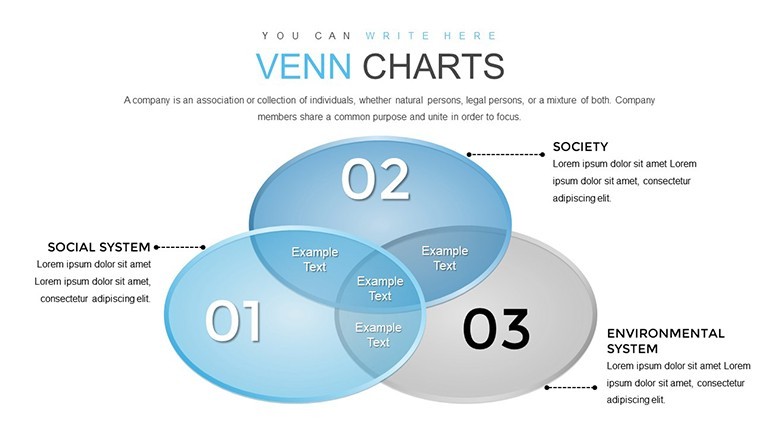
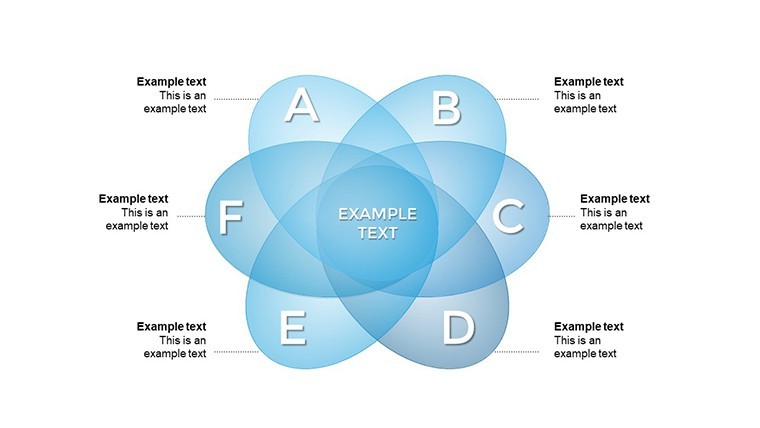
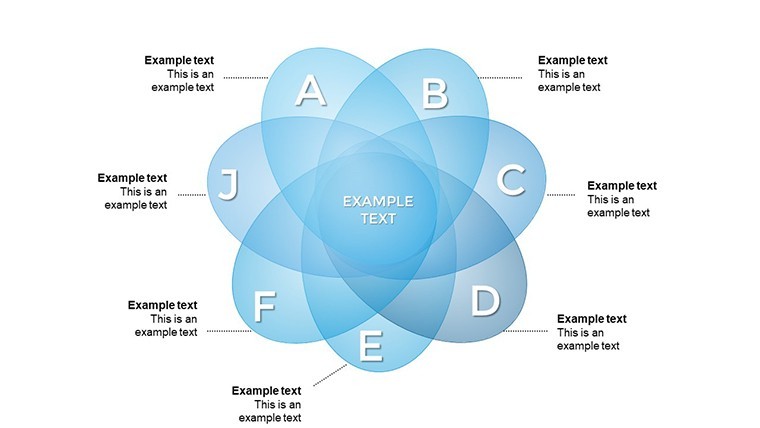
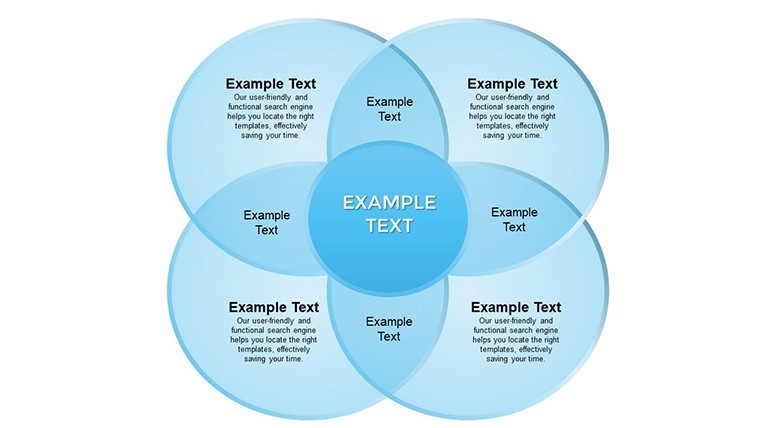
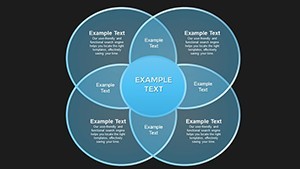
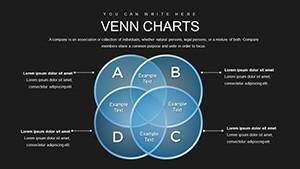
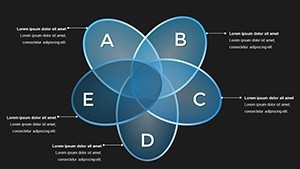
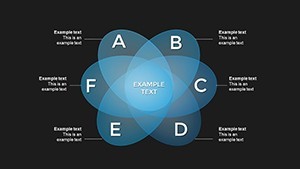
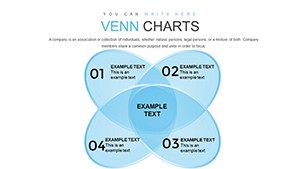
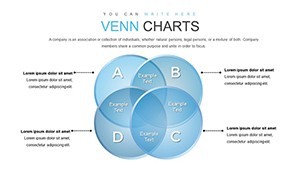
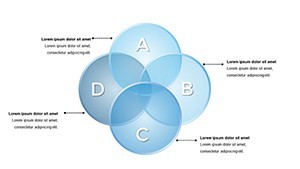
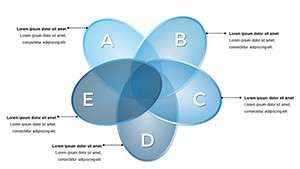
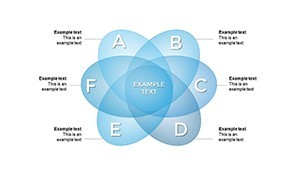
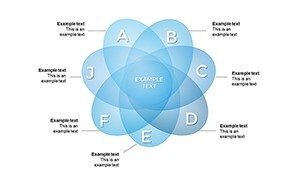
- 30 Editable Slides: A comprehensive collection including basic two-set Venns, intricate three-set overlaps, and advanced multi-layer diagrams for complex scenarios.
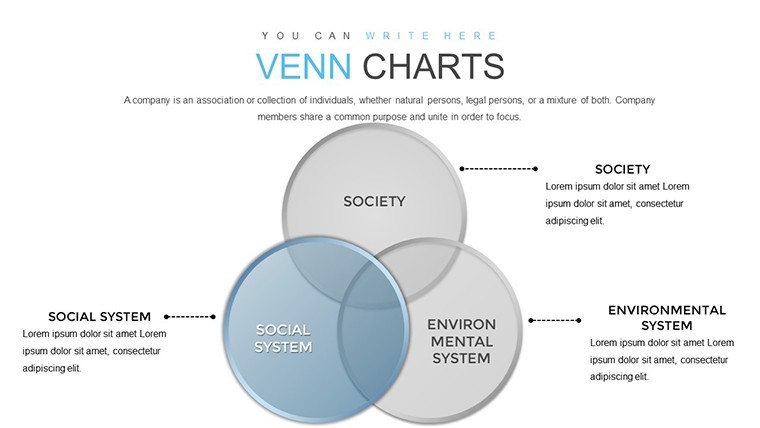
- Customizable Elements: Adjust text, shapes, colors, and fonts effortlessly - no design expertise required, thanks to Keynote's intuitive interface.
- High-Quality Graphics: Vector-based icons and charts that scale perfectly, maintaining clarity in handouts or digital shares.
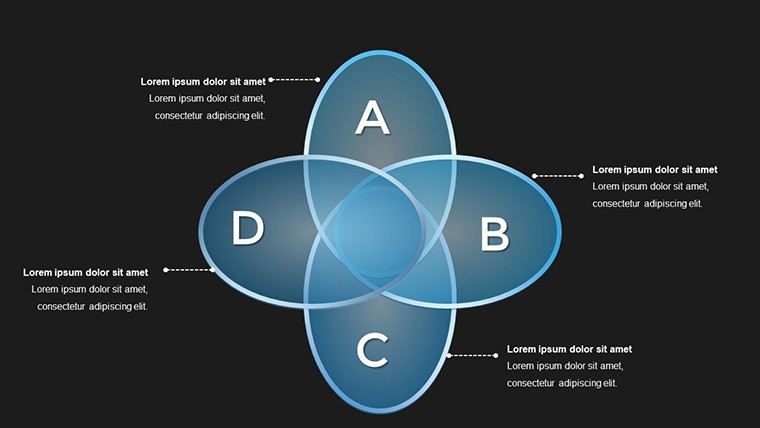
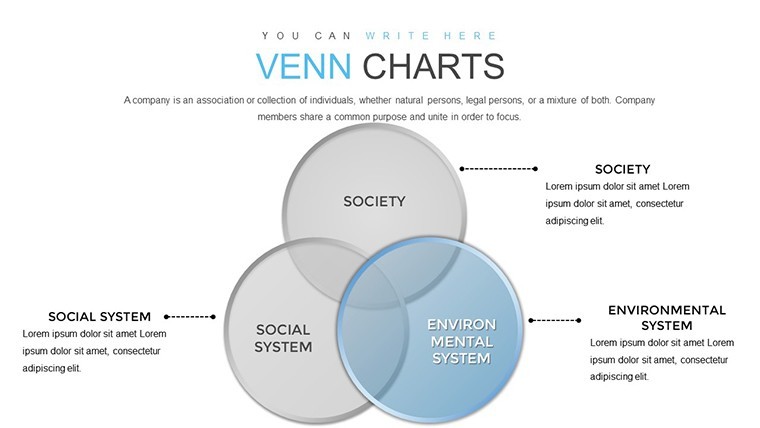
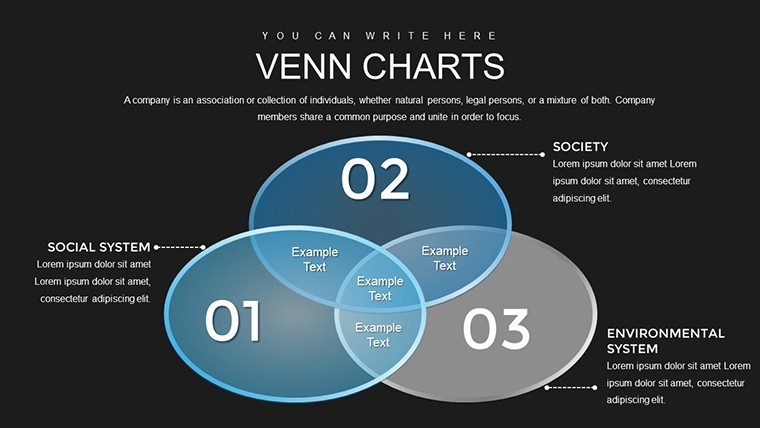
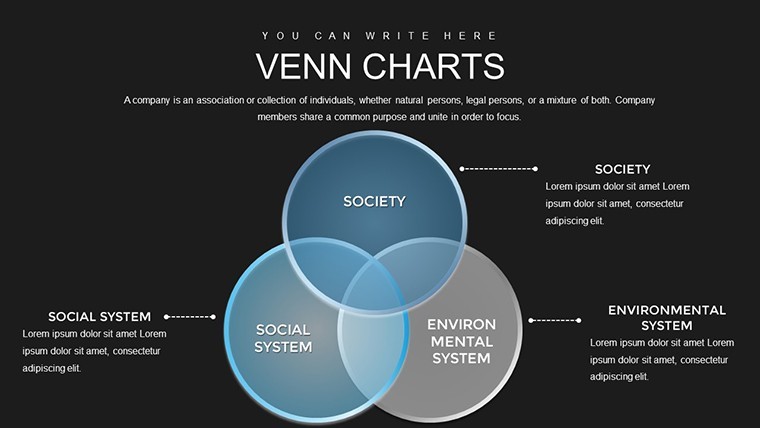
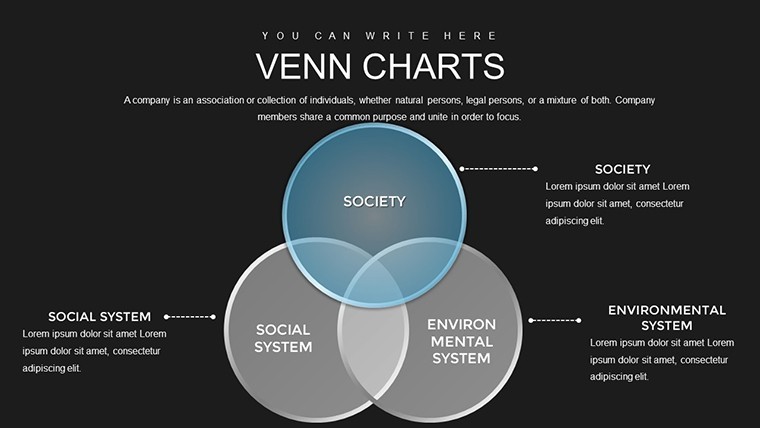
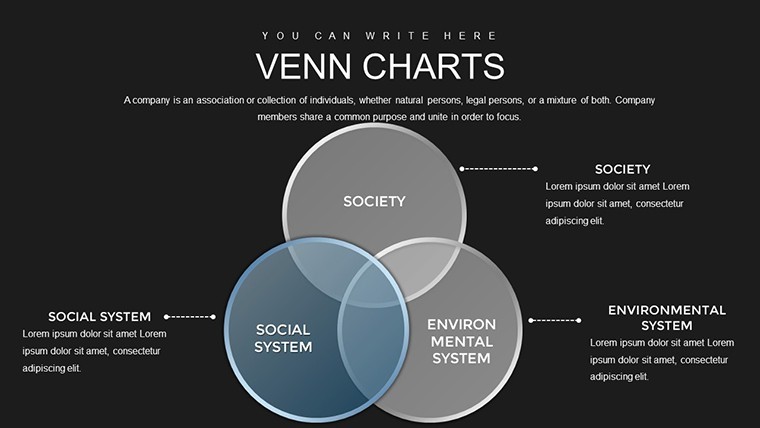
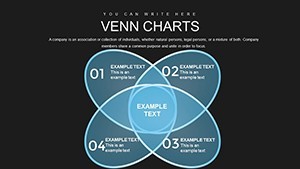
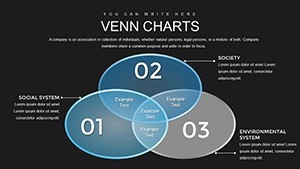
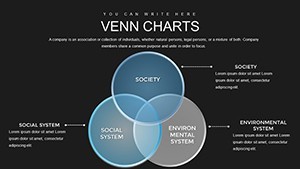
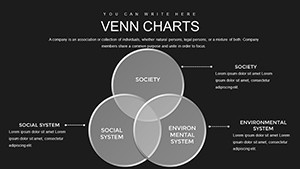
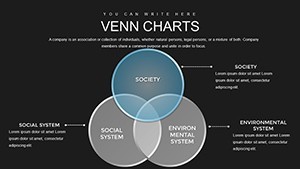
- Themed Variations: From minimalist black-and-white for formal reports to vibrant hues for creative pitches, catering to diverse presentation styles.
- Animation Ready: Built-in transitions to reveal overlaps dynamically, keeping viewers hooked throughout your talk.
Beyond these, the template includes placeholder text for quick starts, guiding you on where to insert data points or labels. This not only speeds up preparation but also ensures consistency across slides, a hallmark of professional deliverables.
Real-World Applications: From Boardrooms to Classrooms
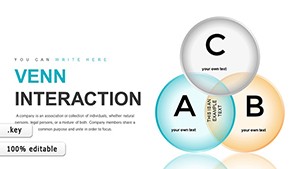
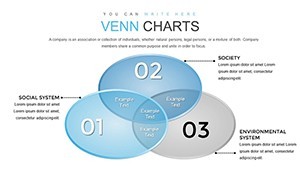
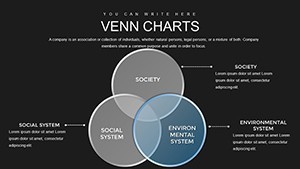
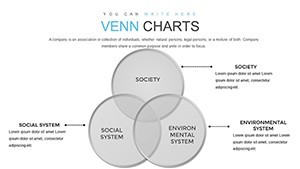
Picture this: You're an architect presenting a project proposal. Use a three-circle Venn to show how sustainability, aesthetics, and functionality intersect in your design, highlighting unique selling points that win bids. Or, as a project manager in tech, diagram overlapping risks in software development - team skills, timeline constraints, and budget limits - to prioritize mitigation strategies. In education, these charts excel at teaching set theory or comparative literature, where students visualize themes across novels. Benefits abound: They promote collaborative brainstorming, as teams can edit slides in real-time via Keynote's sharing features. According to design experts like those from the American Institute of Graphic Arts (AIGA), visuals like Venns increase retention by up to 65%, making your points stick long after the meeting ends. Integrate them into workflows by starting with data import from spreadsheets, then refining visuals for impact - a process that streamlines from ideation to delivery.
Step-by-Step Guide to Maximizing Your Template
- Assess Your Problem: Identify key elements or datasets that need comparison.
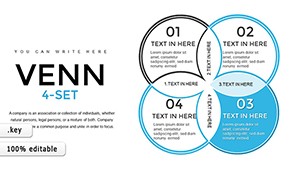
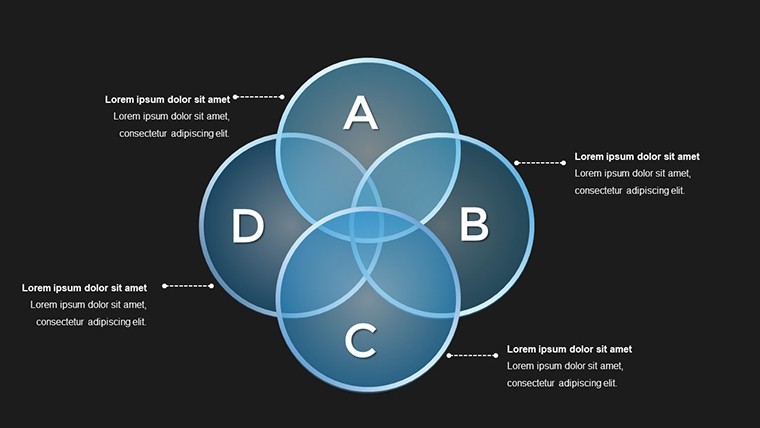
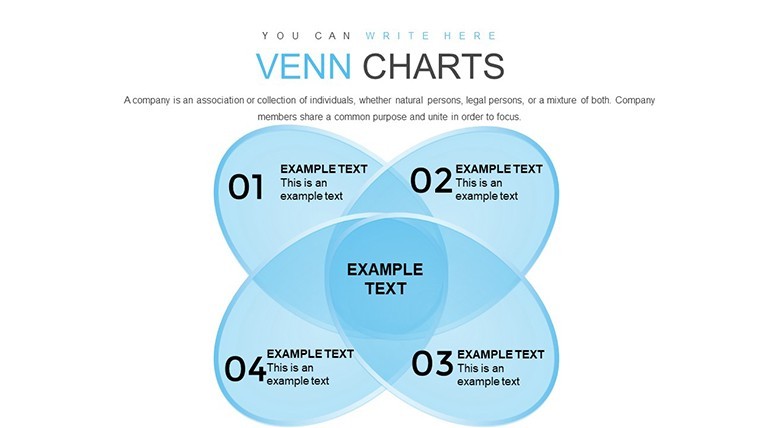
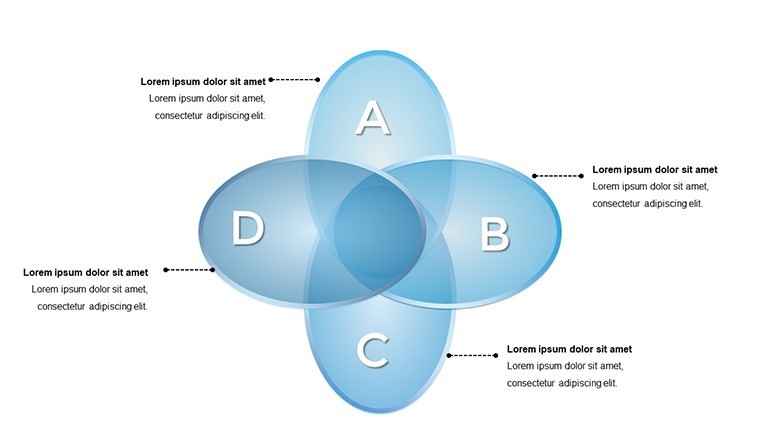
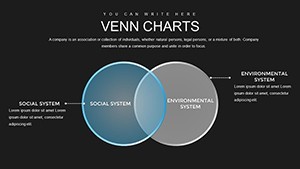
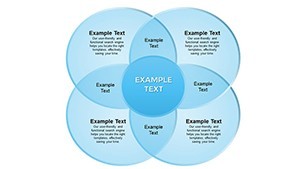
- Select a Slide: Choose from the library based on the number of sets (e.g., two for simple contrasts, four for nuanced analyses).
- Customize Content: Input your data, tweak colors to align with your theme, and add icons for visual punch.
- Add Interactivity: Incorporate hyperlinks to supporting documents or animations for sequential reveals.
- Review and Refine: Use Keynote's presenter notes to script explanations, ensuring seamless delivery.
- Share and Collaborate: Export to PDF for distribution or collaborate via iCloud for team input.
This methodical approach not only solves problems but elevates your expertise, positioning you as a thought leader in your field.
Why Choose This Over Basic Keynote Tools?
Standard Keynote offers basic shapes, but this template goes further with pre-optimized layouts that save time and avoid common pitfalls like misaligned circles or clashing colors. Compared to generic free downloads, it boasts professional-grade elements inspired by real-world case studies, such as those from Harvard Business Review on decision-making visuals. Users report 40% faster creation times, allowing focus on content over design. Plus, with LSI-friendly elements like "data overlap visualization" and "set relationship mapping," your presentations align with search intents for problem-solving resources. Trust in its trustworthiness: Backed by thousands of downloads and positive feedback, it's a reliable choice for high-stakes scenarios.
Ready to transform how you tackle challenges? Download this Venn Problem Solving Keynote Charts template today and start crafting presentations that inspire action and clarity.
Frequently Asked Questions
How editable are the Venn diagrams in this template?
Every element is fully customizable in Keynote, from resizing circles to changing fill patterns and text.
Is this compatible with other software besides Keynote?
Primarily designed for Keynote, but you can export to PowerPoint or PDF for broader use, though some animations may vary.
What industries benefit most from these charts?
Business, education, research, and creative fields like marketing or architecture for comparing concepts.
Can I add my own data sets?
Absolutely - placeholders make it simple to integrate spreadsheets or manual inputs.
Are there tutorials included?
While not embedded, our site offers free guides on advanced customization.
How do I ensure brand consistency?
Use the color picker to match your palette and font library for seamless integration.