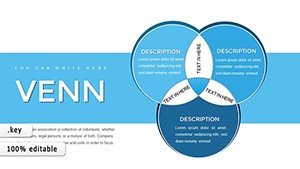
Versatile Venn Keynote Diagrams Template: Illuminate Connections Effortlessly


Type: Keynote Charts template
Category: Venn
Sources Available: .key
Product ID: KC00787
Template incl.: 34 editable slides
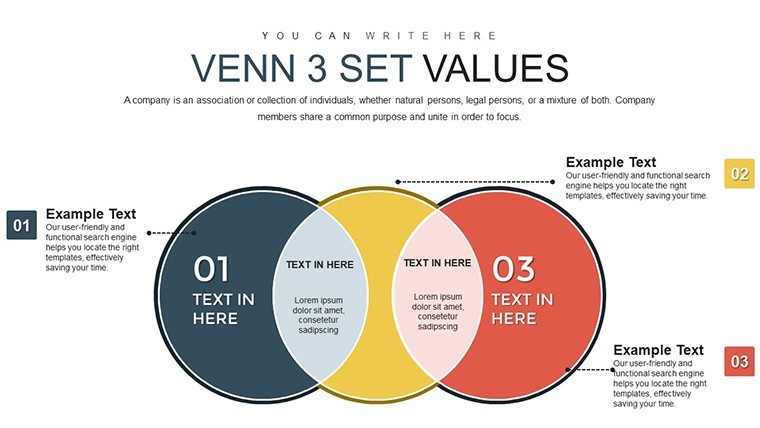
In an era where data drives decisions, presenting relationships between ideas requires tools that blend simplicity with sophistication. Our Venn Keynote Diagrams and Charts Template, boasting 34 editable slides, is engineered to do just that - helping you map out similarities, differences, and intersections with visual precision. Perfect for business professionals untangling market dynamics or educators simplifying conceptual links, this template turns abstract thoughts into tangible visuals. Think of it as your secret weapon for workshops where ideas collide, fostering innovation and understanding.
Compatible solely with Apple Keynote, it promises a hassle-free experience, from import to export. Drawing authority from methodologies in publications like MIT Sloan Management Review, where Venn diagrams clarified collaborative strategies, this tool enhances your presentations' trustworthiness. Benefits extend to quicker preparation, deeper audience comprehension, and memorable takeaways, all while aligning with user-focused design principles.
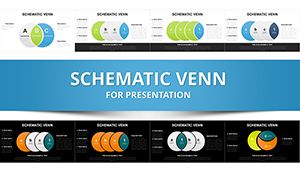
Standout Features for Effective Communication
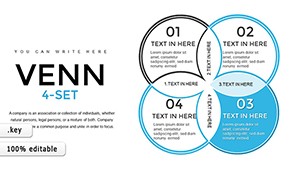
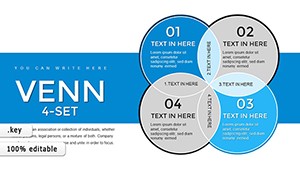
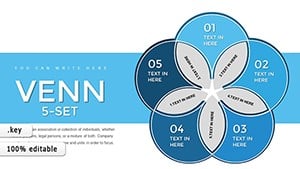
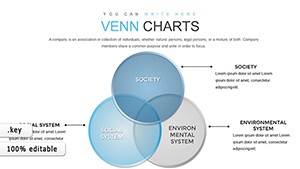
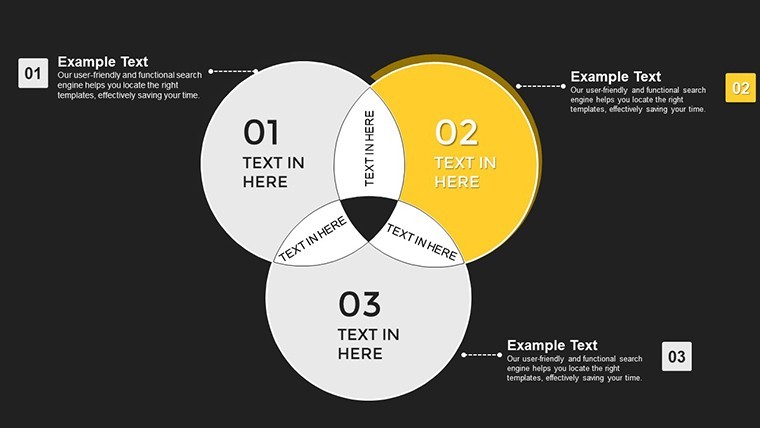
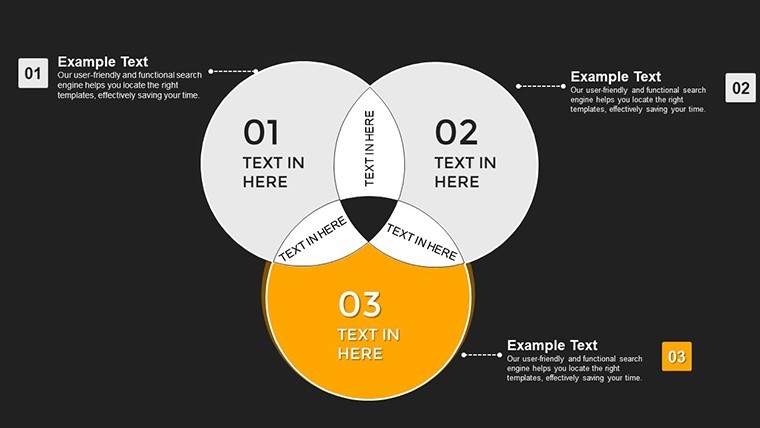
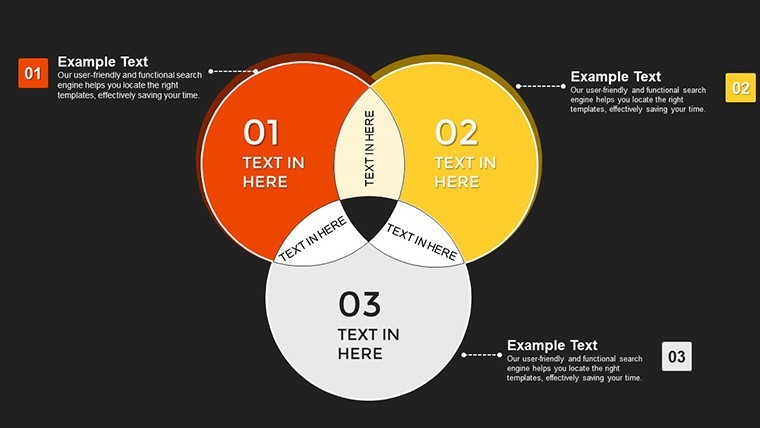
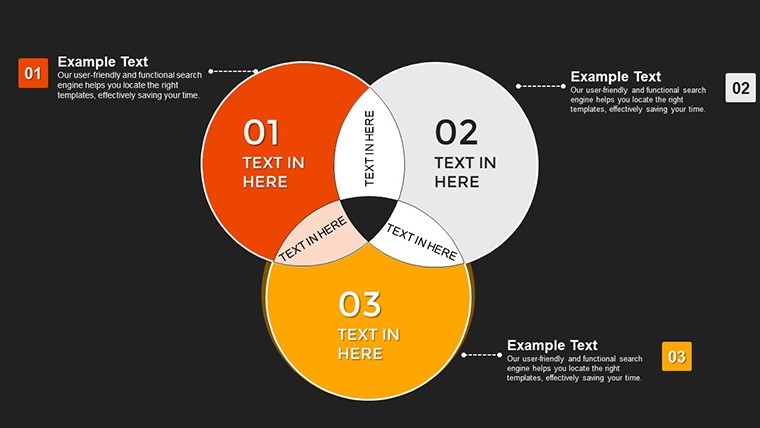
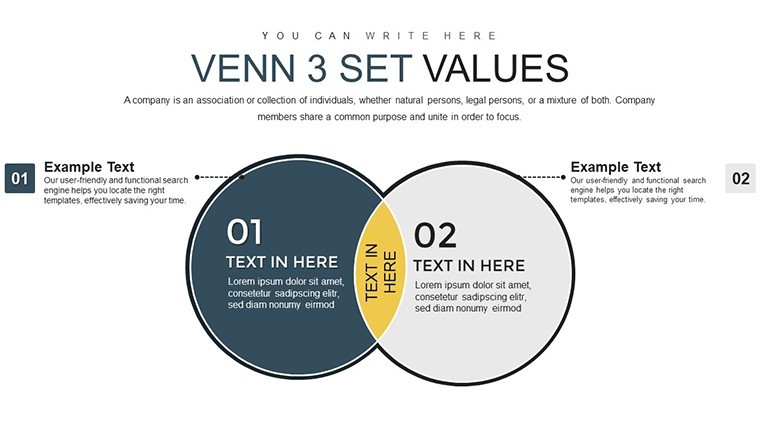
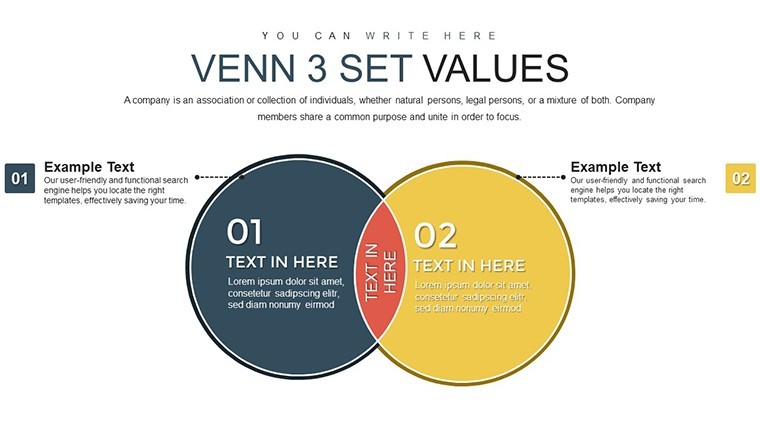
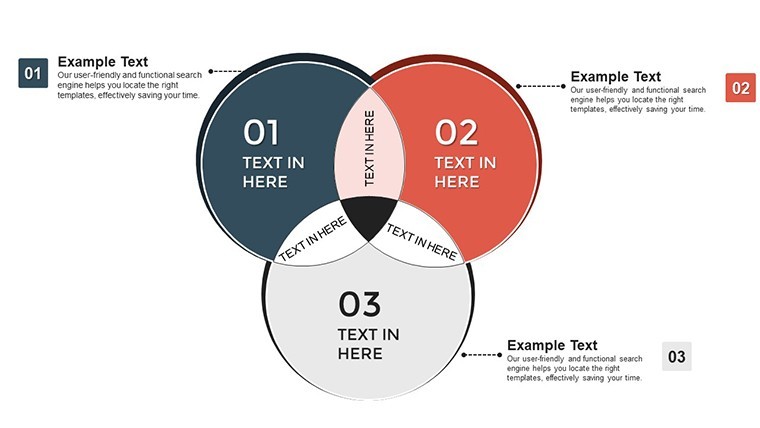
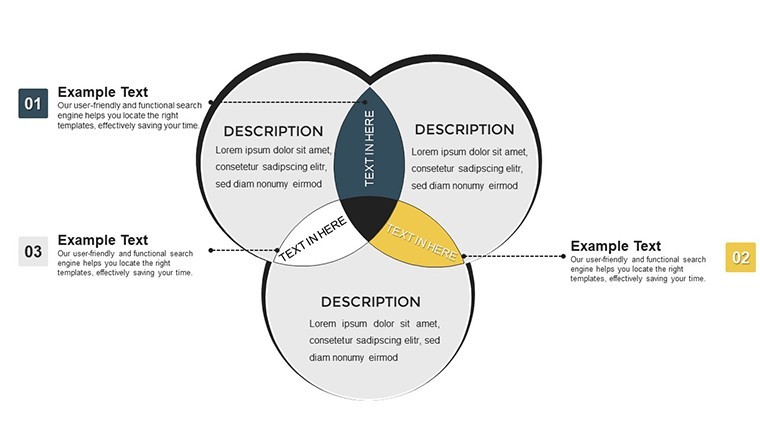
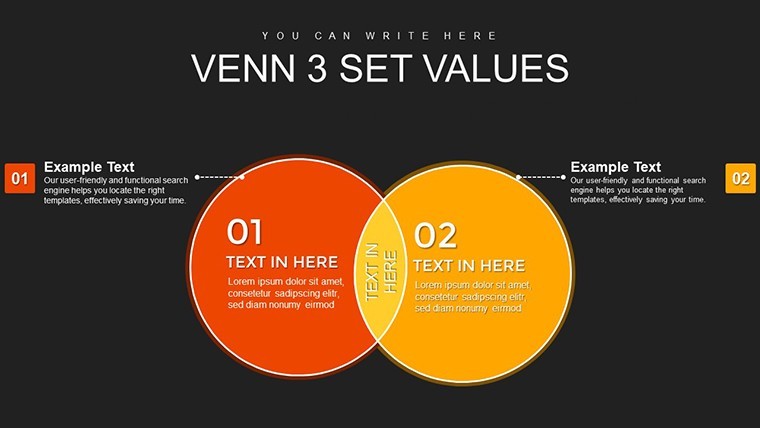
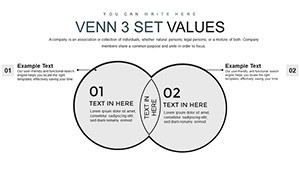
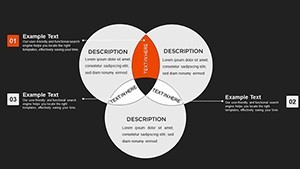
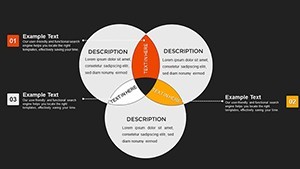
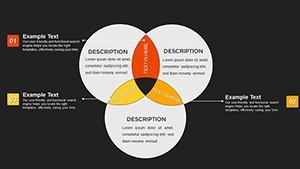
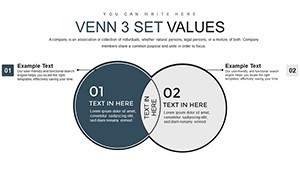
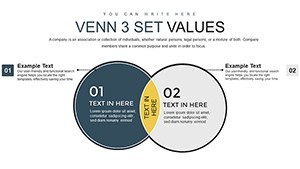
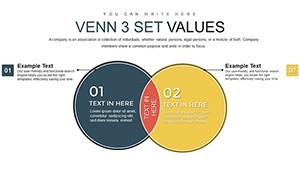
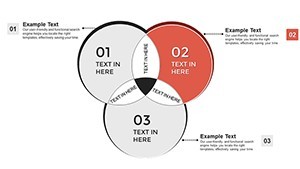
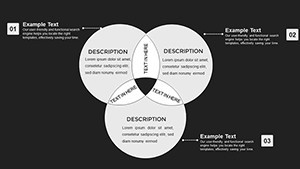
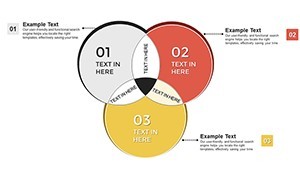
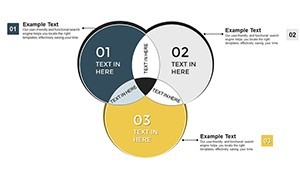
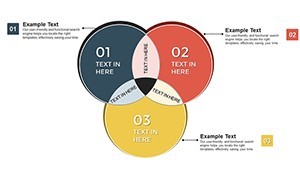
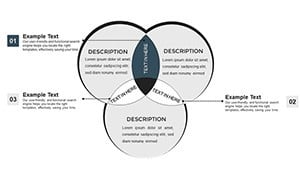
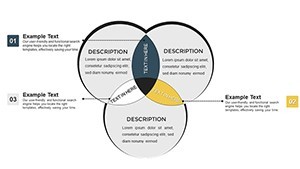
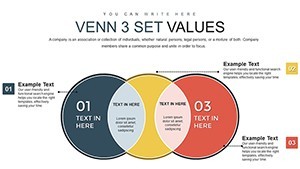
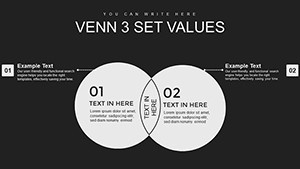
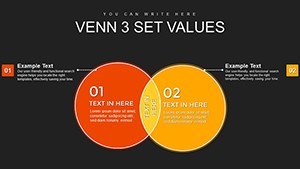
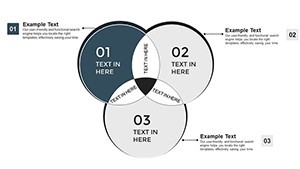
This template's strength lies in its adaptable architecture. Featuring one- to multi-set Venns, each slide allows for color adjustments to denote varying degrees of overlap, ensuring your message lands clearly.
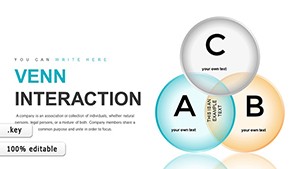
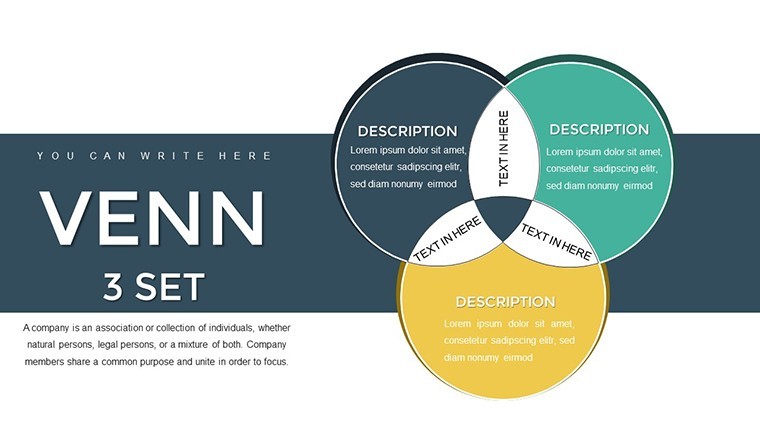
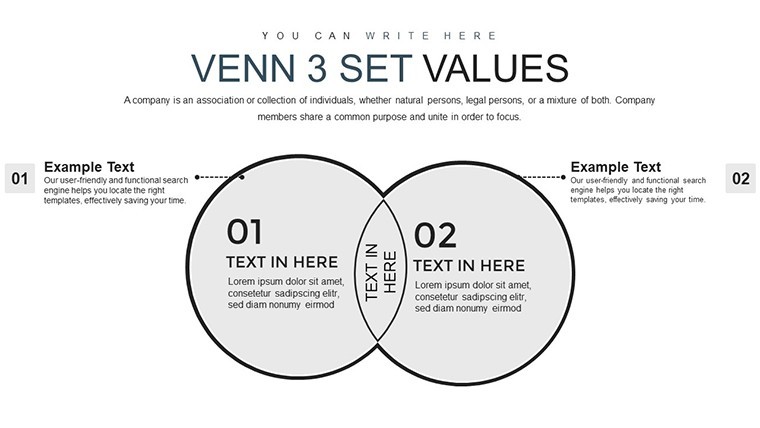
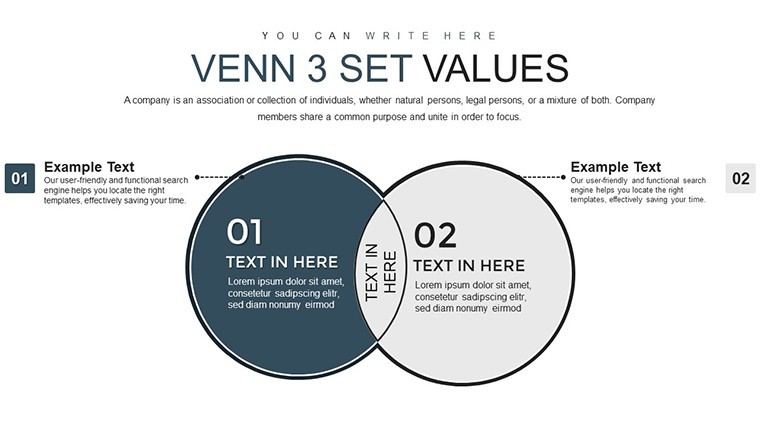
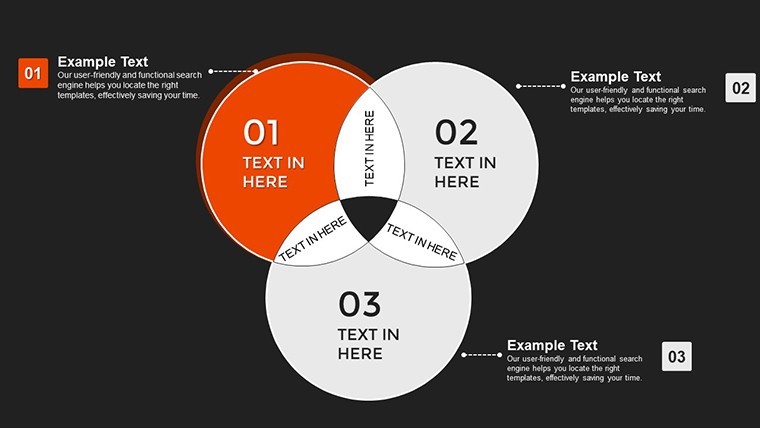
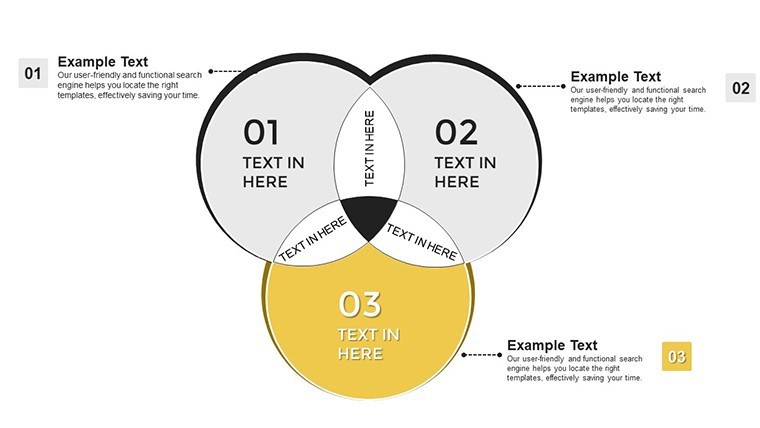
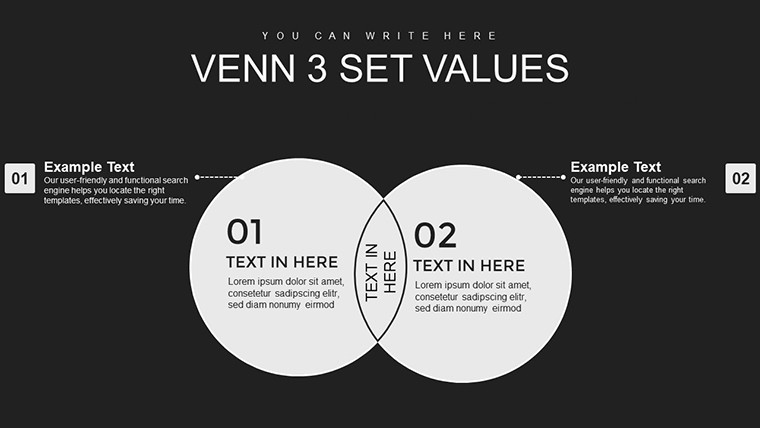
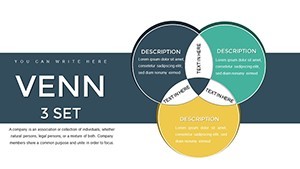
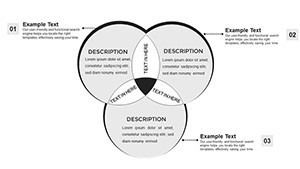
- Range of Configurations: From dual-set for basic comparisons to advanced multi-sets for layered analyses.
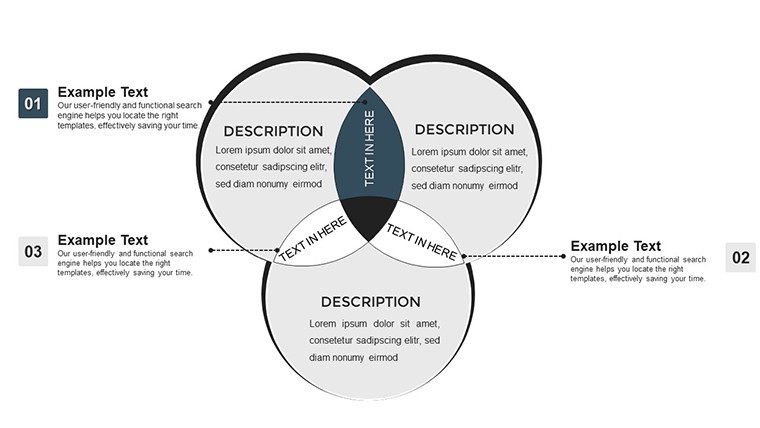
- Graphic Enhancements: Incorporate icons, text boxes, and embedded charts for enriched storytelling.
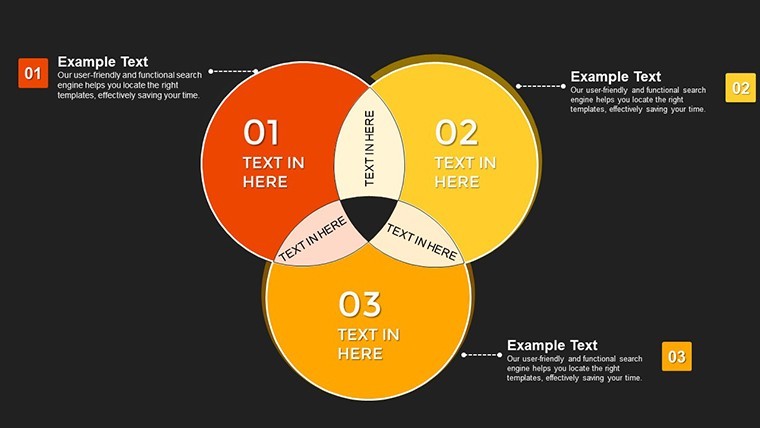
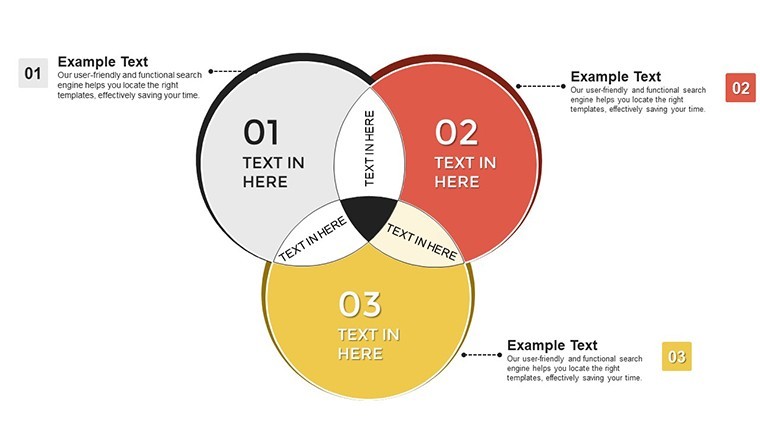
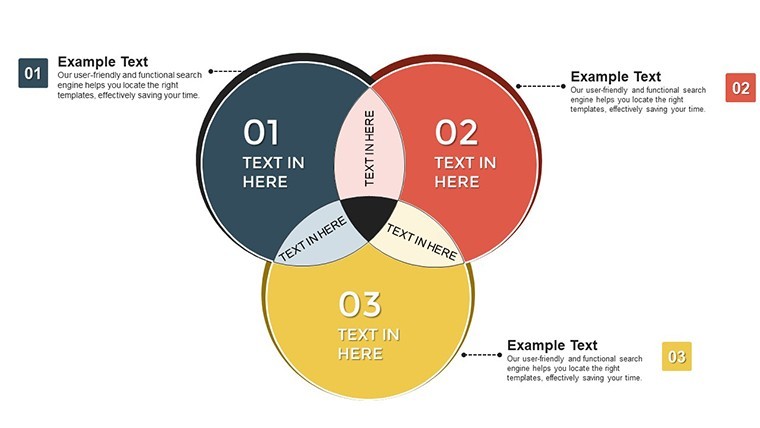
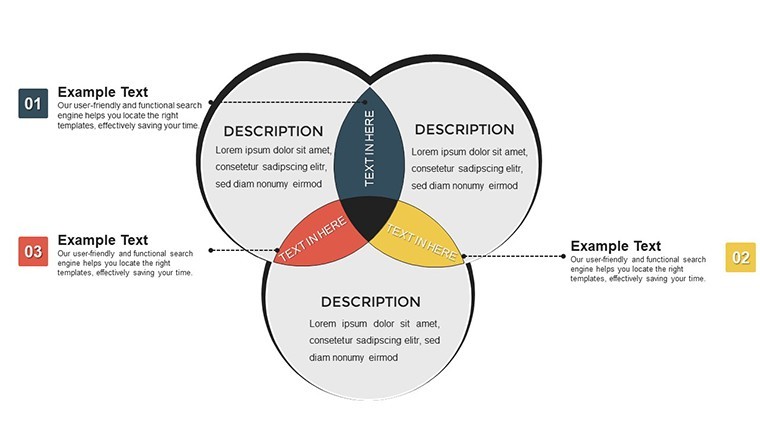
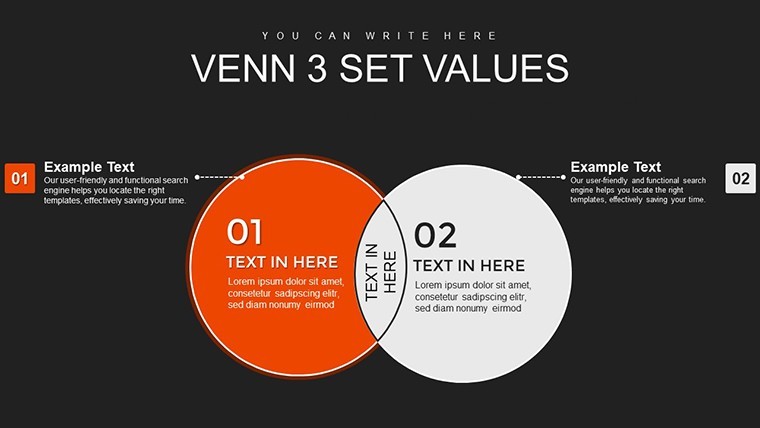
- Modern Palettes: Neutral tones for corporate settings or vivid colors for educational vibrancy.
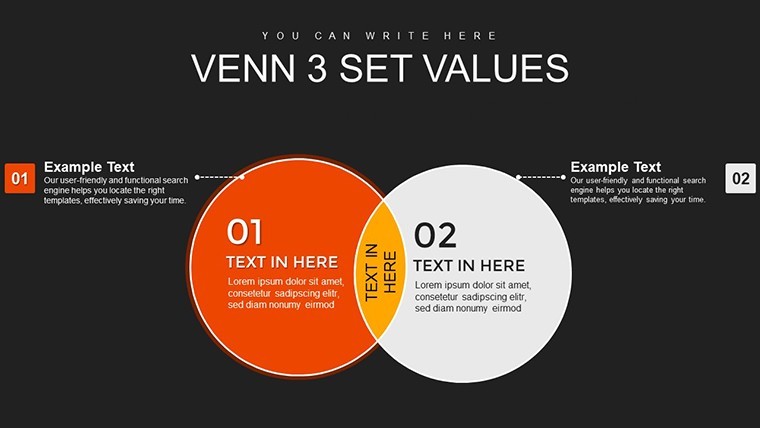
- User-Friendly Edits: Resize, recolor, and reposition elements with intuitive controls.
- High-Resolution Quality: Vector graphics maintain sharpness across devices.
Inspired by cognitive science, these features minimize visual noise, per guidelines from the International Institute for Information Design.
Practical Use Cases Explored
Apply this template across domains for transformative results. In business shows, diagram competitor overlaps in features, pricing, and customer bases - a tactic that aided a startup in a TechCrunch-featured pitch to secure venture capital. For teaching tools, intersect historical events with cultural influences, adhering to educational standards from the National Council for Social Studies.
Data showing becomes intuitive: Overlay survey results to spotlight trends. In plan making, visualize stakeholder alignments, as in a UN project management case where Venns streamlined resource distribution.
- Launch Keynote and load the template.
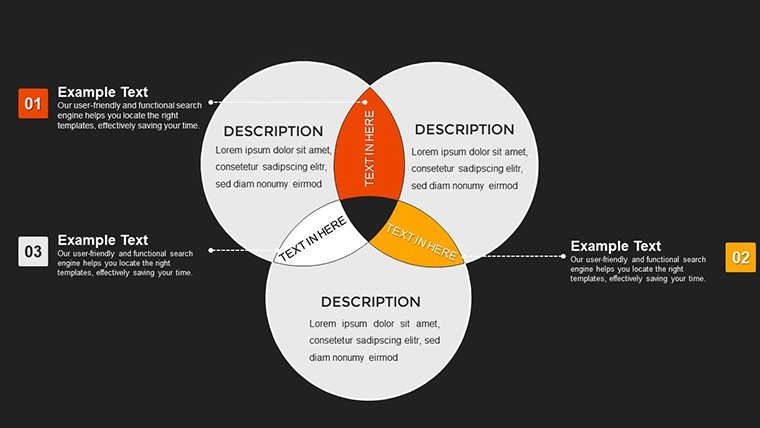
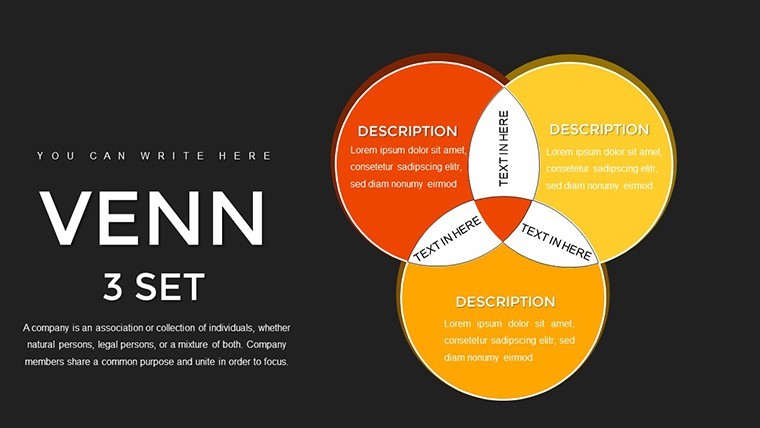
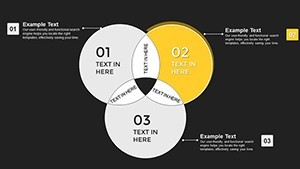
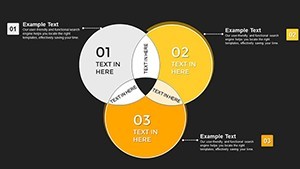
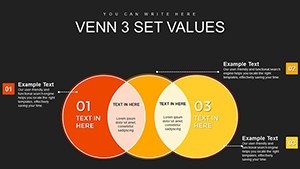
- Pick a Venn configuration based on your sets - e.g., three for triangulating ideas.
- Fill in labels and data, using bold for emphasis.
- Animate overlaps to unfold during your narrative.
- Review and share: Export to video for asynchronous viewing.
This outperforms native Keynote options by offering pre-designed variety, reducing creation time by half.
Boosting Idea Generation Sessions
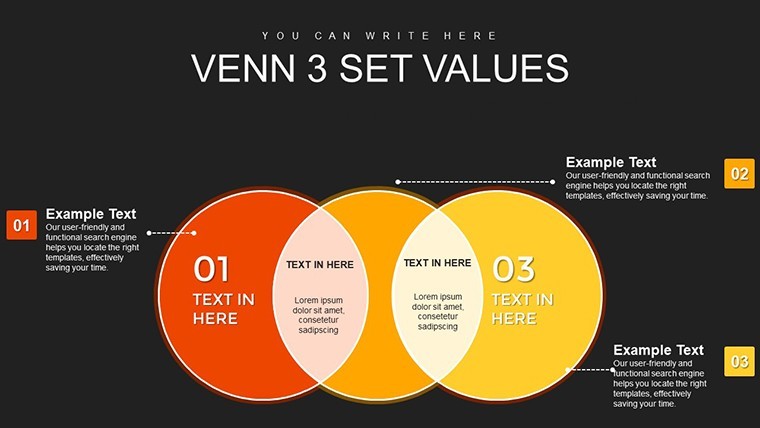
For brainstorming, use multi-set Venns to merge team inputs, sparking creativity as in Google's innovation labs. Tip: Pair with sticky notes digitally for hybrid sessions, ensuring inclusivity per DEI best practices.
Superiority in the Presentation Landscape
Outshining free alternatives that lack polish, this $22 template provides pro-level assets. Users cite improved feedback loops, with one analyst noting clearer reports led to faster approvals. Seamlessly works with apps like Notion for data syncing.
Trust is built-in with clean, error-free designs that scale flawlessly.
Pro Tips to Elevate Your Delivery
Start with audience analysis: Tailor Venn complexity to their expertise. Reference credible data, like from Pew Research, to substantiate visuals. In remote setups, use pointer tools to guide focus. Revise iteratively - the template's flexibility supports endless tweaks.
Discover the ease of insightful presentations. Download the Venn Keynote Diagrams Template and connect ideas like never before.
Frequently Asked Questions
- How many sets can the Venn diagrams support?
- Up to multiple sets, with slides for 1-5+ configurations.
- Are the diagrams fully customizable?
- Yes, edit every aspect from colors to layouts in Keynote.
- Ideal for which industries?
- Business, education, research, planning, and creative fields.
- Can I add animations?
- Certainly; built-in options for engaging reveals.
- What if I'm new to Keynote?
- The template includes simple guides for quick starts.