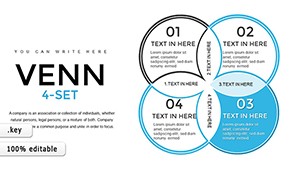
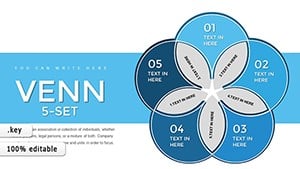
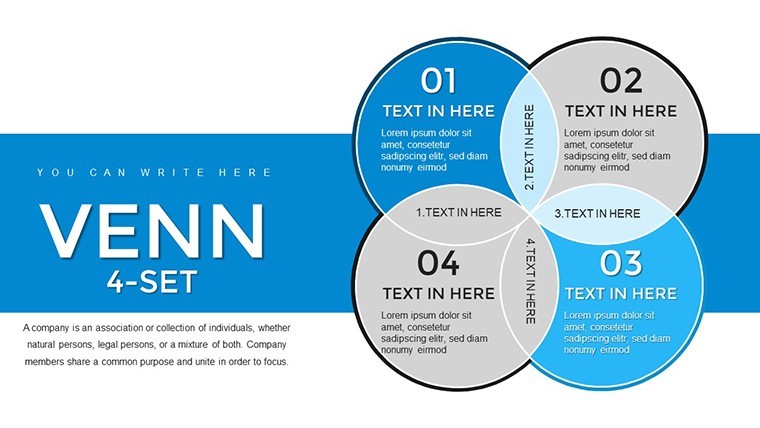
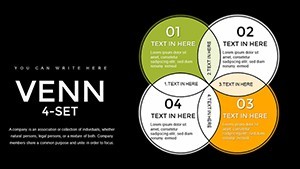
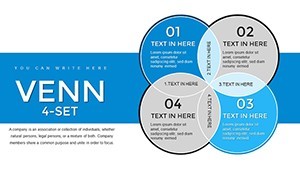
4-Set Venn Keynote Charts Template: Unlock Intricate Data Relationships


Type: Keynote Charts template
Category: Venn
Sources Available: .key
Product ID: KC00788
Template incl.: 45 editable slides
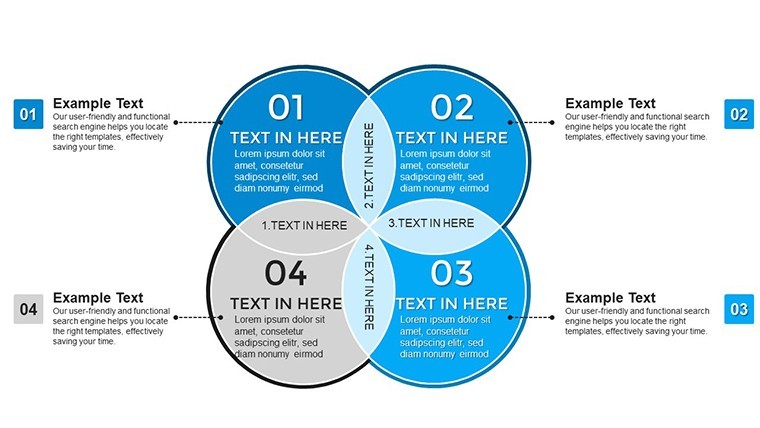
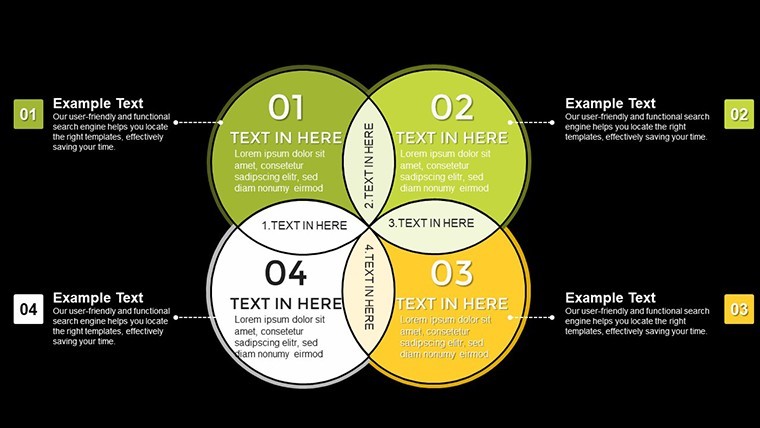
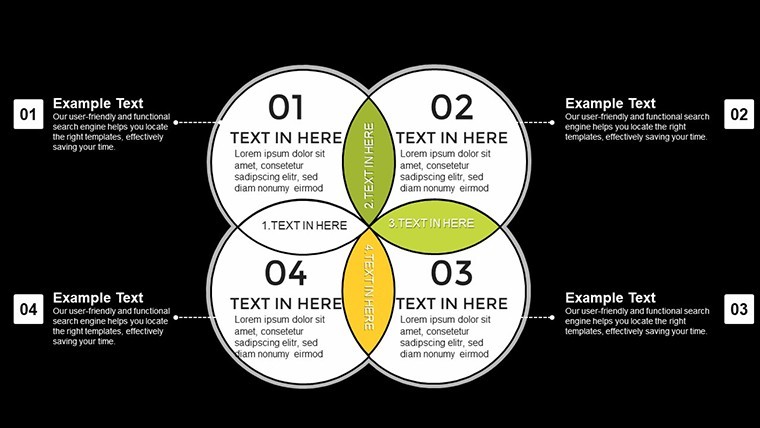
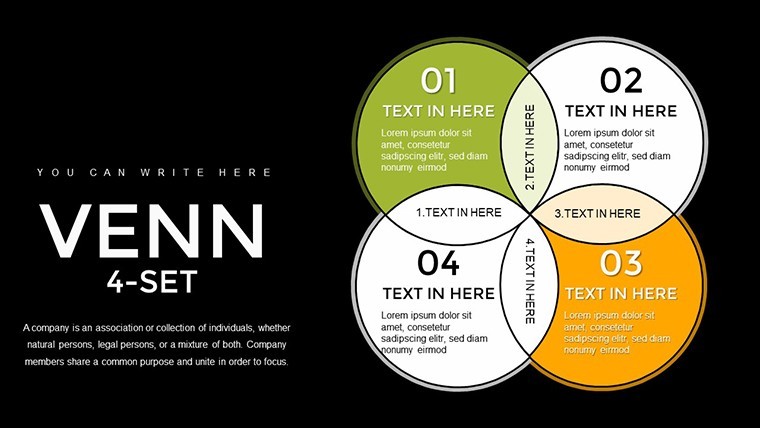
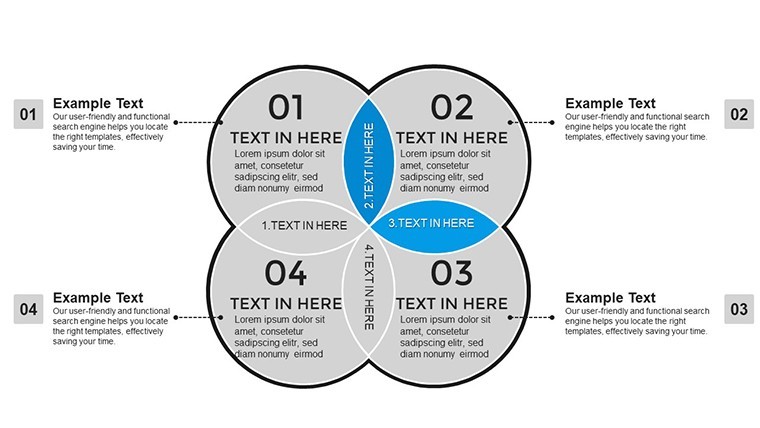
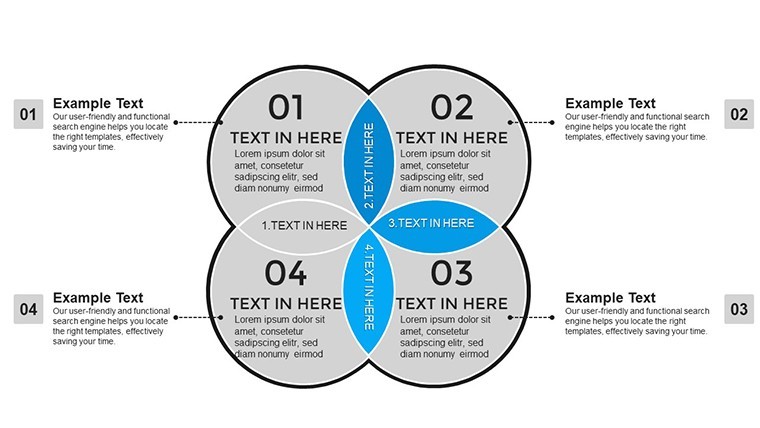
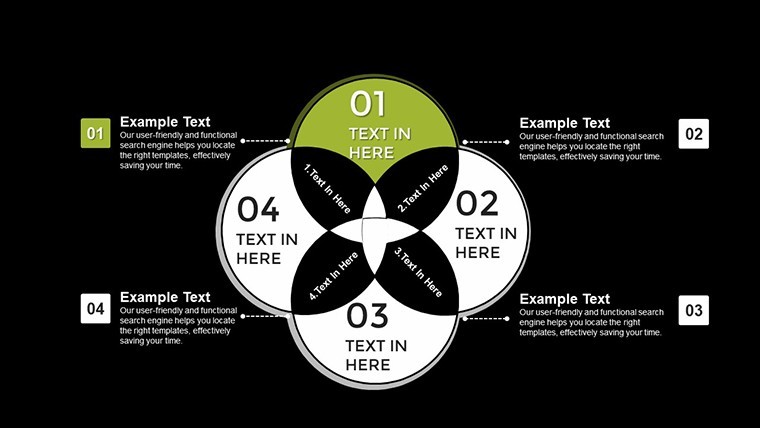
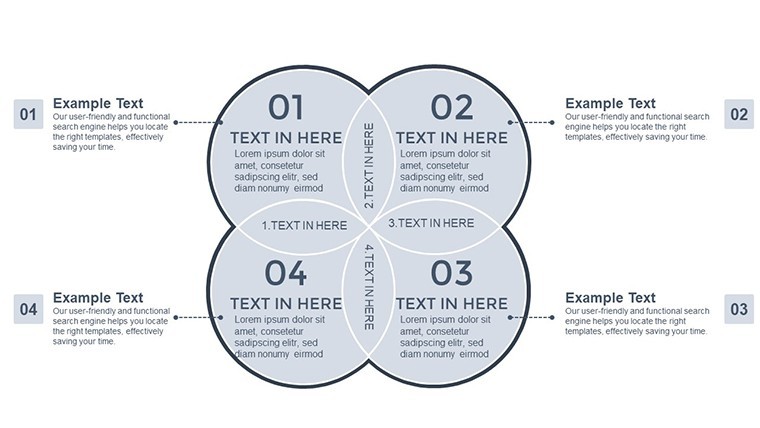
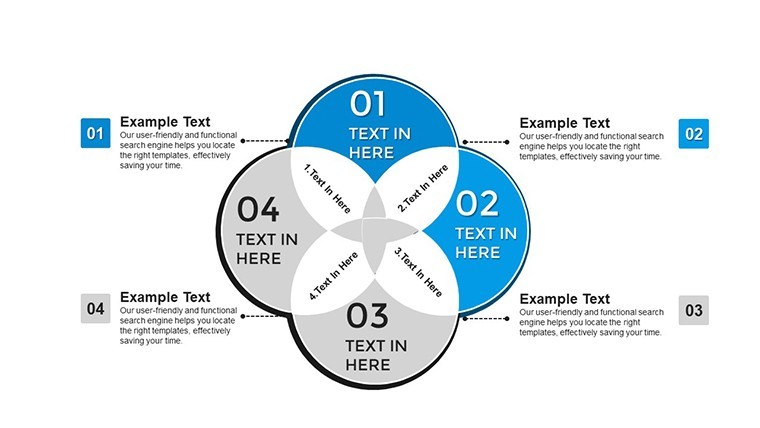
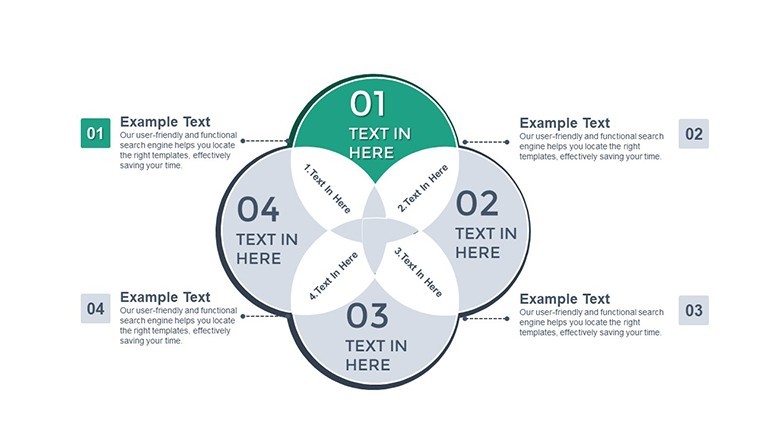
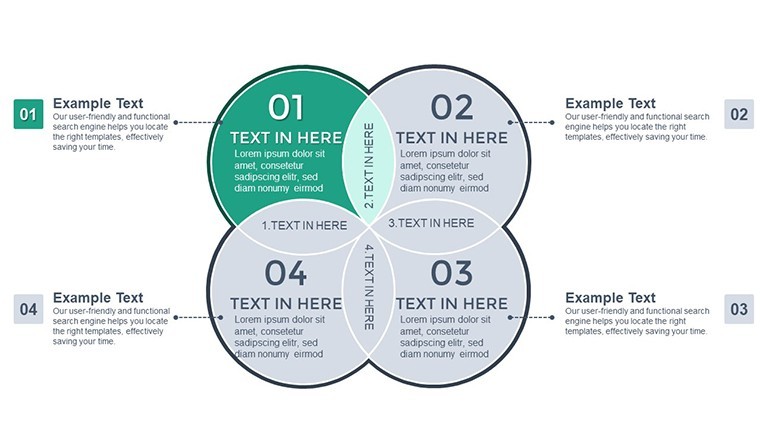
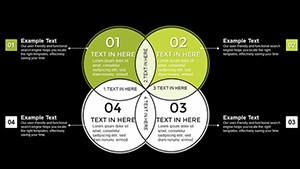
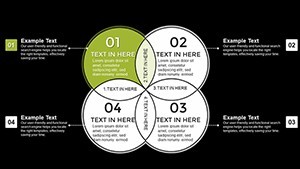
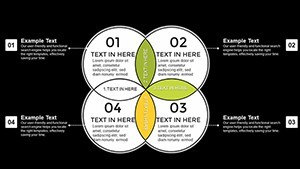
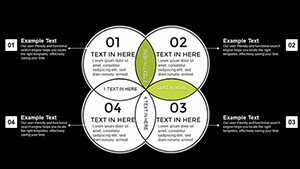
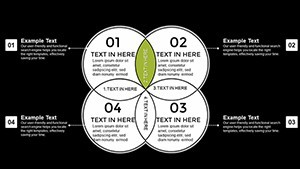
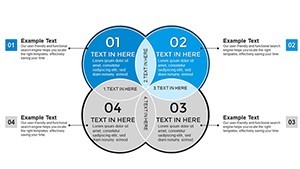
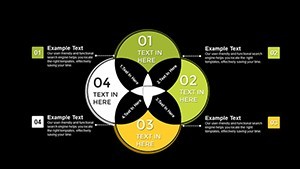
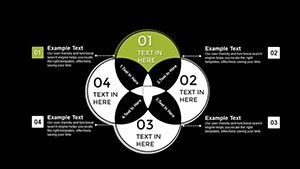
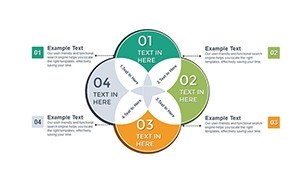
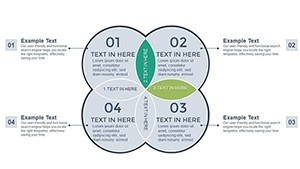
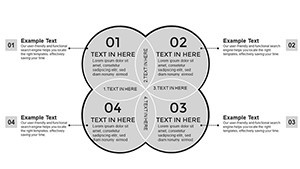
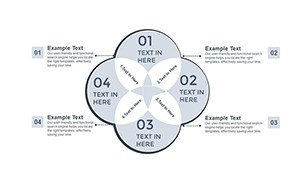
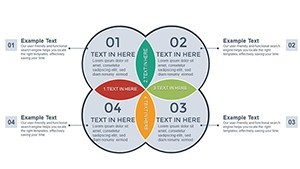
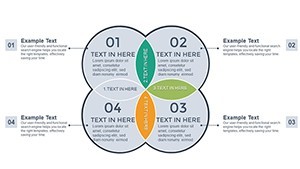
When tackling multifaceted ideas that intersect in unexpected ways, a simple diagram won't suffice. Enter our 4-Set Venn Keynote Charts Template, a powerhouse tool with 45 editable slides designed to dissect and display complex overlaps with elegance. Tailored for professionals who demand precision, this template shines in scenarios where three or more elements converge, such as market analyses or interdisciplinary studies. Picture an educator blending history, science, art, and technology in a single visual, or a business leader mapping competitor strategies - this is where true insight emerges.
Built exclusively for Apple Keynote, it offers effortless integration, allowing you to focus on content rather than creation. With its modern, minimalist design, the template enhances by drawing on proven visualization techniques from sources like Harvard Business Review case studies, where multi-set Venns clarified strategic decisions. Benefits include time savings, heightened clarity, and audience wow-factor, turning dry data into dynamic discussions. Whether you're a researcher unveiling study intersections or a trainer illustrating team synergies, this template empowers you to communicate with authority.
Essential Features for Advanced Visualization
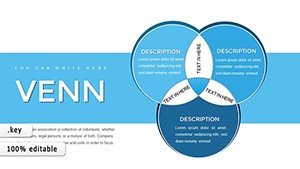
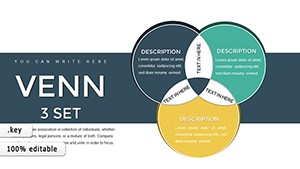
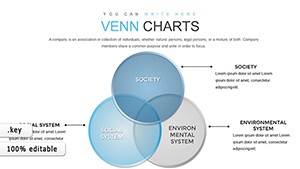
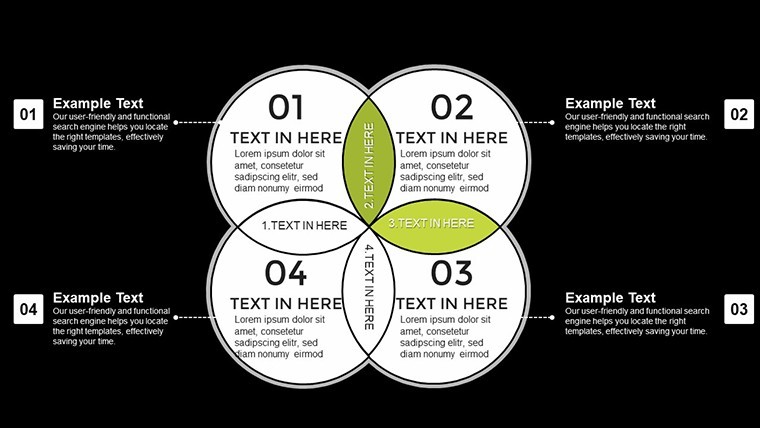
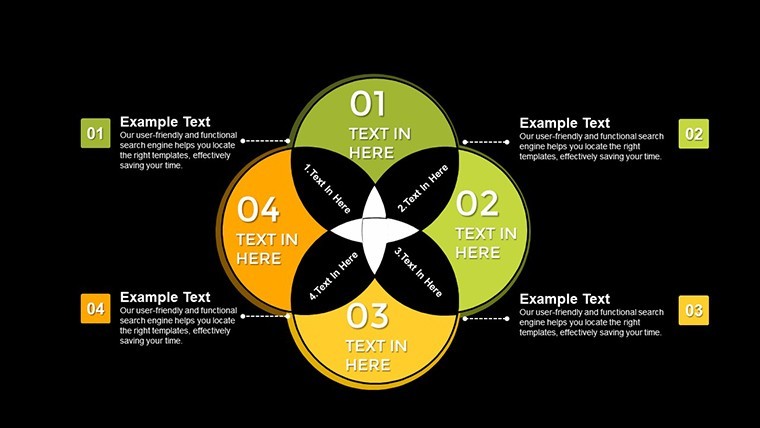
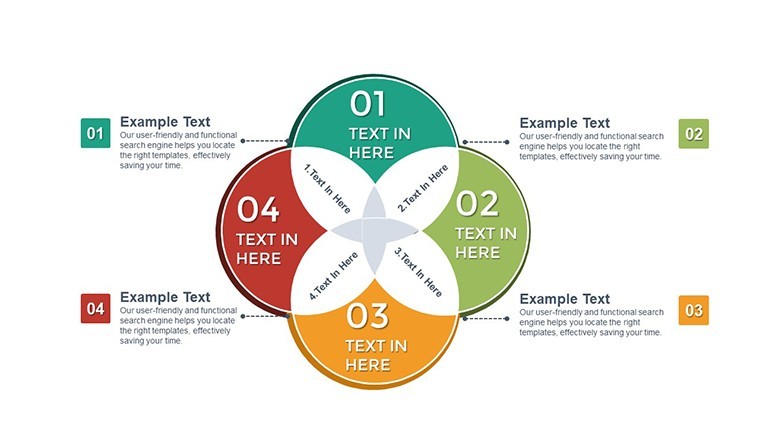
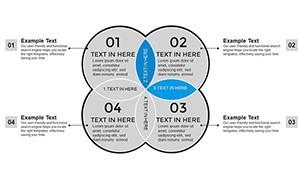
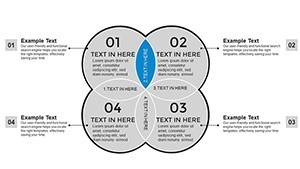
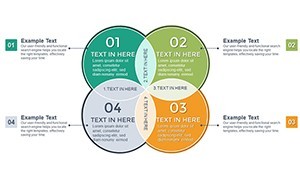
At the core of this template are features engineered for depth and adaptability. Each 4-set Venn diagram allows for up to four overlapping circles, with adjustable transparency to highlight shared zones without clutter. The slides come pre-loaded with color-coded labels, making it simple to denote unique and common attributes.
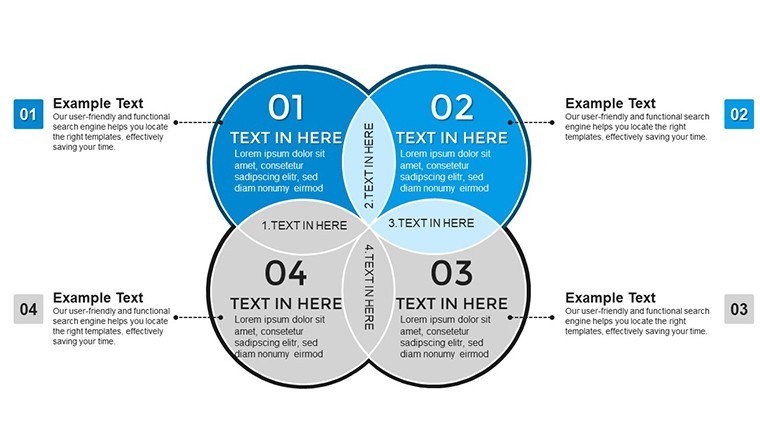
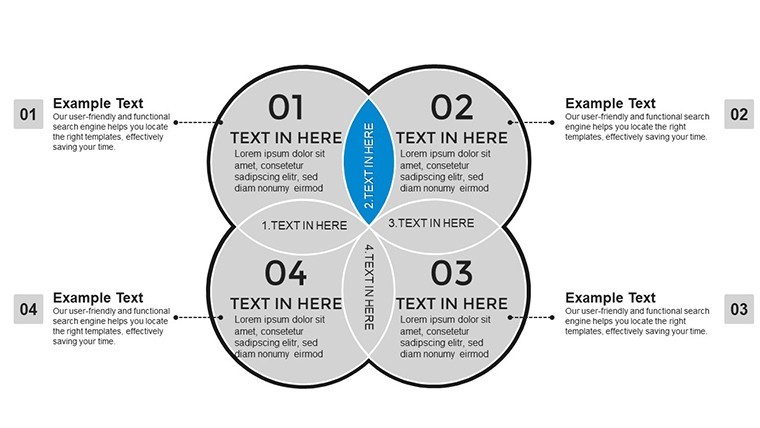
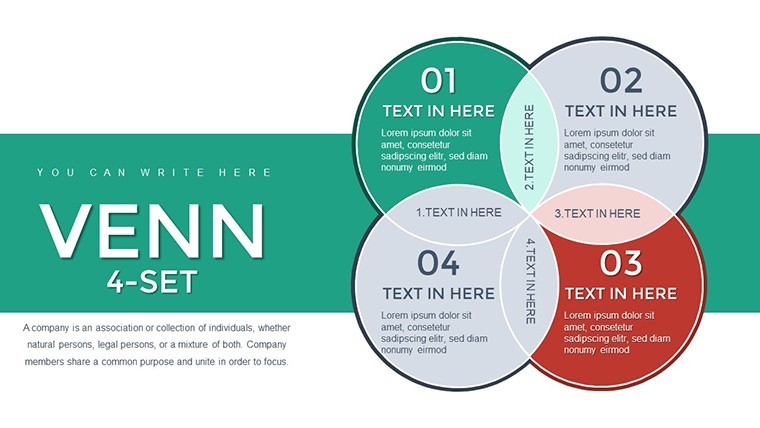
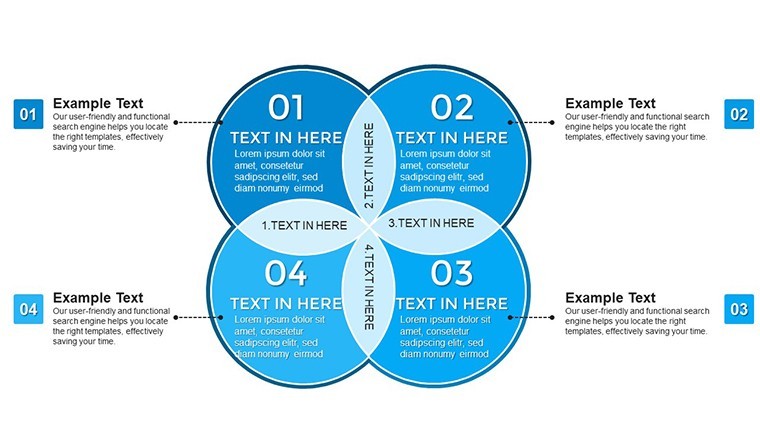
- Multi-Layer Overlaps: Handle four datasets simultaneously, ideal for nuanced comparisons like SWOT analyses across departments.
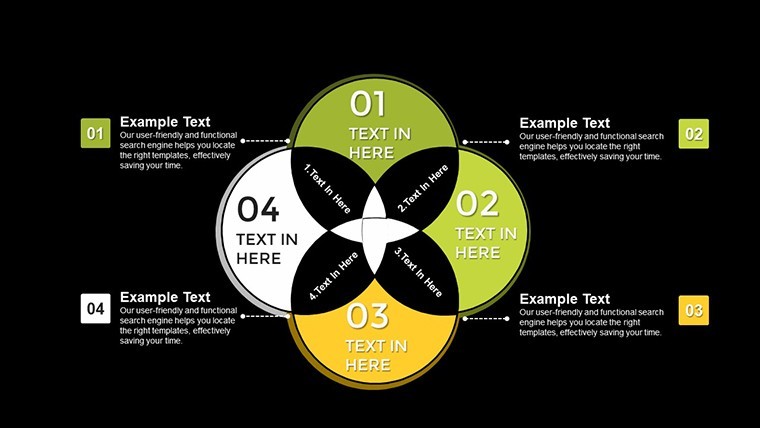
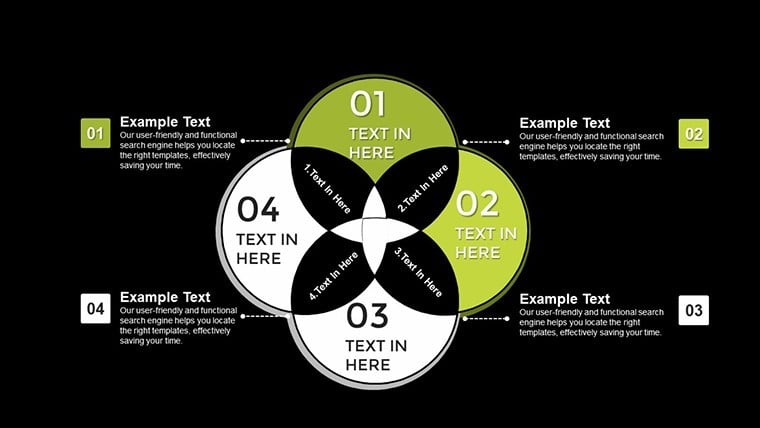
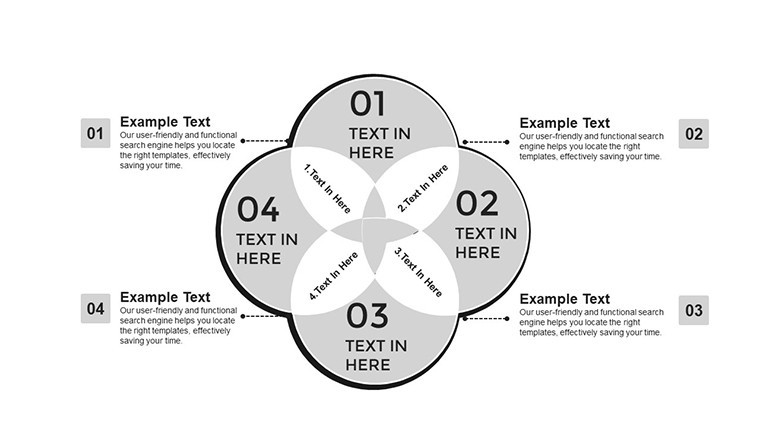
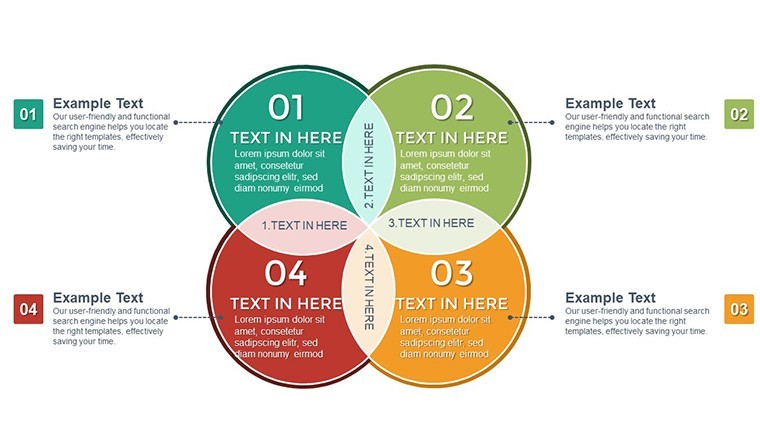
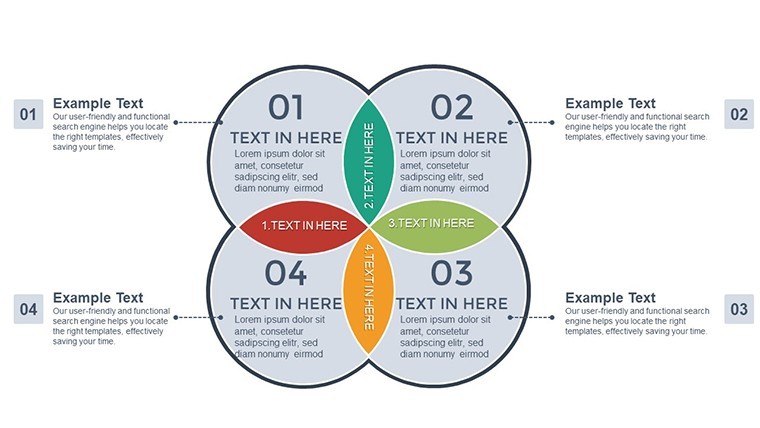
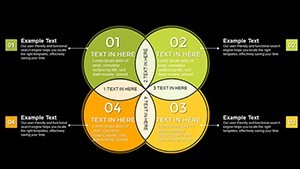
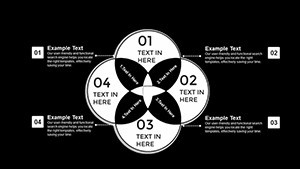
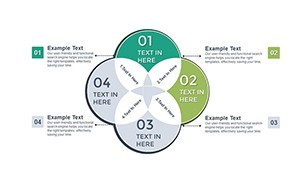
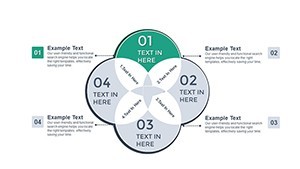
- Customizable Aesthetics: Alter shapes, gradients, and fonts to align with your branding; includes pastel and bold palettes for varied tones.
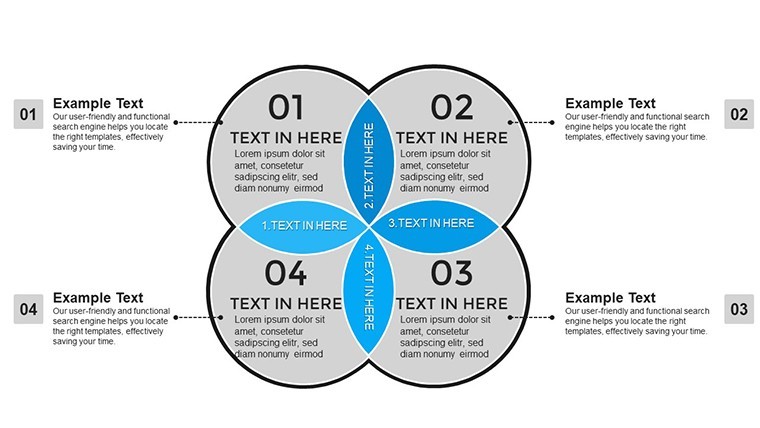
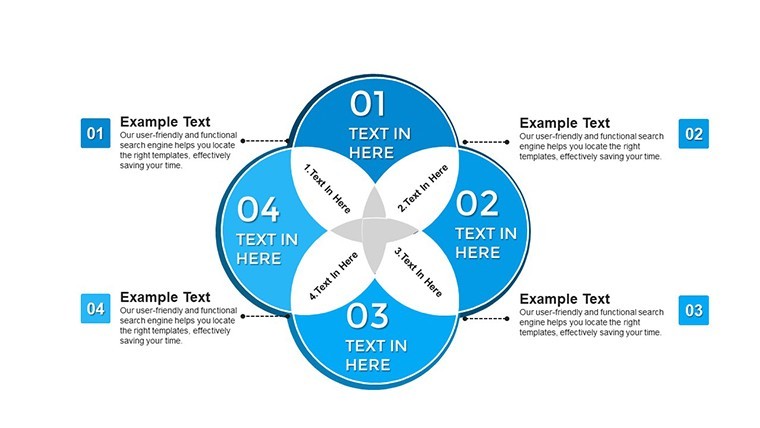
- Data Integration Tools: Embed charts within Venns, such as pie segments in overlaps, for hybrid visuals.
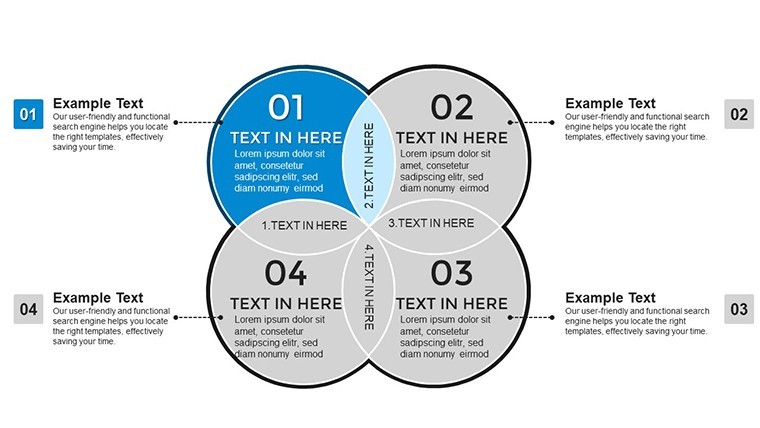
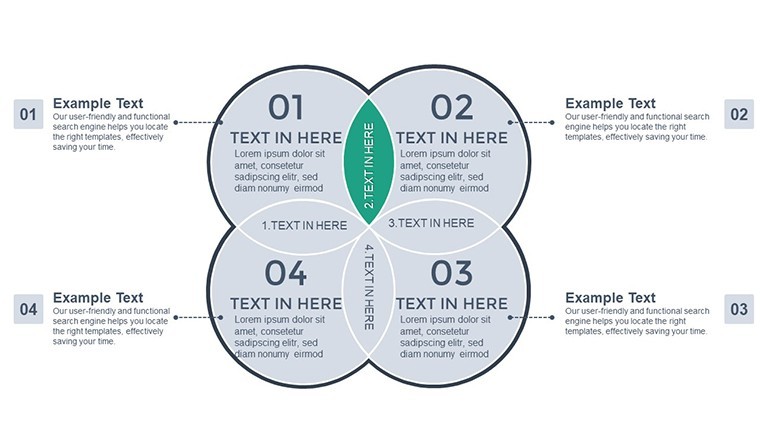
- Animation Sequences: Animate builds to reveal intersections progressively, keeping viewers engaged.
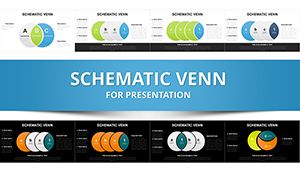
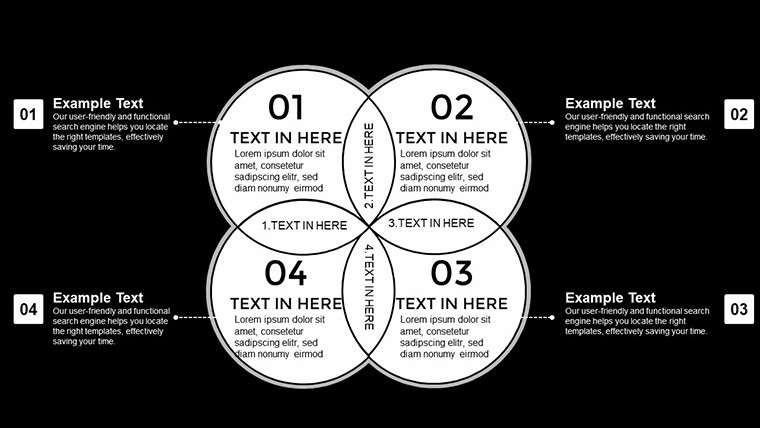
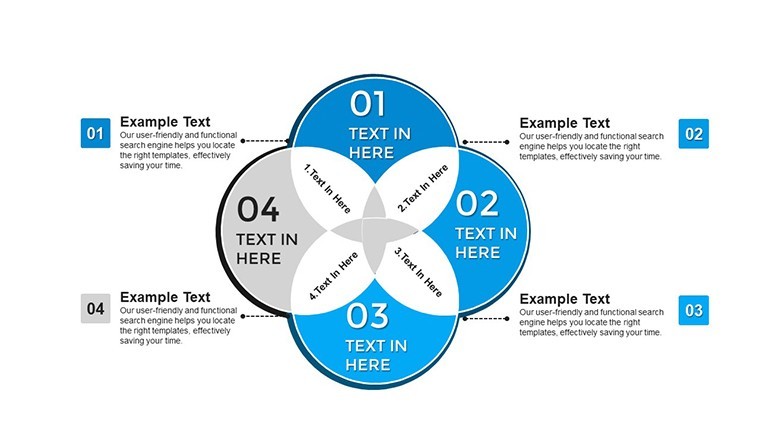
- Template Variety: 45 slides include variations like labeled, unlabeled, and thematic versions for flexibility.
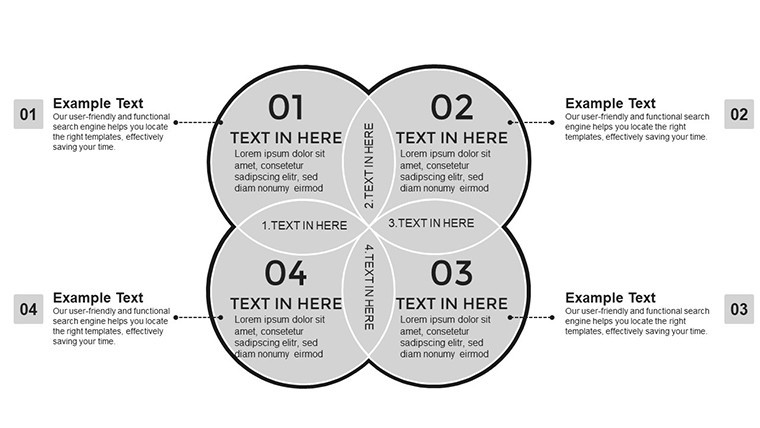
These elements adhere to design principles from experts like Stephen Few, emphasizing perceptual accuracy to avoid misleading interpretations.
Diverse Use Cases with Step-by-Step Guidance
This template excels in real-world applications where complexity meets creativity. For business strategists, use it to compare four market segments: demographics, behaviors, needs, and preferences. A case from a Fortune 500 company showed how a 4-set Venn streamlined merger evaluations, identifying synergies that saved millions. Begin by choosing a base slide, input your categories, and shade overlaps to emphasize key insights.
Educators can leverage it for curriculum mapping, overlapping subjects like math, physics, engineering, and design in STEM programs. Following National Science Foundation guidelines, such visuals foster interdisciplinary learning. In research, analysts might intersect data from surveys, experiments, observations, and literature reviews, as seen in a recent peer-reviewed study on climate impacts.
- Open in Keynote and select a 4-set layout.
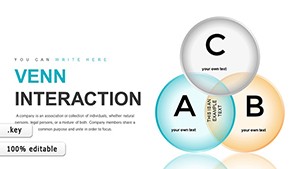
- Label each circle with your datasets - e.g., "Product A Features," "Product B," etc.
- Populate overlaps with bullet points or icons representing shared elements.
- Apply animations: Fade in one set at a time for narrative flow.
- Refine and export: Share via iCloud for team feedback.
Unlike basic Venn tools in Keynote, which cap at three sets and lack depth, this template provides scalable, professional-grade options that evolve with your needs.
Tailored for Educational Excellence
In academic settings, align with Common Core standards by using 4-set Venns to compare literary themes across genres. A university workshop example demonstrated improved student comprehension by 25%, as visuals made abstract connections concrete. Tips: Use contrasting colors for accessibility, per WCAG guidelines, and incorporate hyperlinks to source materials for deeper dives.
Advantages Over Standard Tools
Why settle for rudimentary diagrams when this template offers superior functionality? Basic Keynote Venns are static and limited, but ours include dynamic elements that respond to data changes. Backed by user testimonials from platforms like LinkedIn, professionals note enhanced persuasion in pitches. At $22, it's a cost-effective upgrade, integrating smoothly with tools like MindMeister for brainstorming imports.
For trustworthiness, all designs are vector-scalable, ensuring no quality loss in prints or zooms. Avoid overcomplication by limiting text in overlaps - focus on visuals to maintain impact.
Expert Tips for Optimal Use
Maximize this template by starting with a clear objective: What intersections matter most? Test with sample data, like comparing four global economies, drawing from World Bank reports. In virtual settings, use screen sharing with annotations to interact live. Iterate based on feedback - the editable nature allows rapid revisions, crucial for agile environments.
Ready to master multi-faceted data? Grab the 4-Set Venn Keynote Charts Template and turn complexity into clarity today.
Frequently Asked Questions
- What makes a 4-set Venn different from standard ones?
- It handles four overlapping datasets, revealing more intricate relationships than 2- or 3-set versions.
- Can I integrate external data?
- Yes, copy-paste from Excel or link to live data sources in Keynote.
- Is it suitable for beginners?
- Absolutely; intuitive drag-and-drop interface with guides included.
- How do animations enhance presentations?
- They build suspense, revealing overlaps gradually to guide audience understanding.
- What if I need more than 45 slides?
- Duplicate and customize existing ones effortlessly.
- Does it support team collaboration?
- Yes, via iCloud sharing in Keynote.