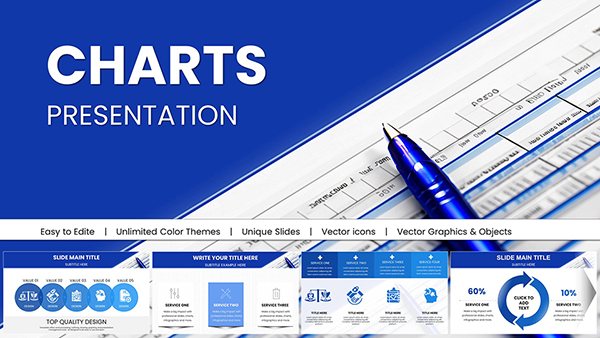
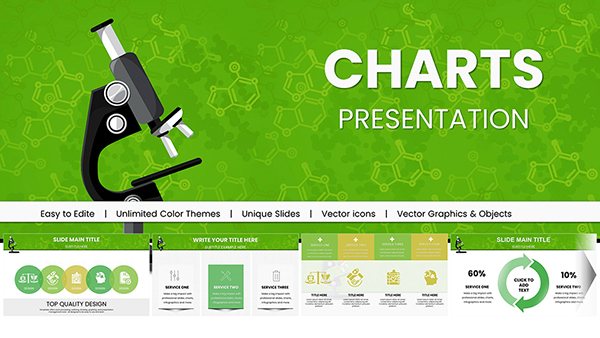
Delve into our premium Keynote chart templates, where data meets design in perfect harmony. Ideal for data enthusiasts, financial experts, and strategists, these templates turn raw numbers into narrative gold through sophisticated visualizations.
Featuring everything from interactive bar graphs to layered scatter plots, they simplify trend analysis and forecasting. With built-in color gradients and legend automations, your charts adapt to themes while maintaining analytical integrity.
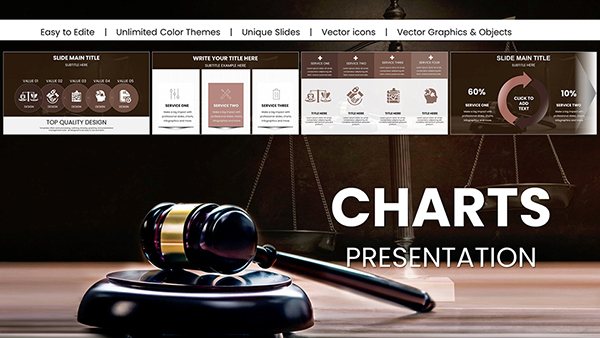
Apple Keynote`s native support means drag-and-drop edits for formulas and datasets, saving precious prep time. Whether quarterly earnings or research findings, these tools ensure your insights shine.
Scan our vision charts category for the ideal match and elevate your data storytelling immediately.
International Flights Keynote Charts Template: Master Aviation Analytics
ID: #KC00974
$20.00
(629)
Airplane Flights Keynote Charts Template: Navigate Global Data Skies
ID: #KC00972
$18.00
(605)
Business Correspondence Keynote Charts Template
ID: #KC00957
$20.00
(466)
Professional Business Report Keynote Charts
ID: #KC00938
$25.00
(532)
Sustainable Development Keynote Charts: Empower Your Eco-Presentations
ID: #KC00937
$25.00
(583)
Graph Keynote Charts: Where Data Meets Design Brilliance
ID: #KC00934
$24.00
(495)
Orchestrate Efficiency: The BPM Keynote Charts Revolution
ID: #KC00929
$24.00
(936)
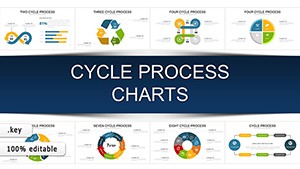
Cycle Process Keynote Charts - Instant Download | ImagineLayout
ID: #KC00922
$20.00
Why Vision Charts Transform Keynote Presentations
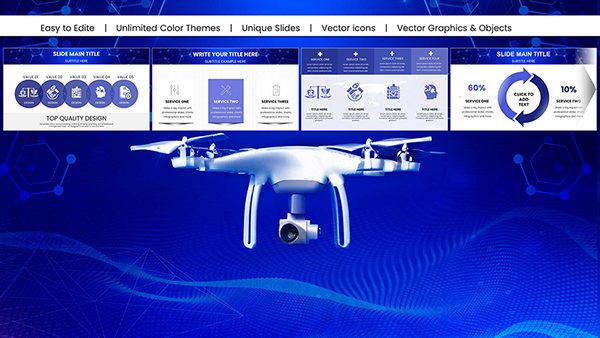
Charts aren`t just graphics; they`re storytellers. Our templates outshine Apple`s defaults with advanced styling - think 3D rotations and conditional formatting that respond to data shifts.
Analysts in finance use waterfall charts to dissect variances, revealing profit drivers at a glance. Researchers employ heat maps for correlation studies, uncovering patterns in dense datasets.
Data-Driven Design: Formulas link to external sheets for live updates.
Aesthetic Flexibility: Mix-and-match chart styles per slide.
Audience Adaptation: Simplified views for executives, detailed for teams.
Key Use Cases in Action
Sales directors integrate line charts with sales funnels, projecting growth trajectories that motivate teams. In academia, bubble charts visualize survey results, weighting responses by demographic for nuanced insights.
Superior to basic inserts, our templates include annotation tools for highlighting anomalies, enhancing interpretive power.
Tips for Charting with Confidence
Select chart types based on data nature - linear for trends, radial for proportions. Calibrate axes for accuracy, and use tooltips for deeper dives during presentations.
Source credible data and cite transparently.
Test color blindness accessibility with preview modes.
Pair charts with explanatory narratives for context.
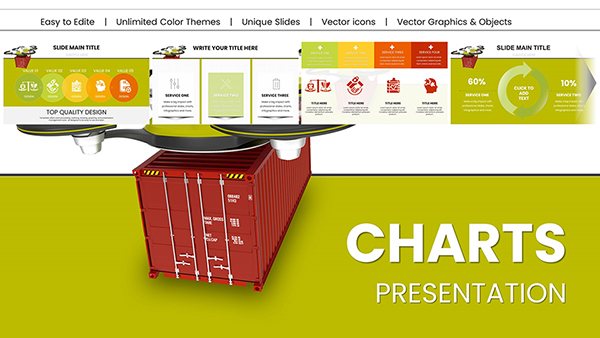
Visual data can increase comprehension by 89%, making these templates invaluable assets.
Begin Visualizing Today
Choose a chart template from our selection and input your data. Watch your presentations gain the edge they deserve - download now.
Frequently Asked Questions
What chart types are available?Bar, line, pie, area, and specialized variants like radar.
Can I import Excel data?Direct copy-paste with formula preservation.
Are charts responsive?Yes, they scale fluidly across devices.
How to animate data points?Apply build effects via the animate tab.