Tables Keynote Charts
These Keynote templates deliver ready-to-edit tables and charts for the moments when data must drive the story. A finance director finalizing the annual budget report for the executive committee can open the file and focus on the numbers instead of rebuilding column widths from scratch.
Use them for quarterly OKR updates in consulting firms or process flow presentations in operations meetings. The structure is already solved so the thinking stays on the argument.
Charts and tables resize automatically when you paste fresh data. Grab the matching template and start editing.
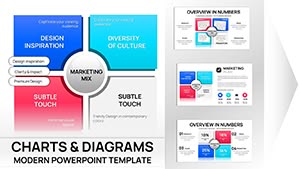 (11)
(11) Marketing Mix Keynote Charts Template - Fully Editable | Instant Download | ImagineLayoutID: #KC01090$15.00
 (13)
(13) Sales Infographic Keynote Charts Template - 56 Fully Editable Slides | ImagineLayoutID: #KC01085$14.00
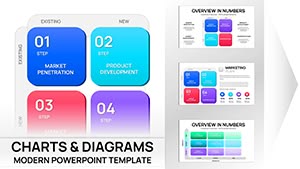 (14)
Ansoff Matrix Chart Keynote - Editable PPTX | ImagineLayoutID: #KC01082$20.00
(14)
Ansoff Matrix Chart Keynote - Editable PPTX | ImagineLayoutID: #KC01082$20.00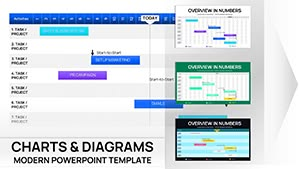 (10)
Monthly Gantt Chart Template for Keynote | Fully Editable Tables | Instant DownloadID: #KC01081$10.00
(10)
Monthly Gantt Chart Template for Keynote | Fully Editable Tables | Instant DownloadID: #KC01081$10.00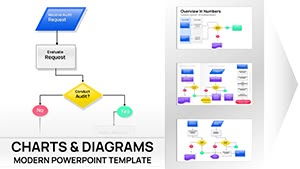 (13)
Business Process Flowchart Keynote Chart - Editable | ImagineLayoutID: #KC01075$14.00
(13)
Business Process Flowchart Keynote Chart - Editable | ImagineLayoutID: #KC01075$14.00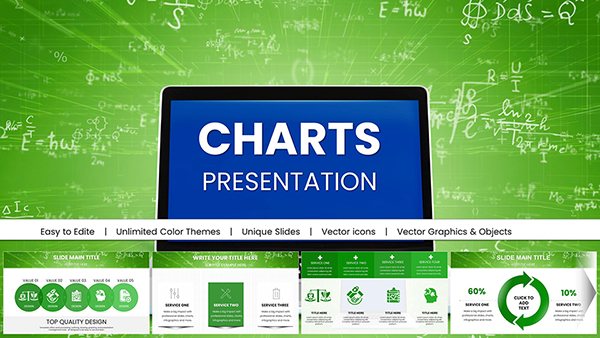 (14)
Online Math Lessons Charts Template for KeynoteID: #KC01060$18.00
(14)
Online Math Lessons Charts Template for KeynoteID: #KC01060$18.00 (8)
Architectural Keynote Charts Template - Fully Editable | Instant DownloadID: #KC01056$20.00
(8)
Architectural Keynote Charts Template - Fully Editable | Instant DownloadID: #KC01056$20.00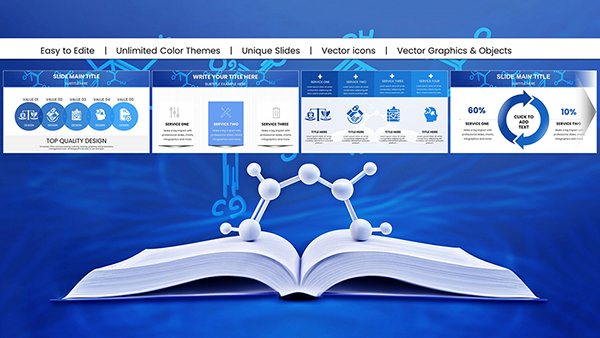 (11)
Chemistry Keynote Charts Template for ProsID: #KC01048$22.00
(11)
Chemistry Keynote Charts Template for ProsID: #KC01048$22.00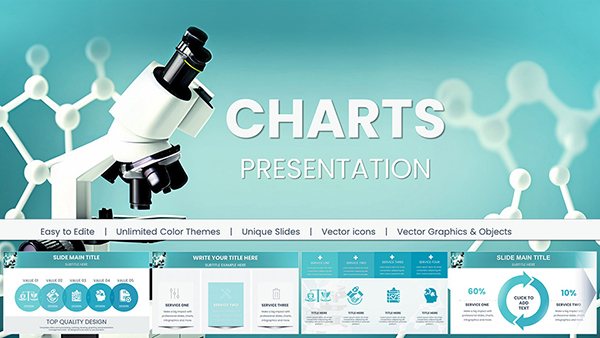 (11)
Keynote Charts Template for Chemical and Biochemical EngineeringID: #KC01041$18.00
(11)
Keynote Charts Template for Chemical and Biochemical EngineeringID: #KC01041$18.00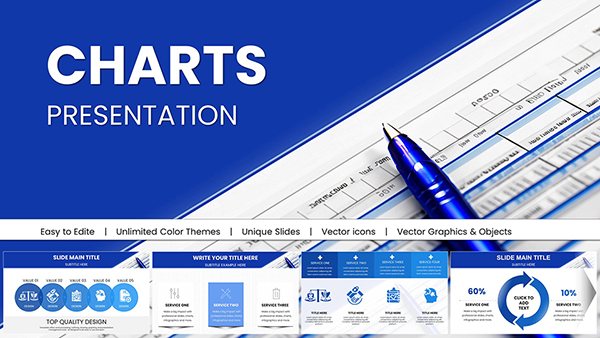 (16)
Editable Financial Charts Keynote Template: Transform Data into Impactful StoriesID: #KC01036$25.00
(16)
Editable Financial Charts Keynote Template: Transform Data into Impactful StoriesID: #KC01036$25.00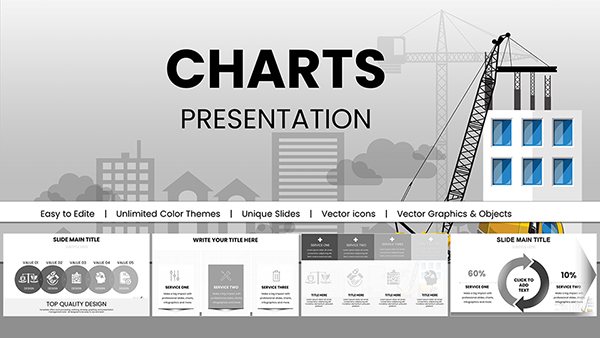 (1066)
 Construction Companies Keynote Charts Template: Build Visions with Data-Driven ClarityID: #KC00984$20.00
 (1026)
Education-Focused Keynote Charts Pack: Spark Learning with VisualsID: #KC00968$20.00
(1026)
Education-Focused Keynote Charts Pack: Spark Learning with VisualsID: #KC00968$20.00 (944)
Hydropower Energy Keynote Charts Template for PresentationID: #KC00965$20.00
(944)
Hydropower Energy Keynote Charts Template for PresentationID: #KC00965$20.00 (445)
Business Analysis Solution Keynote ChartsID: #KC00941$25.00
(445)
Business Analysis Solution Keynote ChartsID: #KC00941$25.00 (830)
Best Choice Keynote Charts TemplateID: #KC00939$25.00
(830)
Best Choice Keynote Charts TemplateID: #KC00939$25.00 (532)
Sustainable Development Keynote Charts: Empower Your Eco-PresentationsID: #KC00937$25.00
(532)
Sustainable Development Keynote Charts: Empower Your Eco-PresentationsID: #KC00937$25.00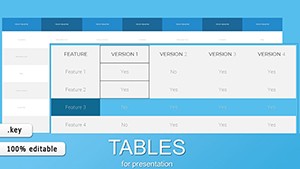 (243)
Business Report Keynote Charts Template: Craft Professional InsightsID: #KC00887$15.00
(243)
Business Report Keynote Charts Template: Craft Professional InsightsID: #KC00887$15.00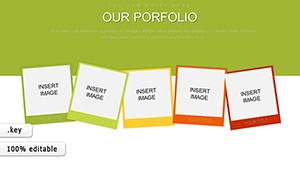 (32)
(32) Our Portfolio Keynote ChartsID: #KC00886$20.00
 (1114)
Inbound Marketing Methodology Keynote Charts: Strategize for SuccessID: #KC00882$15.00
(1114)
Inbound Marketing Methodology Keynote Charts: Strategize for SuccessID: #KC00882$15.00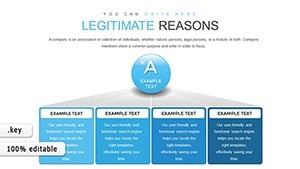 (981)
Causality Principle Keynote Charts - 42 Editable SlidesID: #KC00872$18.00
(981)
Causality Principle Keynote Charts - 42 Editable SlidesID: #KC00872$18.00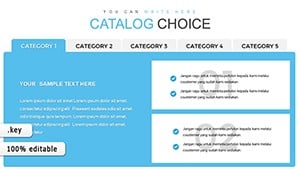 (1080)
Catalog Design Keynote Charts Template - 39 SlidesID: #KC00865$15.00
(1080)
Catalog Design Keynote Charts Template - 39 SlidesID: #KC00865$15.00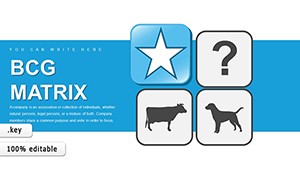 (350)
Revolutionize Corporate Strategy with BCG Matrix Keynote ChartsID: #KC00807$18.00
(350)
Revolutionize Corporate Strategy with BCG Matrix Keynote ChartsID: #KC00807$18.00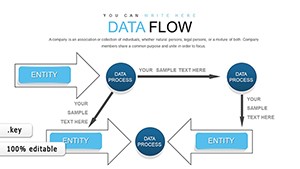 (97)
Create Impressive Presentations with Our Data Flow Keynote TemplatesID: #KC00785$20.00
(97)
Create Impressive Presentations with Our Data Flow Keynote TemplatesID: #KC00785$20.00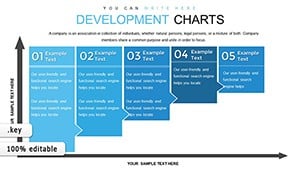 (1070)
Development Keynote Charts Template: Empower Your Presentations with Dynamic Growth VisualsID: #KC00781$17.00
(1070)
Development Keynote Charts Template: Empower Your Presentations with Dynamic Growth VisualsID: #KC00781$17.00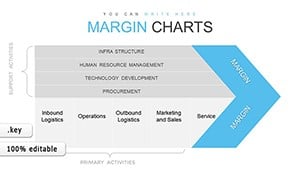 (365)
Margin Keynote Charts: Unlock Profitability InsightsID: #KC00770$22.00
(365)
Margin Keynote Charts: Unlock Profitability InsightsID: #KC00770$22.00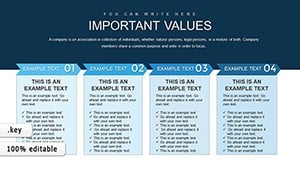 (604)
Essential Elements Keynote Charts Template: Visual Mastery UnleashedID: #KC00758$15.00
(604)
Essential Elements Keynote Charts Template: Visual Mastery UnleashedID: #KC00758$15.00 (644)
Branching Service Tables Keynote Charts TemplateID: #KC00757$20.00
(644)
Branching Service Tables Keynote Charts TemplateID: #KC00757$20.00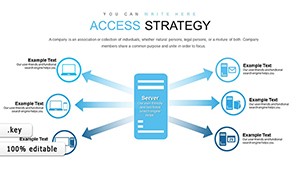 (905)
Access Strategy Keynote Charts: Elevate Your Analytical PresentationsID: #KC00751$22.00
(905)
Access Strategy Keynote Charts: Elevate Your Analytical PresentationsID: #KC00751$22.00 (724)
Event Calendar Charts - Editable Keynote | ImagineLayoutID: #KC00737$14.00
(724)
Event Calendar Charts - Editable Keynote | ImagineLayoutID: #KC00737$14.00 (338)
Economic Integration Keynote Charts - Editable | ImagineLayoutID: #KC00714$20.00
(338)
Economic Integration Keynote Charts - Editable | ImagineLayoutID: #KC00714$20.00 (810)
Network Marketing Keynote Charts Template - Fully Editable | ImagineLayoutID: #KC00709$16.00
(810)
Network Marketing Keynote Charts Template - Fully Editable | ImagineLayoutID: #KC00709$16.00 (904)
Banking Keynote Charts Template - Editable | ImagineLayoutID: #KC00703$24.00
(904)
Banking Keynote Charts Template - Editable | ImagineLayoutID: #KC00703$24.00 (533)
Capability Analysis Keynote Charts - Editable | ImagineLayoutID: #KC00669$20.00
(533)
Capability Analysis Keynote Charts - Editable | ImagineLayoutID: #KC00669$20.00
How Table Charts Turn Raw Data Into Executive Arguments
Visitors arrive here with one core question: will these layouts make my data slide look intentional instead of assembled at the last minute? Every template begins with a defined hierarchy-headline claim at the top, supporting metrics in the table body, and clear action row at the bottom-so the eye moves exactly where the argument needs it.
What Changes When You Paste Excel Data Into a Pre-Built Table
The common hesitation is whether imported rows will break the design. These templates use Keynote table styles that adapt column widths on the fly. Paste your sheet and the structure holds; no manual dragging or font resets required.
Four Moments These Table Charts Delivered Results
A product manager at a SaaS company had 48 hours to prepare the Q2 metrics review for the CEO. Normally that meant building twelve comparison tables from scratch. With the monthly Gantt chart template the team pasted the data in ten minutes, adjusted two colors, and the slide passed the first read-through without revisions.
The strategy consultant running a growth workshop for a retail client needed an Ansoff matrix that would not look like a textbook example. The pre-set quadrants and color coding let her swap in the client's actual revenue figures while the visual stayed balanced. The client team referenced the slide three times during discussion.
A construction project lead preparing the monthly status update for investors faced conflicting data from three subcontractors. The business process flowchart template turned the messy timeline into one clean table with color-coded delays. The investors focused on solutions instead of questioning the format.
An education program director rolling out new curriculum benchmarks to 200 teachers needed side-by-side comparison slides. The education-focused pack let her drop in test scores and graduation rates; the tables remained legible when projected in a large auditorium.
The Formatting Decisions You No Longer Have to Make
Building tables manually forces you to choose font stack, set exact column percentages for 16:9 aspect ratio, define alternating row shading, and ensure the palette matches the rest of the deck. Each decision costs five minutes and risks inconsistency when the stakeholder asks for one more column. These templates remove those steps so your focus stays on the insight the data supports.
Practical Edits That Work Best in These Templates
Regular users edit the slide master once to set company colors; the change then propagates to every table style without touching individual slides. Another technique: use the format panel's table inspector to add or delete rows after pasting data-the auto-fit keeps text legible at 18 pt minimum. Technically Keynote handles linked data poorly if you update the source file later, so always paste values instead of linking to avoid broken references on export.
Why These Table Charts Fit Corporate Workflows Differently
These layouts prioritize editing speed and consistency across slides. The absence of extra background images keeps file size small even with twenty tables. The collection is built for corporate storytelling where the structure carries part of the argument.
If your story needs interconnected data metaphors rather than strict grids, check out our puzzles Keynote charts templates for jigsaw-style breakdowns. When the deliverable includes physical leave-behinds, the architecture and real estate business card templates provide matching visual language. Many teams combine both for complete pitch packages.
If the next review on your calendar needs clean data tables, one of these layouts will cut your prep time in half.
Frequently Asked Questions
What Keynote version is required to open these table chart templates?
They are built for Apple Keynote 12 and above. In practice if you are on version 11 the tables still open but some theme-linked styles may need manual reapplication from the format sidebar; updating takes two minutes and restores full master synchronization so every table updates together when you change the slide master.
Can I share the downloaded files with my team or use them in client deliverables?
Yes the license covers unlimited internal team use and client presentations. Each file is yours to edit, duplicate, and distribute within your organization or to external stakeholders as part of a paid engagement; the only restriction is reselling the template itself as a standalone product.
How do I replace the placeholder data without losing the table formatting?
Select the entire table, delete the placeholder numbers, then paste your Excel range directly into the first cell. Keynote's table style automatically reflows column widths and row heights while preserving the alternating shading and border weights you chose in the slide master.
Do these templates export cleanly to PDF or PowerPoint?
Export to PDF retains exact table alignment and fonts because the file embeds the necessary typefaces. When exporting to PowerPoint the tables become native PowerPoint tables that remain fully editable; check font substitution only if your corporate font is missing on the receiving machine.
Are there any restrictions on commercial use or modifications?
You may modify every element including colors, text, and table dimensions for any commercial project. The only limit is that you cannot redistribute the original .key file as a template product on another marketplace.