Puzzles Keynote Charts
This collection focuses on puzzle diagram Keynote templates built for teams that need to explain how separate parts connect into a single outcome. These layouts are used when the relationship between elements matters more than the elements themselves - strategy breakdowns, process dependencies, or multi-step systems.
In a typical scenario, a product manager walking into a roadmap review needs to show how features interlock across releases. A simple list won`t do it. A puzzle layout forces structure: each piece holds meaning, and the full picture only makes sense when everything aligns. That`s exactly why this visual works where others don`t.
Browse the layouts and pick the structure that matches how your pieces actually connect - not just how they look on a slide.
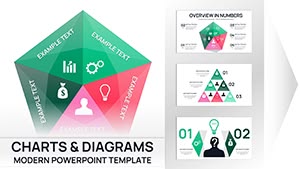 (14)
(14) Conceptual Plan Keynote Charts - Fully Editable | ImagineLayoutID: #KC01111$18.00
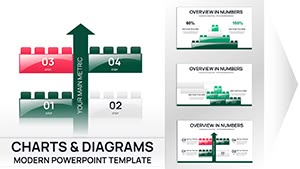 (9)
Keynote Building Blocks Chart - Instant Download | ImagineLayoutID: #KC01107$18.00
(9)
Keynote Building Blocks Chart - Instant Download | ImagineLayoutID: #KC01107$18.00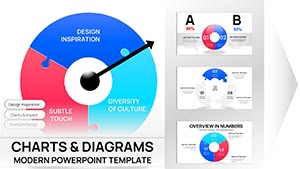 (14)
Process Charts Keynote Template - Fully Editable Puzzle Pie 32 Slides | Instant DownloadID: #KC01074$15.00
(14)
Process Charts Keynote Template - Fully Editable Puzzle Pie 32 Slides | Instant DownloadID: #KC01074$15.00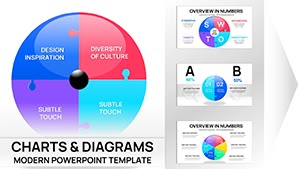 (12)
Fully Editable Puzzle Pie Charts Keynote Template - Instant DownloadID: #KC01073$20.00
(12)
Fully Editable Puzzle Pie Charts Keynote Template - Instant DownloadID: #KC01073$20.00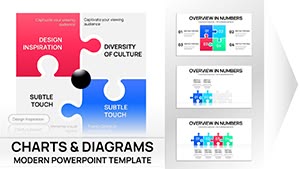 (13)
(13) Business Puzzle Pieces Keynote Charts Template | Fully Editable | Instant DownloadID: #KC01068$18.00
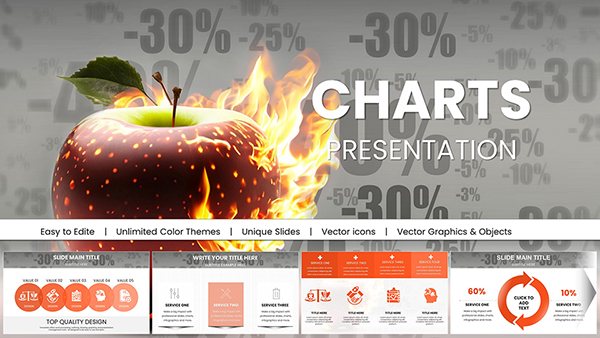 (12)
Keynote Discounts Charts Template for SalesID: #KC01043$20.00
(12)
Keynote Discounts Charts Template for SalesID: #KC01043$20.00 (859)
Gear Financial Risks Keynote Charts: Transform Data into Actionable InsightsID: #KC00858$16.00
(859)
Gear Financial Risks Keynote Charts: Transform Data into Actionable InsightsID: #KC00858$16.00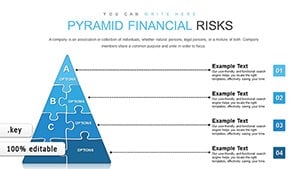 (66)
(66) Pyramid Financial Risks Charts: Master Risk Visualization in KeynoteID: #KC00857$16.00
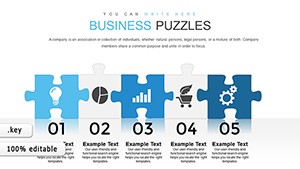 (223)
Business Puzzles Keynote Charts TemplateID: #KC00851$18.00
(223)
Business Puzzles Keynote Charts TemplateID: #KC00851$18.00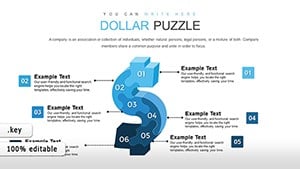 (965)
Dollars Puzzles Keynote Charts: Decode Economic Influences with Visual MasteryID: #KC00837$13.00
(965)
Dollars Puzzles Keynote Charts: Decode Economic Influences with Visual MasteryID: #KC00837$13.00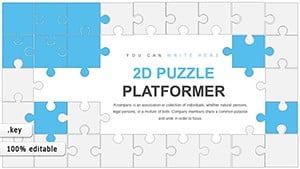 (415)
2D Puzzles Keynote Charts Template: Engage with Interactive VisualsID: #KC00817$18.00
(415)
2D Puzzles Keynote Charts Template: Engage with Interactive VisualsID: #KC00817$18.00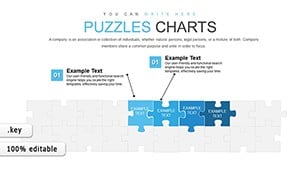 (748)
(748) Puzzles for Analytics Interviews: Hexagon Keynote Charts UnleashedID: #KC00812$20.00
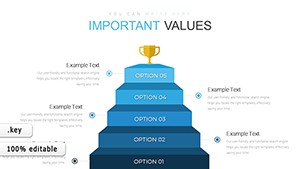 (804)
Affiliate Marketing Charts - Editable Keynote | ImagineLayoutID: #KC00736$22.00
(804)
Affiliate Marketing Charts - Editable Keynote | ImagineLayoutID: #KC00736$22.00 (730)
SEO Infographic Keynote Charts - Editable | ImagineLayoutID: #KC00735$15.00
(730)
SEO Infographic Keynote Charts - Editable | ImagineLayoutID: #KC00735$15.00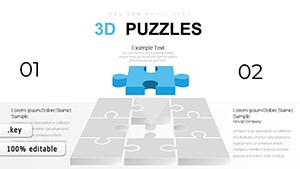 (148)
3D Puzzles Keynote Charts - Fully Editable | ImagineLayoutID: #KC00734$22.00
(148)
3D Puzzles Keynote Charts - Fully Editable | ImagineLayoutID: #KC00734$22.00 (601)
Accumulation Keynote Charts - Capital Growth | Editable KeynoteID: #KC00721$15.00
(601)
Accumulation Keynote Charts - Capital Growth | Editable KeynoteID: #KC00721$15.00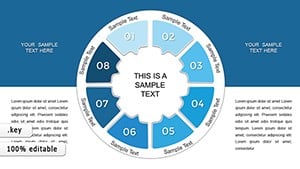 (898)
Circle Thumbs Puzzle Keynote Charts Template - Editable Keynote | ImagineLayoutID: #KC00704$15.00
(898)
Circle Thumbs Puzzle Keynote Charts Template - Editable Keynote | ImagineLayoutID: #KC00704$15.00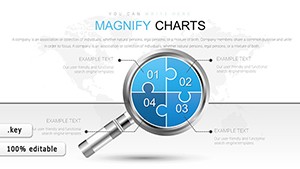 (122)
Magnifying Glass Analysis Keynote Charts - Editable KeynoteID: #KC00688$20.00
(122)
Magnifying Glass Analysis Keynote Charts - Editable KeynoteID: #KC00688$20.00 (407)
4 Sector Gears Keynote Charts - Editable | ImagineLayoutID: #KC00666$18.00
(407)
4 Sector Gears Keynote Charts - Editable | ImagineLayoutID: #KC00666$18.00 (323)
Rhombus Puzzle Keynote Charts - Editable | ImagineLayoutID: #KC00665$18.00
(323)
Rhombus Puzzle Keynote Charts - Editable | ImagineLayoutID: #KC00665$18.00 (802)
Puzzles Compiled Keynote Charts - Editable Keynote | ImagineLayoutID: #KC00664$18.00
(802)
Puzzles Compiled Keynote Charts - Editable Keynote | ImagineLayoutID: #KC00664$18.00 (697)
Gadgets and Software Keynote Charts TemplateID: #KC00599$25.00
(697)
Gadgets and Software Keynote Charts TemplateID: #KC00599$25.00 (131)
Maslow Needs Pyramid Keynote Charts TemplateID: #KC00598$23.00
(131)
Maslow Needs Pyramid Keynote Charts TemplateID: #KC00598$23.00 (1175)
Ideas Work Principles Keynote Charts TemplateID: #KC00585$18.00
(1175)
Ideas Work Principles Keynote Charts TemplateID: #KC00585$18.00 (337)
Goals and Opportunities Keynote Charts: Empower Your JourneyID: #KC00564$17.00
(337)
Goals and Opportunities Keynote Charts: Empower Your JourneyID: #KC00564$17.00 (1015)
Sphere of Influence Keynote Charts: Visualize Networks and ImpactsID: #KC00562$20.00
(1015)
Sphere of Influence Keynote Charts: Visualize Networks and ImpactsID: #KC00562$20.00 (237)
Quality Control Keynote Charts Template: Professional Visuals for Manufacturing ExcellenceID: #KC00560$25.00
(237)
Quality Control Keynote Charts Template: Professional Visuals for Manufacturing ExcellenceID: #KC00560$25.00 (839)
Growth Prospects Keynote Charts Template: Visualize Business Expansion with EaseID: #KC00559$23.00
(839)
Growth Prospects Keynote Charts Template: Visualize Business Expansion with EaseID: #KC00559$23.00 (437)
Business Ideas Work Keynote Charts: Puzzle Your Path to ProfitID: #KC00546$18.00
(437)
Business Ideas Work Keynote Charts: Puzzle Your Path to ProfitID: #KC00546$18.00 (207)
Infographic Design Keynote Charts: Cycles and Puzzles UnleashedID: #KC00513$17.00
(207)
Infographic Design Keynote Charts: Cycles and Puzzles UnleashedID: #KC00513$17.00 (985)
Animated Info Charts: Keynote Pie & Puzzle TemplatesID: #KC00445$18.00
(985)
Animated Info Charts: Keynote Pie & Puzzle TemplatesID: #KC00445$18.00 (1091)
Puzzle Charts for Keynote: Decode Complex DataID: #KC00444$18.00
(1091)
Puzzle Charts for Keynote: Decode Complex DataID: #KC00444$18.00 (1166)
Decisive Definition Keynote Charts: Unlock Impactful InfographicsID: #KC00417$20.00
(1166)
Decisive Definition Keynote Charts: Unlock Impactful InfographicsID: #KC00417$20.00
Why puzzle layouts work when the relationship is the message
A puzzle diagram is not about decoration. It`s about dependency. Each piece implies that something is missing without the others, which is exactly the point in many business conversations. When you`re explaining a system - product components, strategic pillars, operational steps - the audience needs to see both the parts and the fact that they rely on each other.
I`ve used similar layouts in quarterly product reviews, and the difference is immediate. A bullet list invites people to read items separately. A puzzle forces them to understand the whole. Honestly, that shift alone changes how decisions get made.
And yes, it`s slightly rigid. That`s the trade-off. But in practice, that constraint is useful - it prevents vague thinking.
If your slide needs to show "these things only work together," this format holds that idea visually. That`s it.
Explore the layouts above and start with the one that matches your logic structure.
Where puzzle diagrams actually show up in real decks
A strategy consultant preparing a client workshop often needs to present a framework with interdependent pillars - say, operations, marketing, and product alignment. The puzzle format makes it clear that removing one piece weakens the whole. The conversation shifts from "which is more important" to "how do these connect."
In internal IT planning, I`ve seen teams map system architecture using puzzle shapes. Not as a technical diagram, but as a communication layer for non-technical stakeholders. Each block becomes a system component, but the emphasis stays on integration. It works well. Slightly surprising at first, but effective.
A marketing lead presenting campaign structure to executives might use a puzzle layout to show channels working together - paid, organic, partnerships. You know the situation - leadership wants clarity fast, not detail overload. This format simplifies without oversimplifying.
Even HR teams use these in training decks to explain competency models. Each skill area becomes a piece. The visual logic reinforces that no single skill stands alone.
What this visual does that flowcharts and lists don`t
Flowcharts show sequence. Lists show hierarchy or grouping. Puzzle diagrams show interdependence. That`s the distinction.
If your message is about order - use a timeline or flow. If it`s about comparison - use a table. But when your message is "these elements only make sense together," the puzzle format becomes the right tool.
There`s also a subtle psychological effect. The audience instinctively tries to "complete" the picture. It draws attention to missing pieces, which is useful in gap analysis discussions.
But it breaks down when overused. Too many pieces, and the slide turns into noise. Four to six elements is usually the limit. After that, readability drops quickly.
Technical detail that matters when editing in Keynote
Most puzzle diagrams in Keynote are built from grouped vector shapes, not smart objects. That`s good - it means you can resize or recolor without distortion. But it also means alignment can shift if you start moving pieces individually.
From experience, the safest approach is to duplicate a piece and adjust within that structure rather than dragging elements freely. Keeps spacing consistent. Also, check how shadows and gradients behave when exporting to PDF - sometimes they flatten slightly differently.
The first time you open the master slides, it looks like a lot. But once you see the color system, it`s straightforward.
When to choose puzzle diagrams over other categories
If your content is about connection and dependency, this category makes sense. If not, it probably doesn`t.
For step-by-step processes, you`re better off in Keynote diagram templates where flow and sequence are clearer. Puzzle layouts don`t handle time well.
If your focus is data comparison, use Keynote chart templates. Tables and charts handle numbers better than puzzle shapes ever will.
And if you need geographic context or mapping, switch to Keynote map templates. Puzzle diagrams don`t carry spatial meaning.
Basically: use puzzles when the structure itself is the argument.
Why these templates hold up in real use
What stands out here is restraint. The layouts aren`t overloaded with decorative elements, which makes them easier to adapt inside a real corporate deck. The hierarchy is clear - headline, supporting labels, visual core - and that structure stays consistent across slides.
I liked how the spacing holds even when you replace placeholder text with longer labels. That`s usually where templates break. Here, it mostly doesn`t.
There are limits, of course. Not ideal if you need dynamic data or frequent restructuring. But for fixed frameworks or concept explanations, they work well. No extra setup. You drop in your data, adjust colors, done.
Also works for internal ops reviews, not just client decks.
FAQ
Can I add more puzzle pieces to the slide?
Usually yes, but it depends on how the original layout is built. Most templates use grouped shapes, so you can duplicate an existing piece and adjust its size or label. The tricky part is maintaining spacing and alignment. From experience, it`s better to duplicate and scale proportionally rather than drawing a new piece from scratch, otherwise the visual balance starts to drift.
Will these Keynote templates work in PowerPoint?
The short answer is no - they`re designed for Apple Keynote format. You can export to PowerPoint, but shapes, fonts, and spacing may shift slightly. In most cases, the structure stays intact, but you`ll likely need to adjust alignment and typography after conversion. If you`re working cross-platform regularly, it`s better to choose a native PowerPoint version instead.
How do I change colors without breaking the design?
Honestly, start with the slide master. That`s where the color system is defined. Most templates are built with a consistent palette, so changing colors at the master level updates all slides at once. If you edit shapes individually, you`ll lose that consistency fast. It`s a small step, but it saves time later when you scale the deck.
Are these suitable for complex technical diagrams?
Not really. Puzzle diagrams simplify relationships rather than detail them. If you need precise system architecture or technical flows, a dedicated diagram or flowchart works better. These are more about communicating the idea of connection than documenting every detail. Works fine for high-level explanations though.
Can I use these templates for commercial presentations?
It`s the same license most marketplaces use - one buyer, one project, commercial use included. You can present to clients, include them in paid work, no issues. Just don`t redistribute the templates themselves. That`s basically it.