Process Keynote Charts
Relationship Keynote Chart Templates are expertly crafted visual tools designed for Apple Keynote to illustrate connections, hierarchies, and interactions in your presentations. Perfect for business professionals, educators, and project managers, these editable Keynote slides simplify complex relationships into clear, engaging visuals. Download now to create stunning presentations that captivate your audience!
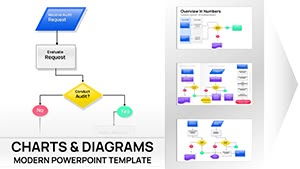 (13)
(13) Business Process Flowchart Keynote Chart - Editable | ImagineLayoutID: #KC01075$14.00
 (14)
(14) Online Math Lessons Charts Template for KeynoteID: #KC01060$18.00
 (13)
Plumbing Charts Keynote Template - Fully Editable 43 Slides | Instant DownloadID: #KC01059$18.00
(13)
Plumbing Charts Keynote Template - Fully Editable 43 Slides | Instant DownloadID: #KC01059$18.00 (9)
Modern Real Estate Charts Keynote Template: Plot Your Path to Profitable PitchesID: #KC01057$25.00
(9)
Modern Real Estate Charts Keynote Template: Plot Your Path to Profitable PitchesID: #KC01057$25.00 (15)
Marketing Charts Template for Keynote: Editable and ProfessionalID: #KC01038$20.00
(15)
Marketing Charts Template for Keynote: Editable and ProfessionalID: #KC01038$20.00 (16)
Editable Financial Charts Keynote Template: Transform Data into Impactful StoriesID: #KC01036$25.00
(16)
Editable Financial Charts Keynote Template: Transform Data into Impactful StoriesID: #KC01036$25.00 (12)
Dental Charts Keynote Template: Illuminate Oral Health InsightsID: #KC01034$22.00
(12)
Dental Charts Keynote Template: Illuminate Oral Health InsightsID: #KC01034$22.00 (16)
Customizable Legal Charts Keynote Template: Clarify Complex Cases with EaseID: #KC01033$25.00
(16)
Customizable Legal Charts Keynote Template: Clarify Complex Cases with EaseID: #KC01033$25.00 (12)
Professional Law Charts Keynote Presentation TemplateID: #KC01031$15.00
(12)
Professional Law Charts Keynote Presentation TemplateID: #KC01031$15.00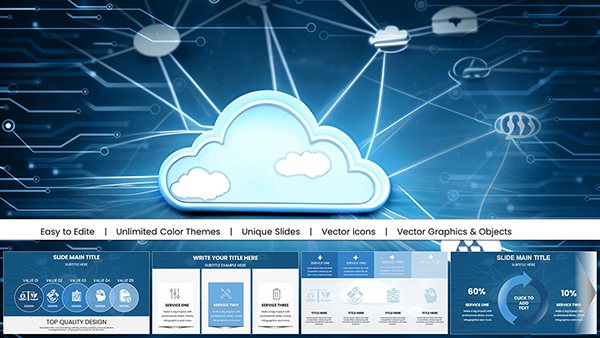 (409)
(409) Premium Secure Cloud Business Charts for Keynote PresentationsID: #KC01024$18.00
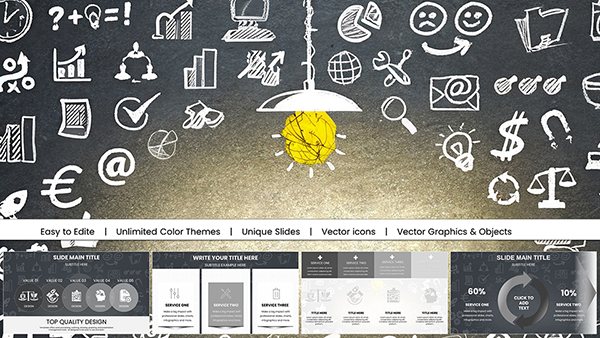 (902)
Innovative Marketing Idea Keynote Charts PresentationID: #KC01021$15.00
(902)
Innovative Marketing Idea Keynote Charts PresentationID: #KC01021$15.00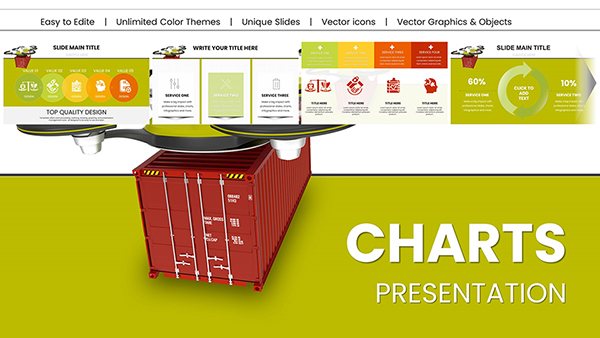 (584)
(584) Heavy Cargo Drone Delivery: Keynote Charts for Logistics InnovationID: #KC01014$20.00
 (292)
Drone Delivery Keynote Charts Template - Fully Editable | Instant DownloadID: #KC01013$18.00
(292)
Drone Delivery Keynote Charts Template - Fully Editable | Instant DownloadID: #KC01013$18.00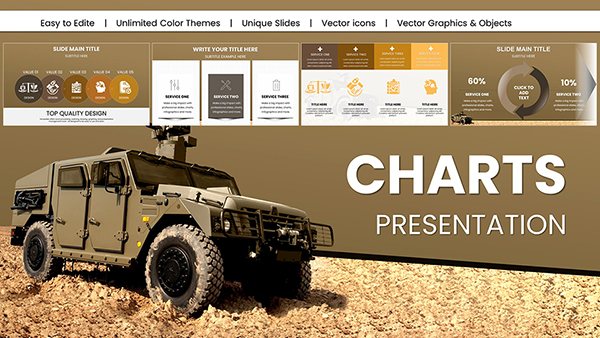 (326)
Military Vehicle Keynote Charts Presentation: Elevate Your Defense StrategiesID: #KC01008$20.00
(326)
Military Vehicle Keynote Charts Presentation: Elevate Your Defense StrategiesID: #KC01008$20.00 (131)
Key Access Control Keynote Template: Secure Presentations with Advanced VisualsID: #KC00983$18.00
(131)
Key Access Control Keynote Template: Secure Presentations with Advanced VisualsID: #KC00983$18.00 (466)
Professional Business Report Keynote ChartsID: #KC00938$25.00
(466)
Professional Business Report Keynote ChartsID: #KC00938$25.00 (221)
Professional Development Keynote Charts: Elevate Your Growth StrategiesID: #KC00936$20.00
(221)
Professional Development Keynote Charts: Elevate Your Growth StrategiesID: #KC00936$20.00 (1089)
Illuminate Trends: Mastering Marketing Research with Keynote ChartsID: #KC00928$24.00
(1089)
Illuminate Trends: Mastering Marketing Research with Keynote ChartsID: #KC00928$24.00 (551)
3D Cloud Storage Keynote Charts - Fully Editable | ImagineLayoutID: #KC00900$18.00
(551)
3D Cloud Storage Keynote Charts - Fully Editable | ImagineLayoutID: #KC00900$18.00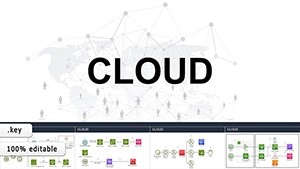 (1195)
Cloud Data Storage Keynote Charts: Scalable Visuals for ProsID: #KC00899$18.00
(1195)
Cloud Data Storage Keynote Charts: Scalable Visuals for ProsID: #KC00899$18.00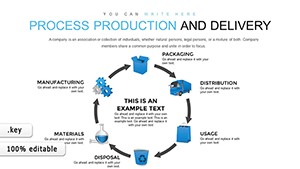 (1060)
Production and Delivery Process Keynote Charts TemplateID: #KC00854$18.00
(1060)
Production and Delivery Process Keynote Charts TemplateID: #KC00854$18.00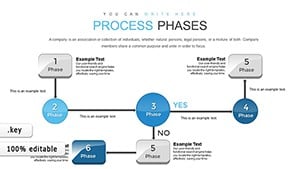 (945)
Optimize Workflows with Process Phases Keynote TemplateID: #KC00824$18.00
(945)
Optimize Workflows with Process Phases Keynote TemplateID: #KC00824$18.00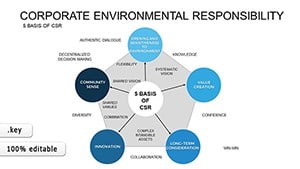 (983)
Corporate Social Responsibility Keynote Charts: Visualize Impact and Ethics EffortlesslyID: #KC00780$22.00
(983)
Corporate Social Responsibility Keynote Charts: Visualize Impact and Ethics EffortlesslyID: #KC00780$22.00 (80)
Keynote Process Charts - Fully Editable | ImagineLayoutID: #KC00716$22.00
(80)
Keynote Process Charts - Fully Editable | ImagineLayoutID: #KC00716$22.00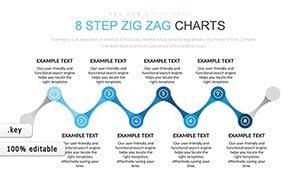 (204)
Keynote Zig Zag Process Charts - Fully Editable | ImagineLayoutID: #KC00684$15.00
(204)
Keynote Zig Zag Process Charts - Fully Editable | ImagineLayoutID: #KC00684$15.00 (383)
Chain Sequence Process Charts Keynote - Fully Editable | ImagineLayoutID: #KC00680$12.00
(383)
Chain Sequence Process Charts Keynote - Fully Editable | ImagineLayoutID: #KC00680$12.00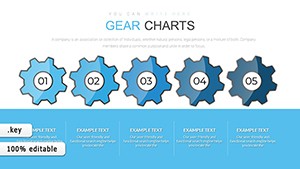 (638)
Top Gear System Keynote Charts - Fully Editable | ImagineLayoutID: #KC00655$20.00
(638)
Top Gear System Keynote Charts - Fully Editable | ImagineLayoutID: #KC00655$20.00 (1136)
Assessment of Technical Condition Keynote Charts: Precision in ProcessID: #KC00605$18.00
(1136)
Assessment of Technical Condition Keynote Charts: Precision in ProcessID: #KC00605$18.00 (434)
Investment Management Keynote Charts Template: Master Financial Narratives with PrecisionID: #KC00586$20.00
(434)
Investment Management Keynote Charts Template: Master Financial Narratives with PrecisionID: #KC00586$20.00 (742)
Creative Ideas Keynote Charts: Fuel Your InnovationID: #KC00573$24.00
(742)
Creative Ideas Keynote Charts: Fuel Your InnovationID: #KC00573$24.00 (382)
Master Class Seminar Training Keynote Charts Presentation TemplateID: #KC00555$15.00
(382)
Master Class Seminar Training Keynote Charts Presentation TemplateID: #KC00555$15.00 (1126)
Evolve with Ease: Business Process Management Keynote Charts in MotionID: #KC00550$17.00
(1126)
Evolve with Ease: Business Process Management Keynote Charts in MotionID: #KC00550$17.00 (163)
Process Timeline Keynote Charts: Chart Your Journey to EfficiencyID: #KC00545$13.00
(163)
Process Timeline Keynote Charts: Chart Your Journey to EfficiencyID: #KC00545$13.00
What Are Relationship Keynote Chart Templates?
Relationship Keynote Chart Templates are pre-designed slides for Apple Keynote, created to visualize relationships between entities such as teams, processes, or concepts. These templates are ideal for presenting complex data in a structured, visually appealing format, making them perfect for business presentations, academic lectures, or project planning. Whether you`re showcasing organizational hierarchies, workflows, or data comparisons, these charts help your audience grasp connections effortlessly.
Why Choose Relationship Keynote Chart Templates?
Relationship Keynote Chart Templates offer a fast, professional way to enhance your presentations. Here`s why they`re a game-changer:
- Clarity: Transform complex relationships into easy-to-understand visuals.
- Time-Saving: Pre-built designs let you focus on your message, not slide creation.
- Professional Design: Sleek, modern layouts align with brand standards.
- Fully Customizable: Adjust colors, fonts, and elements to suit your needs.
- Engaging Visuals: Captivate your audience with dynamic infographics.
Types of Relationship Keynote Chart Templates
Our collection of Relationship Keynote Chart Templates includes a variety of formats to meet diverse needs:
- Hierarchical Charts: Illustrate organizational structures, such as company teams or project roles.
- Venn Diagrams: Highlight similarities and differences between concepts or datasets.
- Flowcharts: Map out processes, workflows, or decision-making sequences.
- Matrix Charts: Compare multiple variables for in-depth analysis.
- Network Diagrams: Visualize interconnections in social or organizational networks.
Practical Applications of Relationship Keynote Chart Templates
These templates are versatile and can be applied across various scenarios. Here are some examples:
- Business Strategy Meetings: Use hierarchical charts to outline team structures or matrix charts to analyze market trends.
- Academic Presentations: Simplify complex theories with Venn diagrams or flowcharts for clearer explanations.
- Project Management: Track dependencies and workflows with network diagrams to keep teams aligned.
- Marketing Campaigns: Visualize customer segmentation or campaign strategies with matrix charts.
- Consulting Reports: Present data-driven insights using professional infographic templates.
For example, a marketing manager might use a Venn diagram to compare customer preferences across demographics, while a project manager could use a flowchart to map a product development timeline. These templates make abstract concepts tangible and actionable.
Who Needs Relationship Keynote Chart Templates?
Relationship Keynote Chart Templates are valuable for professionals across industries:
- Corporate Teams: Streamline internal communications, strategic planning, and reporting.
- Educators and Researchers: Create engaging visual aids for lectures or research presentations.
- Consultants and Analysts: Deliver clear, impactful insights to clients.
- Project Managers: Clarify roles, responsibilities, and workflows for teams.
- Marketing and Sales Teams: Craft compelling pitches and client presentations.
How to Customize Relationship Keynote Chart Templates
Customizing these templates is simple and ensures your presentations stand out. Follow these tips:
- Match Your Brand: Update colors and fonts to reflect your company`s identity.
- Add Relevant Data: Insert specific metrics, names, or text to personalize charts.
- Use Animations: Apply Keynote`s animation features to make slides dynamic.
- Keep It Clean: Avoid overloading charts with too much information.
- Test Compatibility: Preview slides on different devices to ensure readability.
For instance, a corporate trainer could customize a hierarchical chart by adding employee names and roles, using brand colors to align with company guidelines. Keynote`s intuitive interface makes these adjustments quick and seamless.
Free vs. Premium Relationship Keynote Chart Templates
Deciding between free and premium templates? Here`s a comparison to help you choose:
| Feature | Free Templates | Premium Templates |
|---|---|---|
| Design Quality | Basic, Functional | Polished, Professional |
| Customization Options | Limited | Extensive, Flexible |
| Support | None | Dedicated Customer Support |
| Updates | Rare | Frequent Design Updates |
| Unique Features | Standard | Exclusive Designs, Animations |
Free templates are great for quick projects, but premium templates offer advanced features and a professional edge, ideal for high-stakes presentations.
Case Study: Using Relationship Keynote Chart Templates in Action
Consider a tech startup preparing for an investor pitch. The team uses a Relationship Keynote Chart Template to create a network diagram showcasing their partnership ecosystem, including vendors, clients, and investors. By customizing the diagram with brand colors and adding key metrics (e.g., partnership growth), they create a compelling visual that highlights their market position. The result? A clear, memorable presentation that secures funding.
In another scenario, a university professor uses a Venn diagram to compare economic theories in a lecture. By customizing the template with specific data points and animations, the professor engages students and simplifies complex concepts, earning positive feedback.
Why Keynote for Relationship Chart Templates?
Apple Keynote is a powerful platform for creating presentations, and its features make it ideal for Relationship Keynote Chart Templates:
- Intuitive Interface: Drag-and-drop functionality simplifies chart creation.
- High-Quality Graphics: Keynote supports crisp, scalable visuals.
- Animation Tools: Add transitions to make charts dynamic.
- Cloud Integration: Collaborate and access templates from any device.
- Compatibility: Export slides to PowerPoint or PDF for broader use.
Compared to PowerPoint, Keynote offers a more streamlined design experience, making it a top choice for Mac users and creative professionals.
Tips for Creating Impactful Presentations with Relationship Keynote Chart Templates
Elevate your presentations with these best practices:
- Know Your Audience: Tailor charts to their needs and expertise level.
- Use Consistent Design: Maintain uniform colors and fonts across slides.
- Highlight Key Points: Use bold text or icons to emphasize critical relationships.
- Practice Delivery: Rehearse to ensure smooth transitions between charts.
- Gather Feedback: Test your presentation with colleagues for clarity.
FAQs About Relationship Keynote Chart Templates
- What are Relationship Keynote Chart Templates? Pre-designed Keynote slides for visualizing relationships, hierarchies, or processes.
- Why are they useful? They save time, improve clarity, and deliver professional visuals.
- Can I customize them? Yes, easily adjust colors, text, and layouts to fit your brand.
- Are they suitable for all industries? Absolutely, from business to education and beyond.
- How do they enhance presentations? Clear visuals boost engagement and comprehension.
- Where can I find them? Download free and premium options from ImagineLayout`s collection.
- Can I use them with PowerPoint? Yes, export Keynote slides to PowerPoint format.
Relationship Keynote Chart Templates are your key to creating impactful, professional presentations. Whether you`re visualizing team structures, analyzing market data, or teaching complex concepts, these editable Keynote slides make your message clear and memorable. Explore our collection today and transform your presentations with stunning infographics!