Cycle Keynote Charts
Elevate your presentations with our Cycle Keynote Charts Templates, expertly crafted for Apple`s Keynote software and available for instant download. Explore a wide range of customizable Keynote charts designed to visualize cyclical processes, making them ideal for business strategies, educational lessons, or project timelines. Whether you`re preparing a pitch for a small team or delivering a keynote to a large audience, these editable templates offer a professional, polished look that simplifies complex data and captivates your viewers. With options like circular flow diagrams and spiral cycles, you can easily adapt each template to your unique needs - saving time while ensuring your message resonates. Download your Cycle Keynote Charts Templates today and transform your data into compelling visual stories.
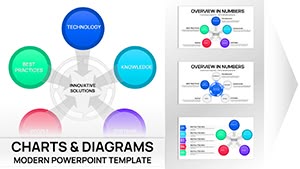 (9)
(9) Keynote Innovative Solutions Charts - Editable Keynote | ImagineLayoutID: #KC01114$18.00
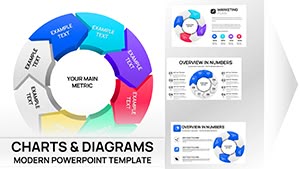 (13)
3D Volume Cyclic Keynote Charts - Editable | ImagineLayoutID: #KC01113$20.00
(13)
3D Volume Cyclic Keynote Charts - Editable | ImagineLayoutID: #KC01113$20.00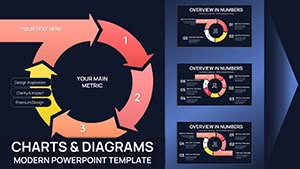 (17)
Cycle Charts Keynote Template - 44 Editable Slides | Instant DownloadID: #KC01096$20.00
(17)
Cycle Charts Keynote Template - 44 Editable Slides | Instant DownloadID: #KC01096$20.00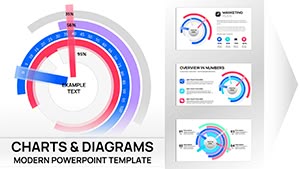 (10)
Circular Cycle Charts Keynote Template - Fully Editable | Instant Download | ImagineLayoutID: #KC01091$12.00
(10)
Circular Cycle Charts Keynote Template - Fully Editable | Instant Download | ImagineLayoutID: #KC01091$12.00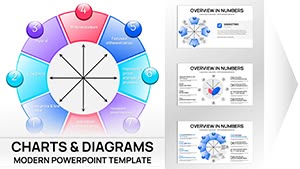 (8)
Bowman's Strategy Clock Keynote Template - 42 Fully Editable Slides | ImagineLayoutID: #KC01088$16.00
(8)
Bowman's Strategy Clock Keynote Template - 42 Fully Editable Slides | ImagineLayoutID: #KC01088$16.00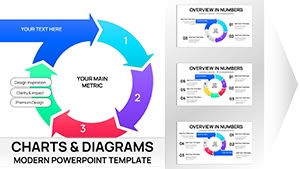 (8)
Incoming Cycle Charts Keynote Template - Fully Editable | Instant Download | ImagineLayoutID: #KC01087$20.00
(8)
Incoming Cycle Charts Keynote Template - Fully Editable | Instant Download | ImagineLayoutID: #KC01087$20.00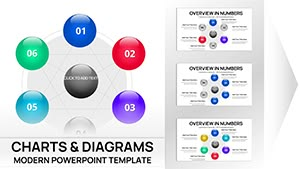 (15)
(15) Network Charts Keynote Template - Fully Editable 26 Slides | Instant Download | ImagineLayoutID: #KC01084$12.00
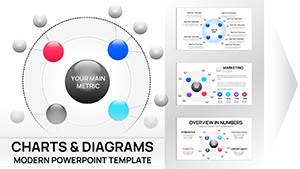 (9)
Cycle Charts Template for Keynote - 40 Fully Editable Slides | Instant DownloadID: #KC01083$14.00
(9)
Cycle Charts Template for Keynote - 40 Fully Editable Slides | Instant DownloadID: #KC01083$14.00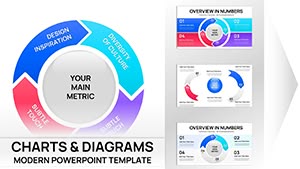 (11)
Cyclical Pie Charts Keynote Template - Fully Editable | Instant DownloadID: #KC01079$18.00
(11)
Cyclical Pie Charts Keynote Template - Fully Editable | Instant DownloadID: #KC01079$18.00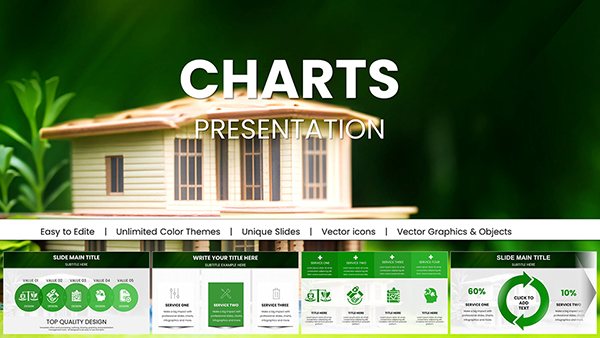 (9)
Modern Real Estate Charts Keynote Template: Plot Your Path to Profitable PitchesID: #KC01057$25.00
(9)
Modern Real Estate Charts Keynote Template: Plot Your Path to Profitable PitchesID: #KC01057$25.00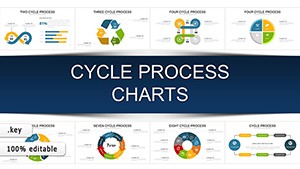 (936)
(936) Cycle Process Keynote Charts - Instant Download | ImagineLayoutID: #KC00922$20.00
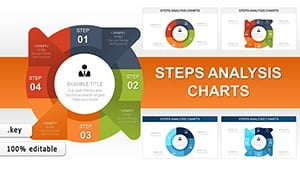 (803)
(803) Steps Analysis Keynote Charts: Project FlowsID: #KC00918$18.00
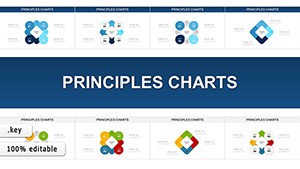 (108)
Principles Keynote Charts: Visualize Business Fundamentals with FlairID: #KC00917$16.00
(108)
Principles Keynote Charts: Visualize Business Fundamentals with FlairID: #KC00917$16.00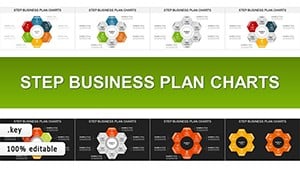 (1112)
Step Business Plan Cycles: Keynote Chart Mastery for Ambitious BuildersID: #KC00916$23.00
(1112)
Step Business Plan Cycles: Keynote Chart Mastery for Ambitious BuildersID: #KC00916$23.00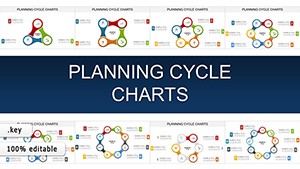 (217)
Planning Cycle Charts: Strategic Keynote Visuals for Forward-Thinking ProsID: #KC00915$20.00
(217)
Planning Cycle Charts: Strategic Keynote Visuals for Forward-Thinking ProsID: #KC00915$20.00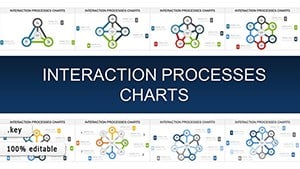 (390)
Interaction Process Cycles: Dynamic Keynote Charts for Seamless StorytellingID: #KC00914$22.00
(390)
Interaction Process Cycles: Dynamic Keynote Charts for Seamless StorytellingID: #KC00914$22.00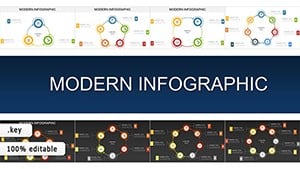 (977)
Modern Infographic Cycle Charts: Revolutionize Your Keynote PresentationsID: #KC00913$15.00
(977)
Modern Infographic Cycle Charts: Revolutionize Your Keynote PresentationsID: #KC00913$15.00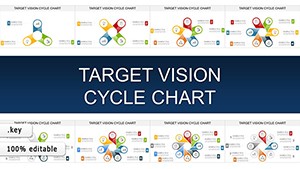 (297)
Target Vision Cycle Keynote Charts: Chart Your Bold FutureID: #KC00912$18.00
(297)
Target Vision Cycle Keynote Charts: Chart Your Bold FutureID: #KC00912$18.00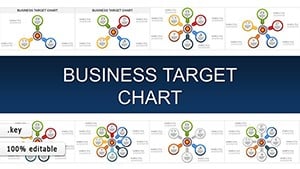 (169)
Business Target Keynote Charts: 38 Slide TemplateID: #KC00911$22.00
(169)
Business Target Keynote Charts: 38 Slide TemplateID: #KC00911$22.00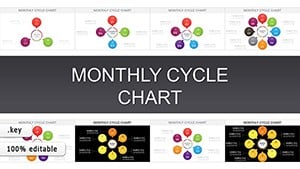 (182)
Monthly Cycle Keynote Charts: Track Progress with PrecisionID: #KC00910$15.00
(182)
Monthly Cycle Keynote Charts: Track Progress with PrecisionID: #KC00910$15.00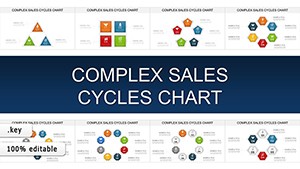 (1144)
Complex Sales Cycle Keynote Charts: Visualize Winning StrategiesID: #KC00909$18.00
(1144)
Complex Sales Cycle Keynote Charts: Visualize Winning StrategiesID: #KC00909$18.00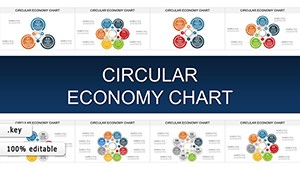 (518)
Circular Economy Keynote Charts: Close the Loop on Sustainable StorytellingID: #KC00908$20.00
(518)
Circular Economy Keynote Charts: Close the Loop on Sustainable StorytellingID: #KC00908$20.00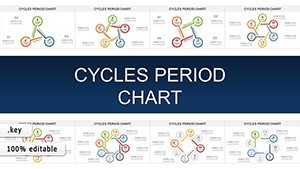 (482)
Cycles Period Keynote Template: Animate the Rhythm of Recurring Business PatternsID: #KC00907$18.00
(482)
Cycles Period Keynote Template: Animate the Rhythm of Recurring Business PatternsID: #KC00907$18.00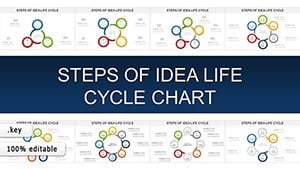 (630)
Idea Life Cycle Keynote Charts: From Brainstorm to Breakthrough in Every SlideID: #KC00906$18.00
(630)
Idea Life Cycle Keynote Charts: From Brainstorm to Breakthrough in Every SlideID: #KC00906$18.00 (89)
Step Solutions Keynote Charts: Transform Complex Processes into Clear Visual NarrativesID: #KC00905$20.00
(89)
Step Solutions Keynote Charts: Transform Complex Processes into Clear Visual NarrativesID: #KC00905$20.00 (1137)
Circular Economy Charts for Keynote: Weaving Sustainability into Every SlideID: #KC00904$15.00
(1137)
Circular Economy Charts for Keynote: Weaving Sustainability into Every SlideID: #KC00904$15.00 (1065)
Safe Period Charts for Keynote: Illuminating the Rhythms of ChangeID: #KC00903$20.00
(1065)
Safe Period Charts for Keynote: Illuminating the Rhythms of ChangeID: #KC00903$20.00 (196)
Project Cycle Steps Keynote Charts: Charting Pathways to Project TriumphID: #KC00902$20.00
(196)
Project Cycle Steps Keynote Charts: Charting Pathways to Project TriumphID: #KC00902$20.00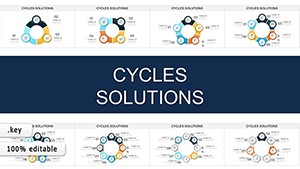 (370)
Cycles Solutions Keynote Charts: Transform Data into Compelling NarrativesID: #KC00901$20.00
(370)
Cycles Solutions Keynote Charts: Transform Data into Compelling NarrativesID: #KC00901$20.00 (667)
Rings Connection Keynote Charts for Cycle ProcessesID: #KC00868$16.00
(667)
Rings Connection Keynote Charts for Cycle ProcessesID: #KC00868$16.00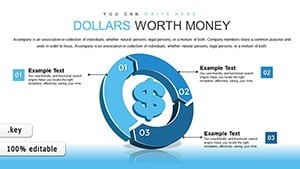 (347)
Dollars Worth Money Keynote Charts: Navigate Global Finance with Cycle VisualsID: #KC00835$15.00
(347)
Dollars Worth Money Keynote Charts: Navigate Global Finance with Cycle VisualsID: #KC00835$15.00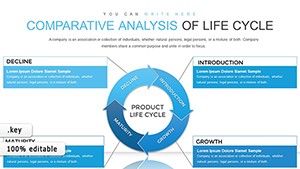 (386)
Life Cycle Analysis Keynote Charts for ManagersID: #KC00832$15.00
(386)
Life Cycle Analysis Keynote Charts for ManagersID: #KC00832$15.00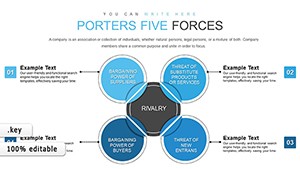 (878)
Porter's Five Forces Keynote Charts: Master Competitive StrategyID: #KC00825$15.00
(878)
Porter's Five Forces Keynote Charts: Master Competitive StrategyID: #KC00825$15.00
What Are Cycle Keynote Charts Templates?
Cycle Keynote Charts Templates are pre-designed slides for Apple`s Keynote software, tailored to illustrate recurring processes, workflows, or phases. These visual tools help break down intricate cycles - such as product lifecycles, sales funnels, or natural phenomena - into clear, digestible visuals. Available in various formats, including free downloadable versions, they empower users to create impactful presentations without starting from scratch. Perfect for professionals, educators, and project managers, these templates combine functionality with stunning design to enhance communication.
Why Choose Cycle Keynote Charts Templates for Your Presentations?
Using Cycle Keynote Charts Templates offers numerous advantages for creating engaging and effective presentations:
- Simplified Complexity: Transform intricate cyclical data into easy-to-understand diagrams, ensuring your audience grasps key concepts quickly.
- Audience Engagement: Dynamic visuals like circular arrows or radial cycles keep viewers interested, far surpassing plain text slides.
- Professional Design: Access ready-made, high-quality layouts that elevate your presentation`s credibility and polish.
- Time-Saving Efficiency: Skip the design process with editable Keynote templates that you can customize in minutes.
- Versatility: Adapt these charts for any context - business, education, or research - while maintaining a cohesive visual style.
Explore our collection of Keynote Charts to see how these templates fit into a broader toolkit for presenters.
Types of Cycle Keynote Chart Templates Available
Our library includes a variety of Cycle Keynote Charts Templates to suit different needs:
- Basic Cycle Diagrams: Perfect for illustrating simple recurring processes like the water cycle or marketing funnels.
- Circular Flow Diagrams: Ideal for economics or supply chain visuals, showing continuous flows of resources or energy.
- Radial Cycle Diagrams: Centered around a core idea with radiating steps, great for brainstorming or strategy sessions.
- Linear Cycle Diagrams: Highlight project phases with a defined start and end, commonly used in project management templates.
- Spiral Cycle Diagrams: Showcase progression or growth over time, such as learning curves or business development stages.
Each type is fully customizable - adjust colors, fonts, and text to align with your brand or presentation theme.
How to Use Cycle Keynote Charts Templates Effectively
Here`s how to maximize the impact of your Cycle Keynote Charts Templates:
- Define Your Cycle: Identify the process or sequence you want to present, such as a sales cycle or learning progression.
- Select the Right Template: Choose a design that matches your data - radial for centralized ideas, spiral for growth over time.
- Customize with Ease: Edit placeholders with your content, tweak colors to match your branding, and resize elements as needed.
- Add Supporting Data: Include stats or examples to reinforce your cycle, making it more relatable and actionable.
- Practice Delivery: Ensure your narration complements the visuals for a seamless presentation flow.
Download a free template to test these steps and see the difference for yourself.
Examples of Applying Cycle Keynote Charts Templates
These templates shine across various scenarios:
- Business Strategy: Map out product development cycles, customer journeys, or continuous improvement processes like PDCA (Plan-Do-Check-Act).
- Education: Teach concepts like the carbon cycle or historical patterns with visually engaging slides that students can follow.
- Project Management: Outline phases like planning, execution, and review, ensuring stakeholders understand timelines and dependencies.
- Scientific Research: Visualize biological or environmental cycles, such as nutrient flows, for clear communication at conferences or in classrooms.
For more inspiration, check out our infographic templates that pair perfectly with cycle charts.
Who Needs Cycle Keynote Charts Templates?
These templates are invaluable for a wide audience:
- Business Professionals: Simplify strategy pitches, sales reports, or process optimizations with clear visuals.
- Educators and Trainers: Break down complex topics into digestible cycles for students or trainees.
- Project Managers: Communicate project timelines and iterative processes to teams and clients.
- Researchers: Present data-driven cycles, such as ecological systems, with precision and clarity.
No matter your field, Cycle Keynote Charts Templates enhance your ability to connect with your audience.
Unique Features of Our Cycle Keynote Charts Templates
What sets our templates apart?
- Fully Editable Designs: Adjust every element - shapes, colors, and text - to fit your vision.
- High-Resolution Graphics: Ensure crisp visuals, whether projected on a screen or shared digitally.
- Free Sample Downloads: Try before you buy with our free Keynote charts.
- Cross-Industry Relevance: From corporate boardrooms to classrooms, these templates adapt to any context.
- Instant Access: Download your chosen template in seconds and start building your presentation right away.
User Reviews for Cycle Keynote Charts Templates
Our users rave about the versatility and ease of use. "These templates saved me hours of design work - my audience loved the clarity," says a marketing manager. Educators note, "The spiral cycle diagrams made teaching life cycles so much more engaging." With consistent praise for their visual appeal and time-saving benefits, these Cycle Keynote Charts Templates are a go-to solution for presenters worldwide.
FAQ About Cycle Keynote Charts Templates
- What are Cycle Keynote Charts Templates? Pre-designed slides for Keynote that visualize recurring processes or workflows.
- Can I customize them? Yes, easily adjust colors, fonts, and content to suit your needs.
- Are they free? We offer free samples alongside premium options - explore both today.
- What file formats are available? Templates come in Keynote (.key) format, compatible with Mac and iOS devices.
- Who can use them? Anyone - from business leaders to students - looking to create standout presentations.
Ready to transform your next presentation? Download your Cycle Keynote Charts Templates now and make your data unforgettable.