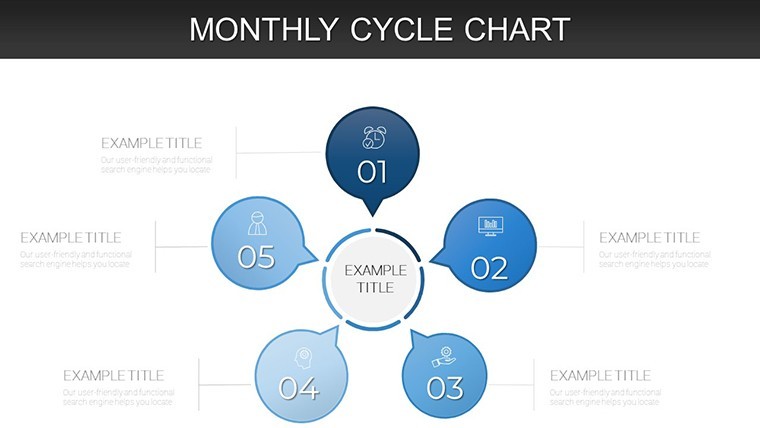
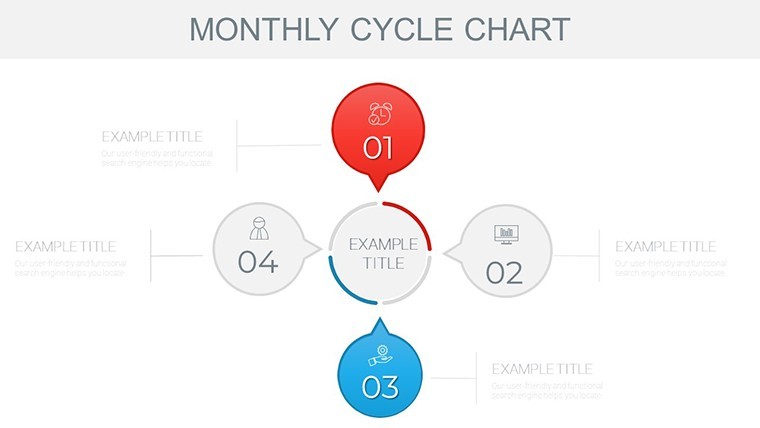
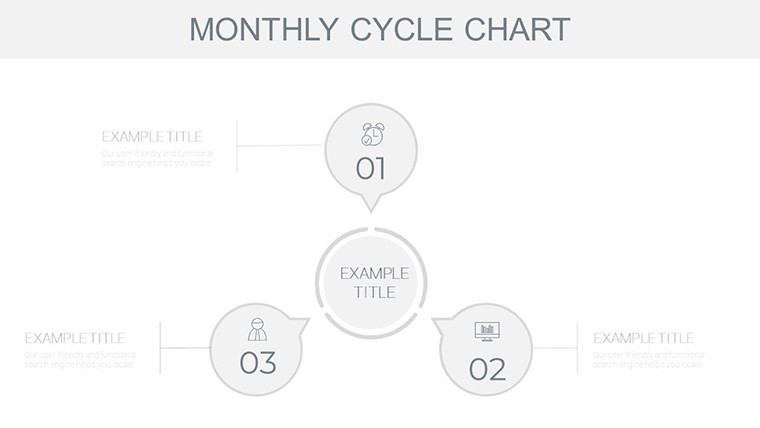
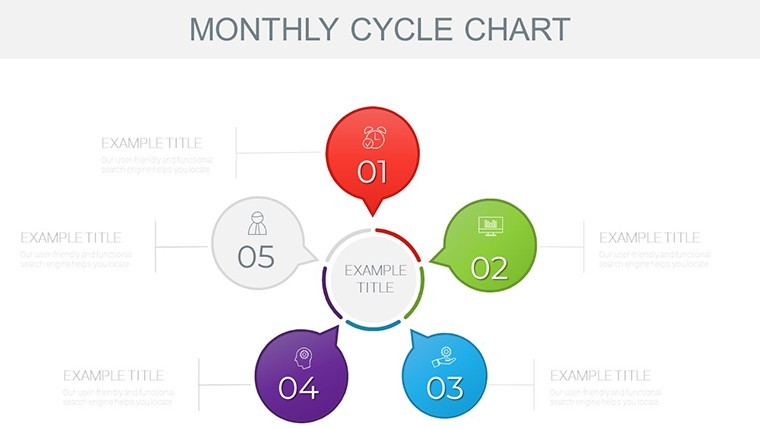
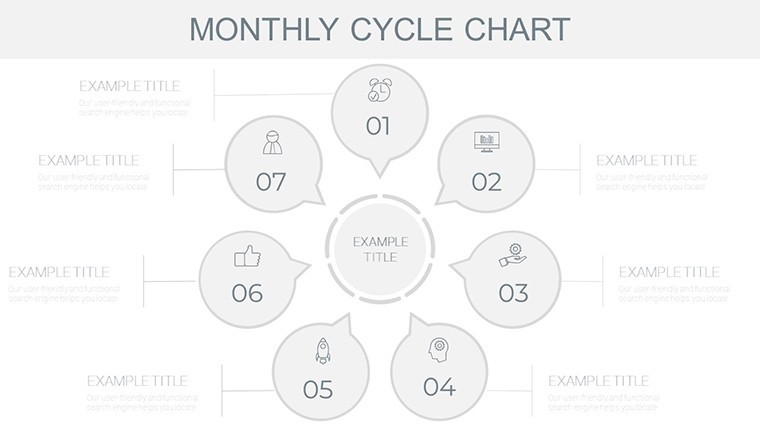
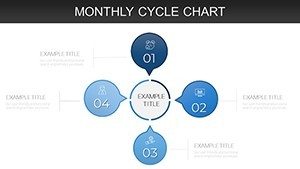
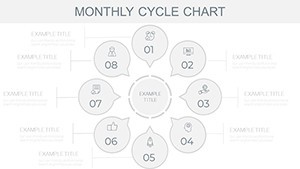
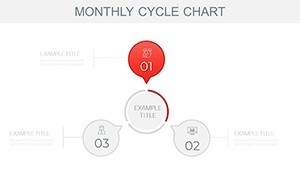
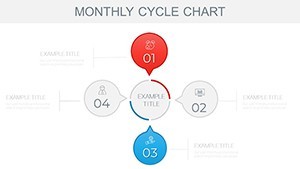
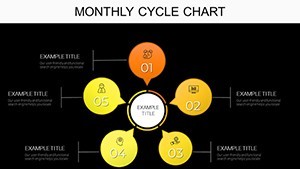
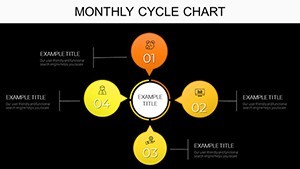
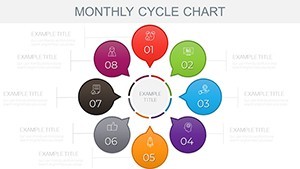
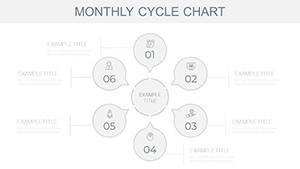
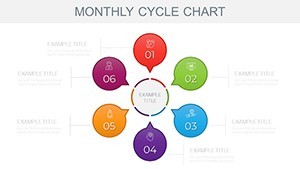
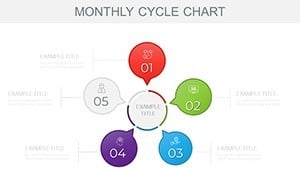
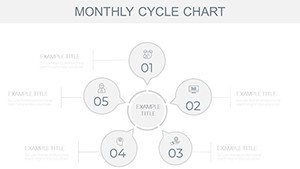
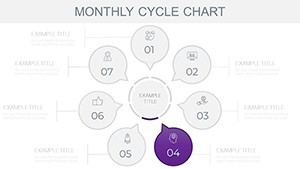
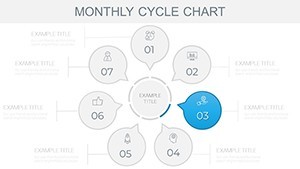
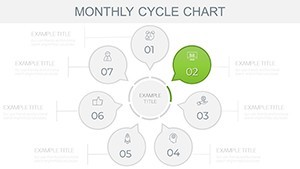
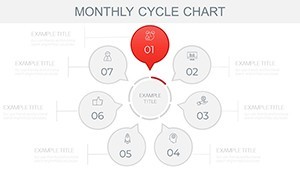
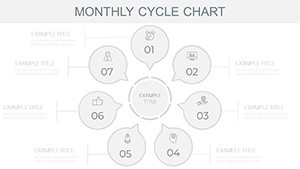
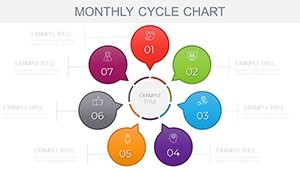
Monthly Cycle Keynote Charts: Track Progress with Precision


Type: Keynote Charts template
Category: Cycle
Sources Available: .key
Product ID: KC00910
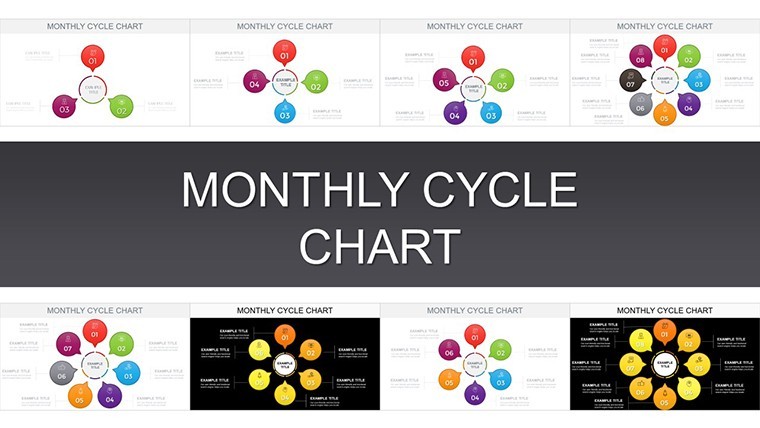
Template incl.: 44 editable slides
In the fast-paced world of business reporting, where deadlines loom and data deluges threaten to overwhelm, our Monthly Cycle Keynote Charts template emerges as a beacon of clarity. This 44-slide masterpiece is crafted for managers and analysts who need to distill monthly rhythms - be it revenue cycles, project milestones, or team performance - into visuals that spark insights and action. Forget piecing together fragmented spreadsheets; here, every slide pulses with purpose, turning routine updates into riveting recaps that align your team and wow executives.
Inspired by agile methodologies from sources like the Project Management Institute, this template helps quantify progress against plans, revealing trends that inform smarter decisions. Fully compatible with Keynote, PowerPoint, and Google Slides, it fits right into your collaborative ecosystem. With editable timelines that auto-adjust to your fiscal calendar and color gradients that highlight variances, customization feels intuitive, not laborious. Targeted at finance leads, marketing directors, and operations heads, it's the antidote to monotonous meetings - envision quarterly board sessions where your cycle charts elicit nods of approval and strategic pivots.
Discover Features Built for Monthly Mastery
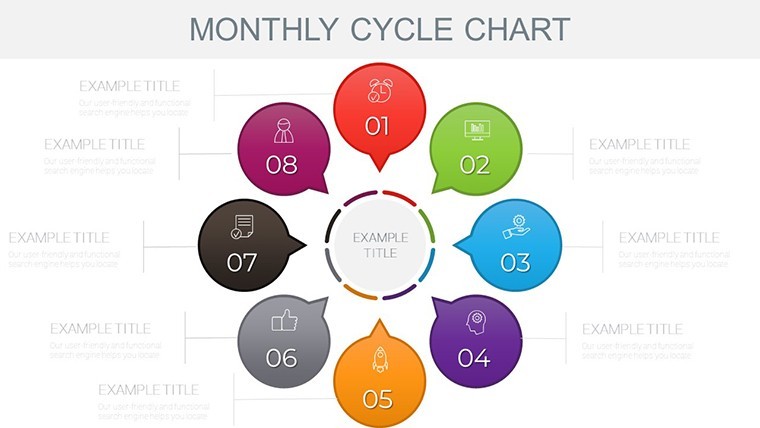
Diving deeper, the template's features are a testament to thoughtful design, prioritizing usability without sacrificing sophistication. Spanning 44 slides, it covers the full spectrum of monthly visualizations, from high-level dashboards to drill-down details, all leveraging clean, minimalist aesthetics that echo modern BI tools like Tableau.
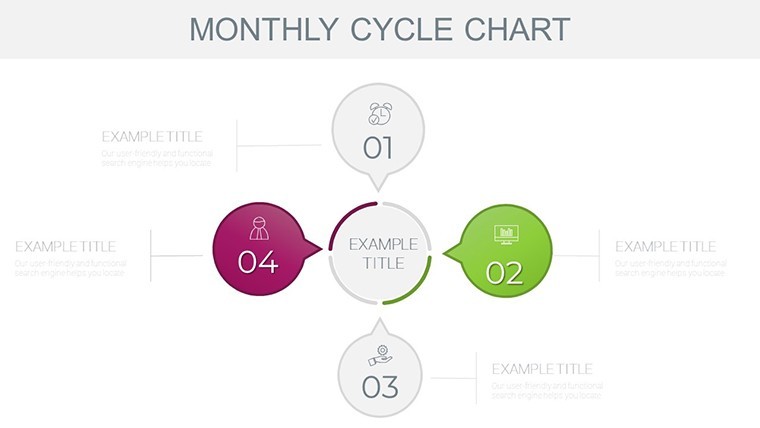
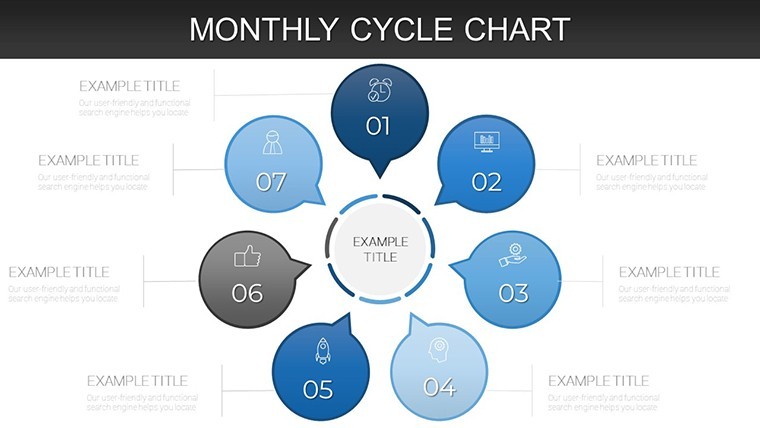
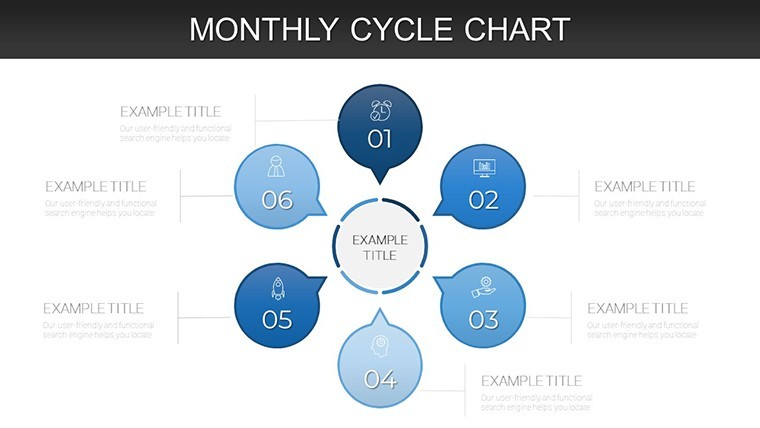
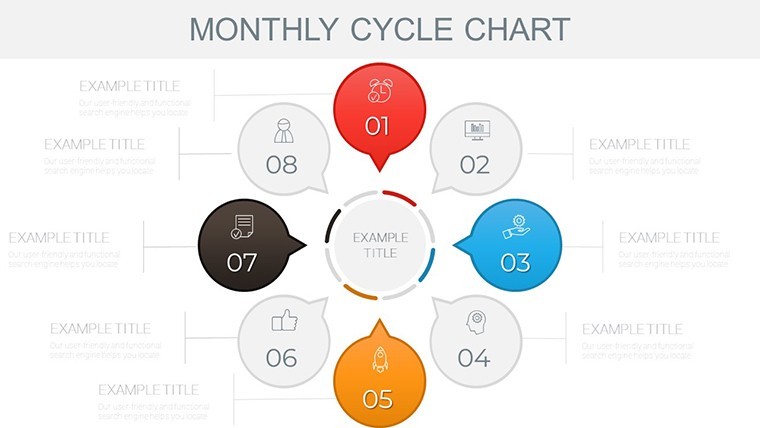
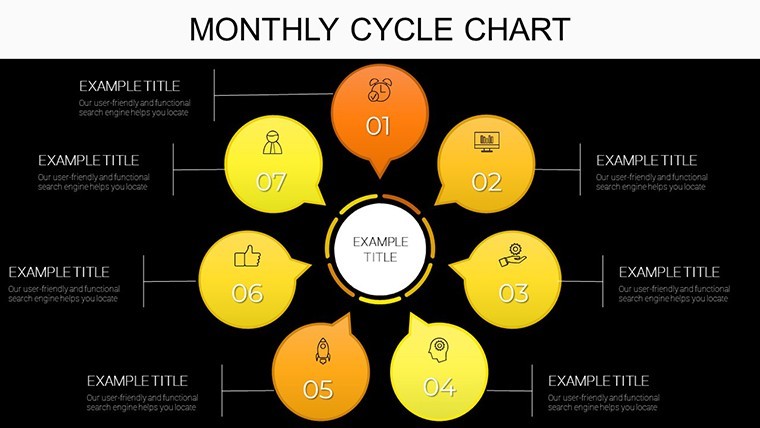
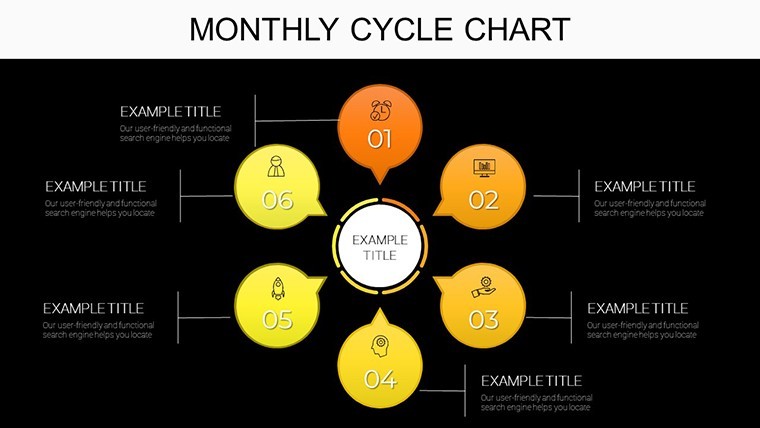
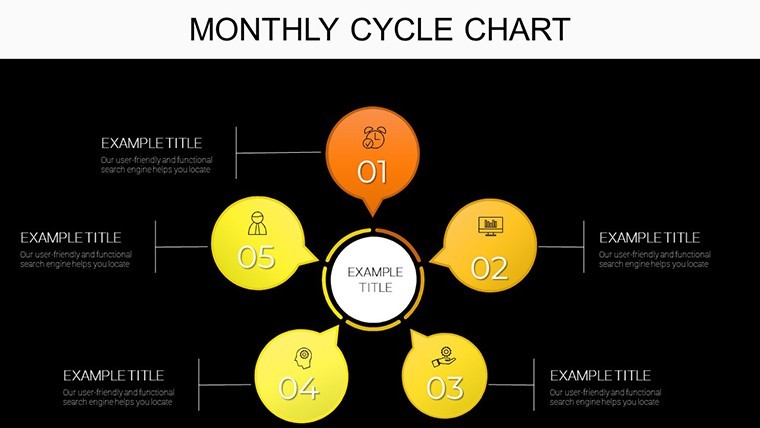
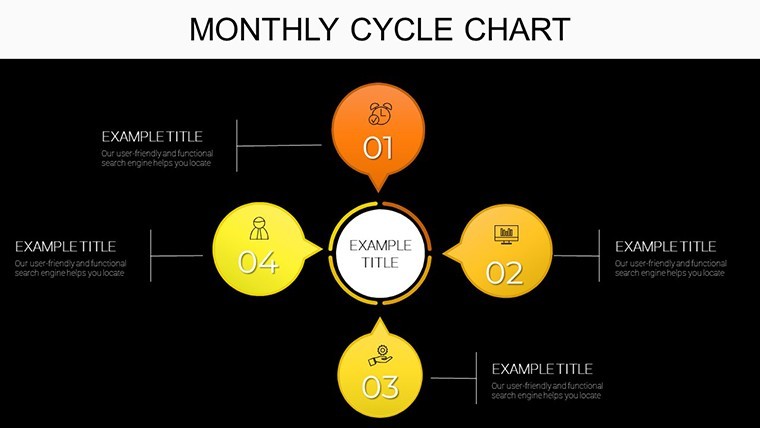
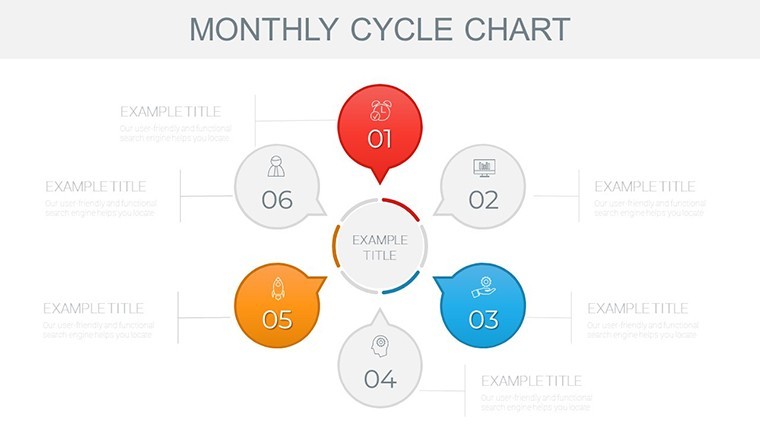
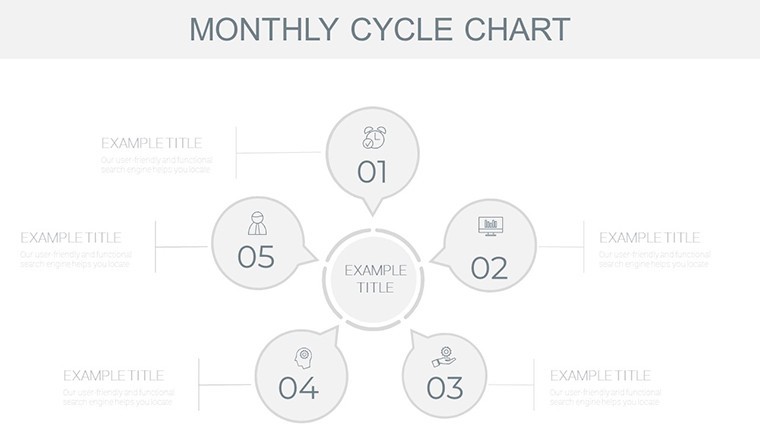
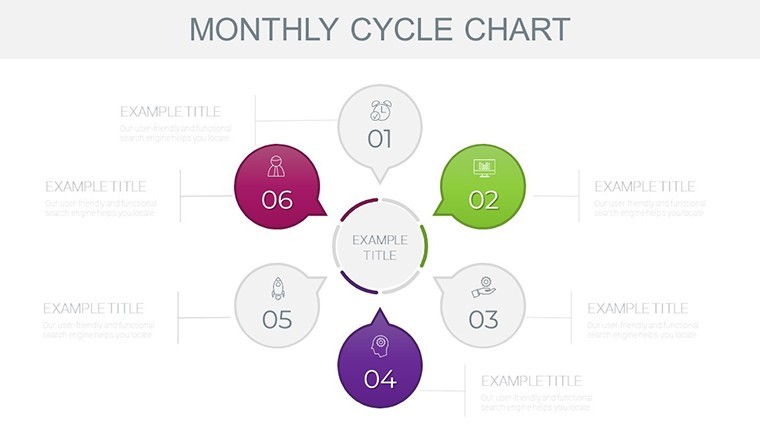
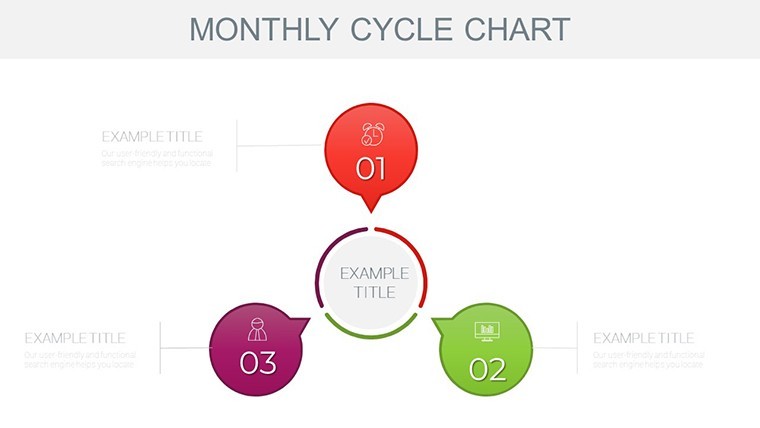
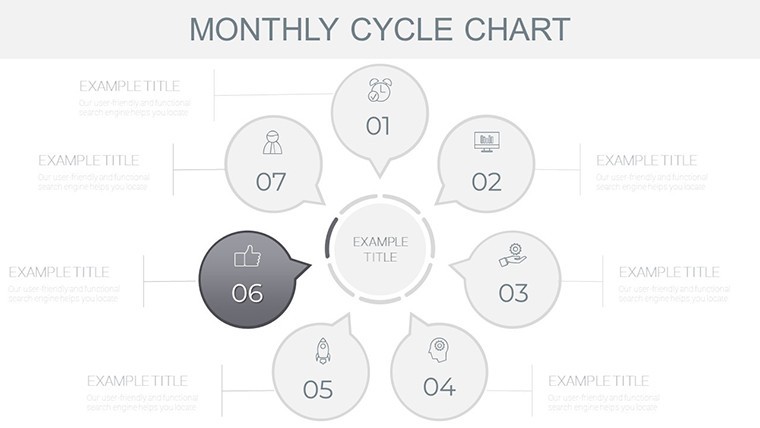
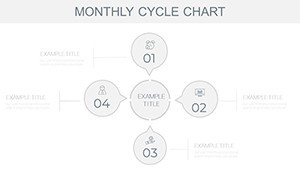
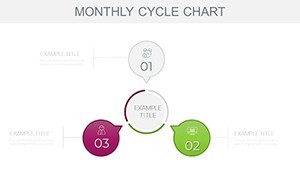
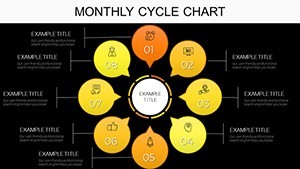
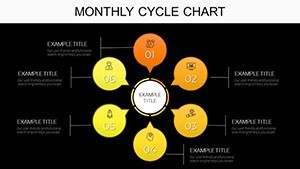
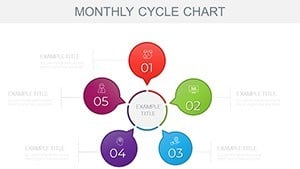
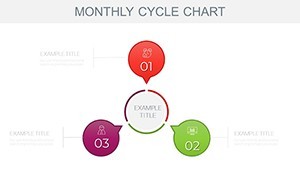
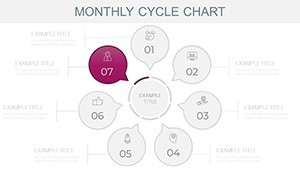
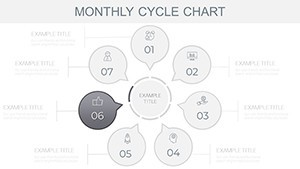
- Dynamic Timeline Cycles: Twelve slide variants for calendar-based tracking, with radial dials that rotate to spotlight current months - ideal for visualizing cash flow ebbs and flows.
- Performance Metrics Suite: Integrated gauges and progress rings that pull in your KPIs, supporting formulas for real-time calculations if linked to Excel.
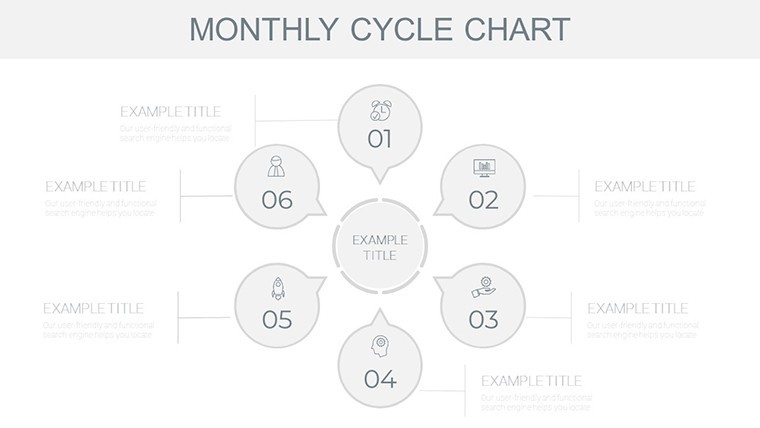
- Resource Allocation Icons: A curated set of 40+ icons depicting budgets, hours, and outputs, drawable from business process modeling notations for accuracy.
- Responsive Layouts: Fluid grids that reflow on widescreen or portrait views, ensuring your charts shine in virtual Zoom huddles or printed handouts.
These elements draw from data visualization experts like Stephen Few, emphasizing scannable hierarchies where monthly deltas pop against baselines. Slide 22, for example, employs a layered cycle to juxtapose actual vs. forecasted spends, a staple in variance analysis for cost-conscious teams.
Effortless Integration into Your Routine
Editing is a breeze: Select a cycle, swap datasets via copy-paste, and watch smart objects update across linked slides. For PowerPoint users, animations translate smoothly, while Google Slides lovers appreciate the shareable links for feedback loops. Workflow hack: Embed monthly templates into a master deck for year-over-year comparisons, streamlining annual audits as seen in Deloitte's efficiency playbooks.
Practical Use Cases That Deliver Value
Envision a marketing team wrapping Q2: Deploy slides 1-15 to chart campaign cycles, from ideation to ROI measurement, with funnel metrics that trace lead-to-conversion paths. In operations, use the mid-section for inventory turnover cycles, applying just-in-time principles to minimize waste - echoing lean manufacturing triumphs from Toyota's playbook.
- Budget Oversight Brilliance: Early slides map expenditure cycles, with waterfall charts breaking down variances for finance sign-offs.
- Team Productivity Pulses: Central layouts track sprint cycles, burndown integrations highlighting velocity gains.
- Strategic Forecasting Flows: Closing slides project forward cycles, scenario modeling with what-if branches for risk mitigation.
A mid-sized e-commerce firm reported 25% faster reporting cycles after switching to similar visuals, crediting the template's modularity. Customize for your sector: In education, adapt for academic calendar cycles; in nonprofits, for donor engagement loops. Each application underscores the template's role in demystifying monthly motions, fostering a culture of proactive planning.
Pro Hacks for Charting Success
Amplify engagement by incorporating micro-animations - fade in monthly increments to build suspense. Opt for monochromatic schemes with accent pops for accessibility, aligning with WCAG guidelines. And always anchor cycles to narratives: "This month's uptick signals scaling opportunities - here's how we'll capitalize." Such tactics, borrowed from storytelling frameworks in Nancy Duarte's works, transform data dumps into dialogues.
Stand Out from Standard Reporting Tools
Why settle for clunky Excel pivots when this template offers bespoke cycles that integrate natively? It outpaces free alternatives with its depth - 44 slides versus generic packs - and sales pros note the time savings translate to revenue gains. Backed by our satisfaction guarantee, it's more than slides; it's a catalyst for monthly excellence.
Eager to revolutionize your reports? Grab the Monthly Cycle Keynote Charts now and turn numbers into narratives. Check out complementary templates for annual overviews.
Frequently Asked Questions
How customizable are the monthly cycles?
Every arc, label, and metric is editable, with vector paths that resize without distortion.
Does it support multi-year views?
Yes, duplicate and link slides for rolling 12-month cycles, perfect for trend analysis.
Compatibility with other software?
Flawless in PowerPoint and Google Slides, with preserved layouts and effects.
What's the slide count?
44 versatile slides, designed for comprehensive monthly storytelling.
Ideal for which industries?
Finance, marketing, ops - anywhere monthly tracking drives decisions.
File delivery method?
Instant .key download, with export guides for other platforms.