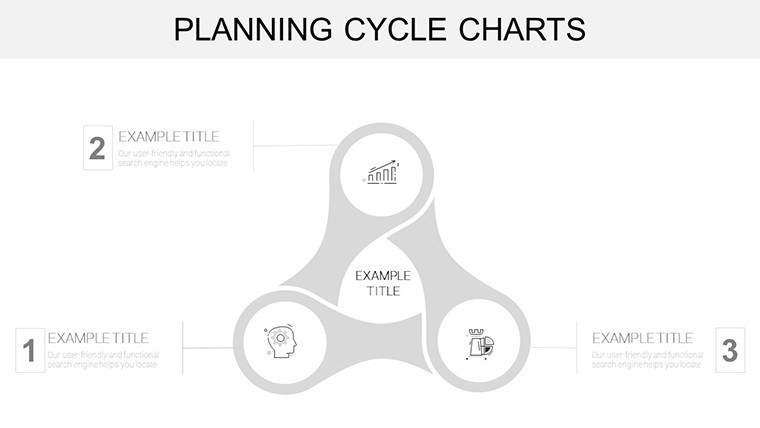
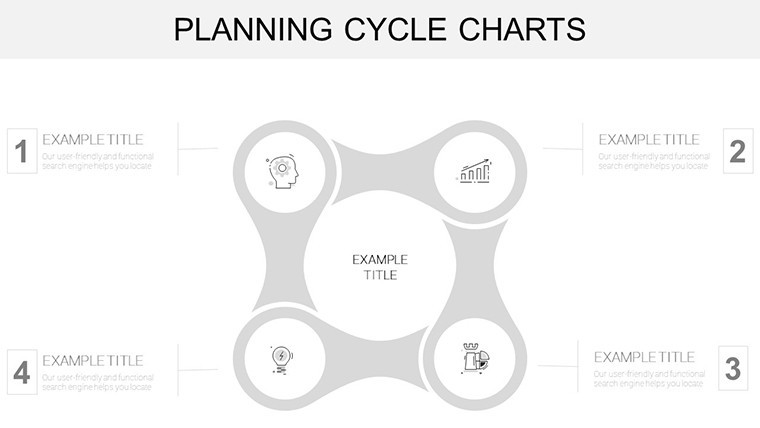
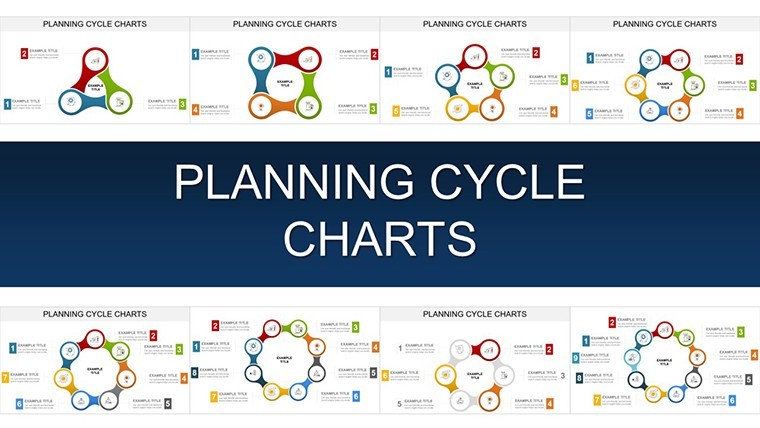
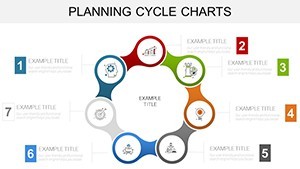
Planning Cycle Charts: Strategic Keynote Visuals for Forward-Thinking Pros


Type: Keynote Charts template
Category: Cycle
Sources Available: .key
Product ID: KC00915
Template incl.: 42 editable slides
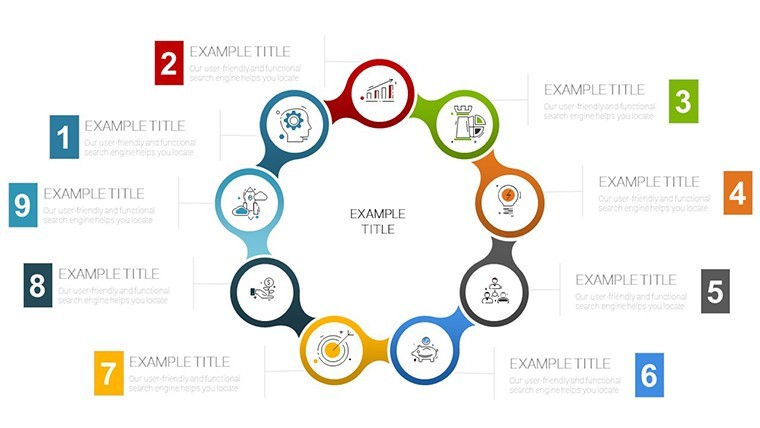
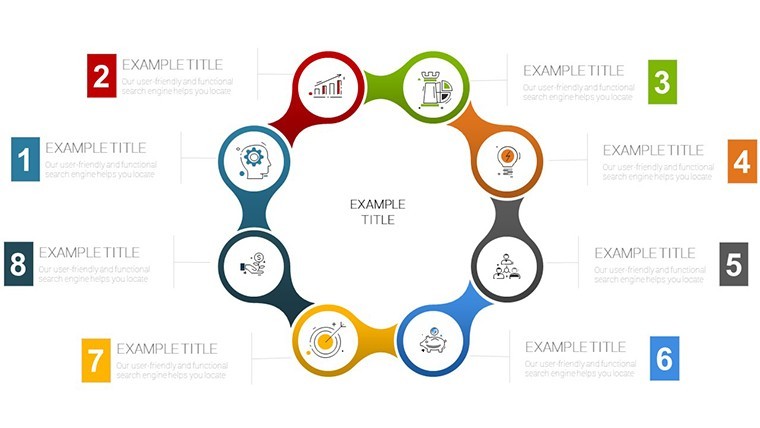
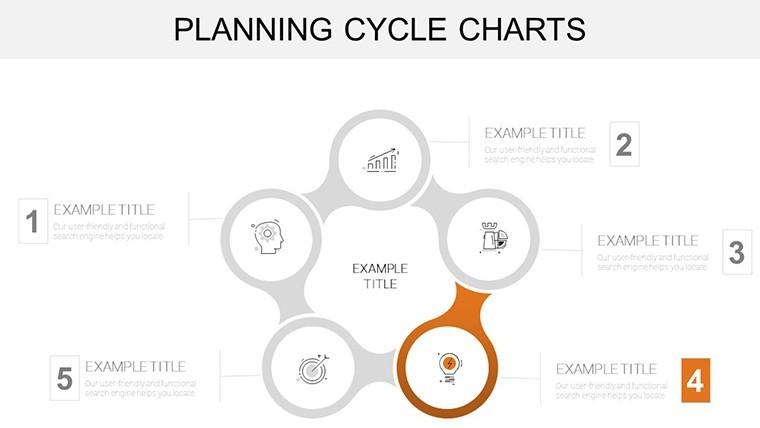
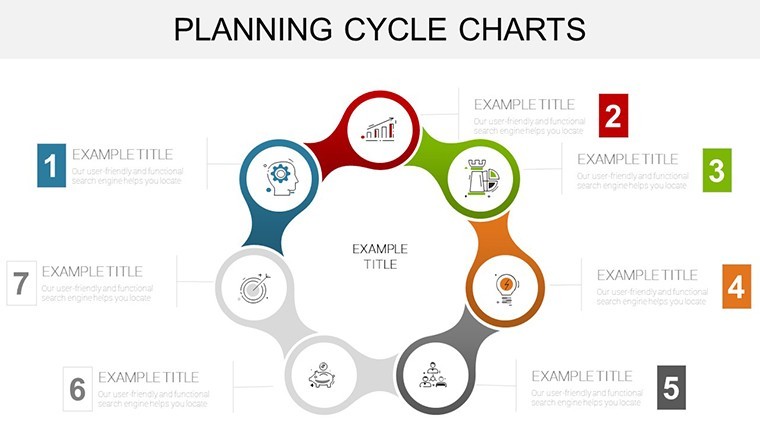
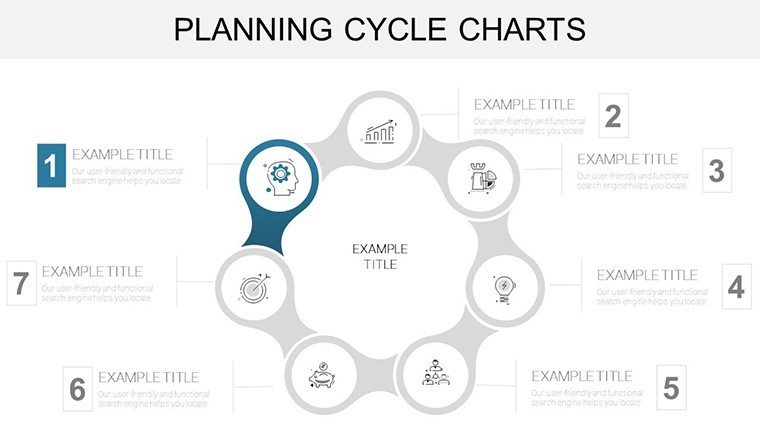
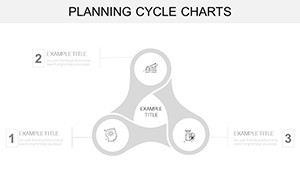
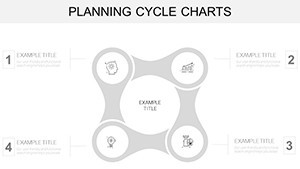
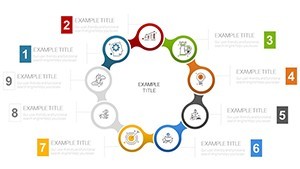
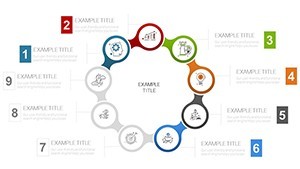
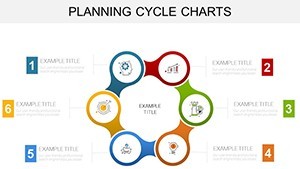
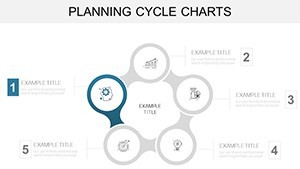
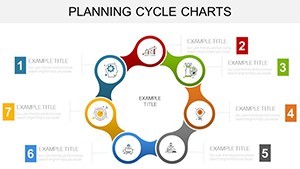
Planning isn't just about plotting points - it's about foreseeing the loops that keep your vision in motion. Our Planning Cycle Charts template for Keynote delivers exactly that: 42 meticulously designed, editable slides that capture the essence of strategic foresight. Geared toward executives, planners, and analysts in sectors like finance and operations, this toolkit turns dense strategy sessions into fluid, insightful dialogues. Envision outlining fiscal year cycles where revenue peaks and resource dips are not hidden pitfalls but highlighted opportunities for agile pivots.
Rooted in frameworks like those from the Project Management Institute (PMI), these charts emphasize foresight with layered planning visuals. Compatible with PowerPoint exports, they bridge tools for diverse teams. A Bain & Company analysis reveals that visual planning aids lift execution success by 28% - harness that here to make your strategies stick.
Discover the Strategic Edge in These Planning Cycles
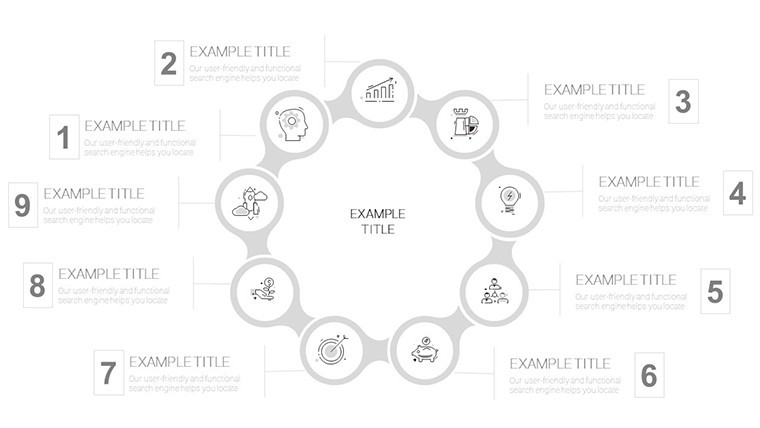
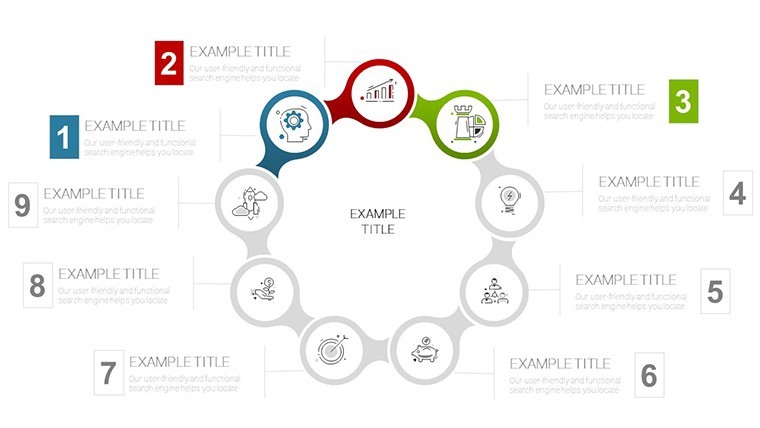
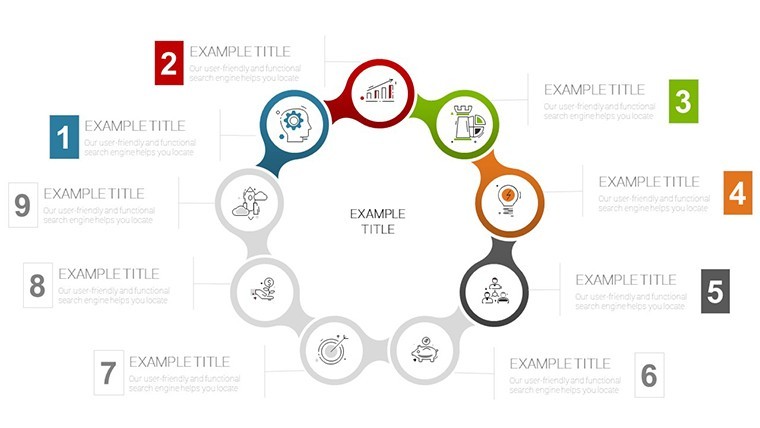
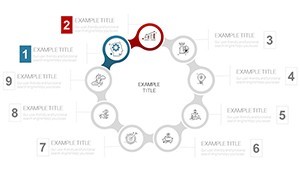
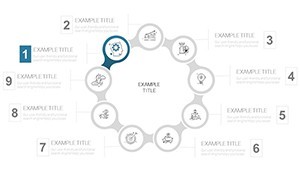
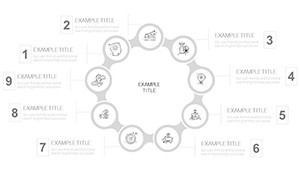
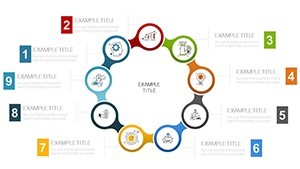
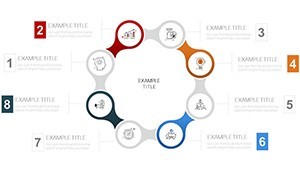
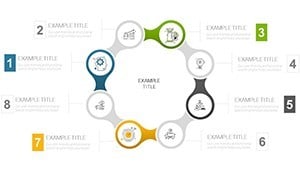
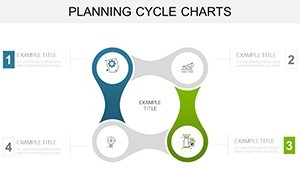
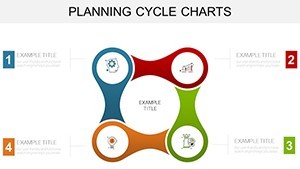
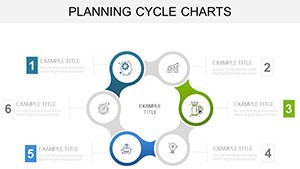
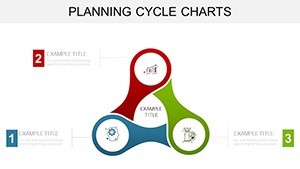
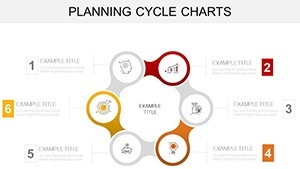
With 42 slides, versatility reigns: from linear-tied cycles for phased rollouts to holistic wheels for annual overviews. High-res vectors and smart guides ensure professional polish every time.
- Full Edit Control: Reshape timelines, adjust segment weights, and embed formulas for dynamic projections.
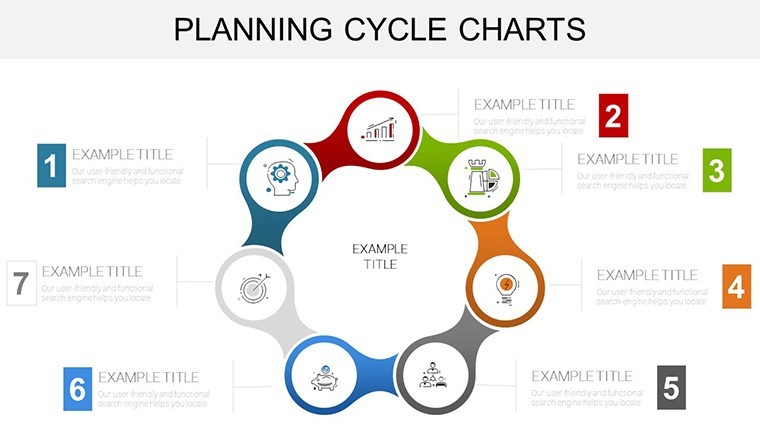
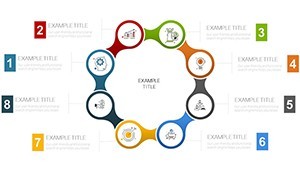
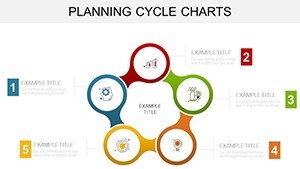
- Planning Icons Suite: 45+ symbols for milestones, risks, and metrics, curated for clarity.
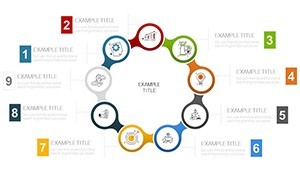
- Build-In Progressions: Animations that simulate planning horizons, unfolding quarters at a glance.
Outshining vanilla templates with predictive elements like conditional formatting, it slashes prep from days to hours.
Your Roadmap to Deployment: Step-by-Step
- Define Scope: Pinpoint cycle phases, e.g., budget forecasting, via SWOT inputs.
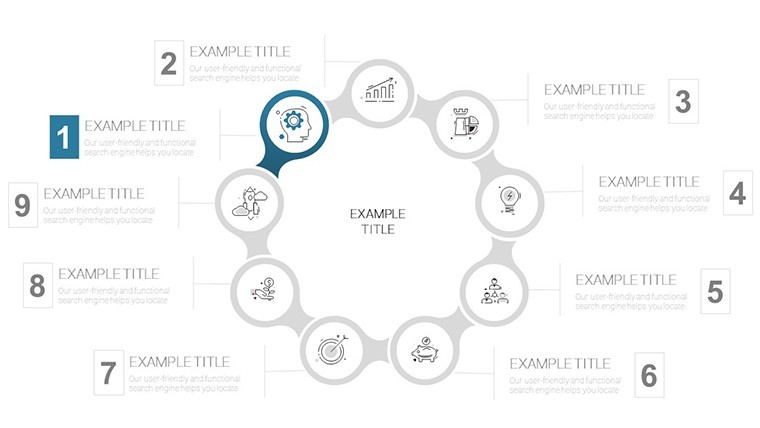
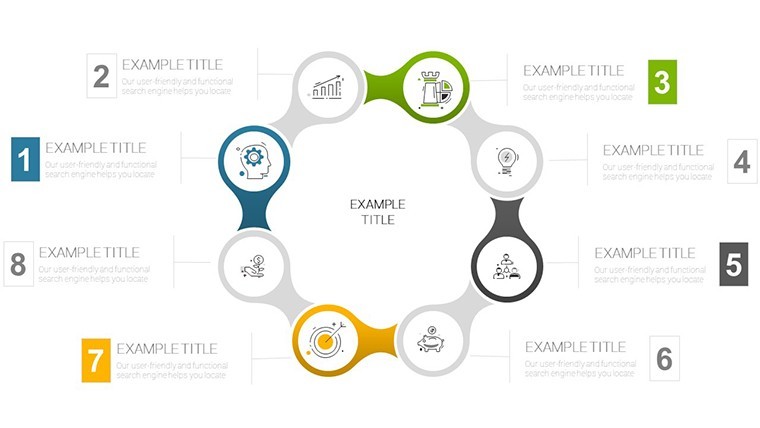
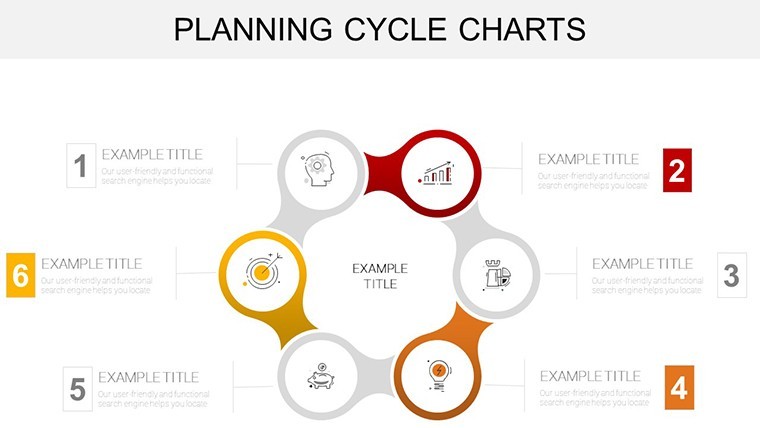
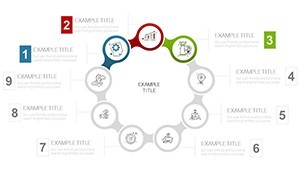
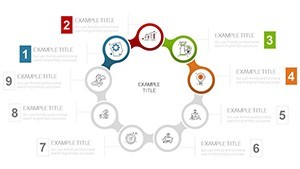
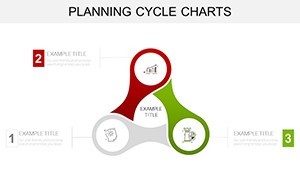
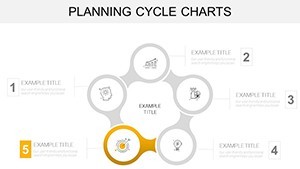
- Template Infusion: Pick a forecasting wheel (Slide #9) and layer in KPIs - use earth tones for grounded appeal.
- Contextualize: Weave in examples like Apple's product cycle planning that fueled market dominance.
- Dynamic Tweaks: Animate expansions for scenario modeling, vital for what-if analyses.
- Finalize Outreach: Share via cloud for iterative planning, exporting as needed.
This method fosters proactive cultures, turning plans into living documents.
Targeted Scenarios: Planning in Action
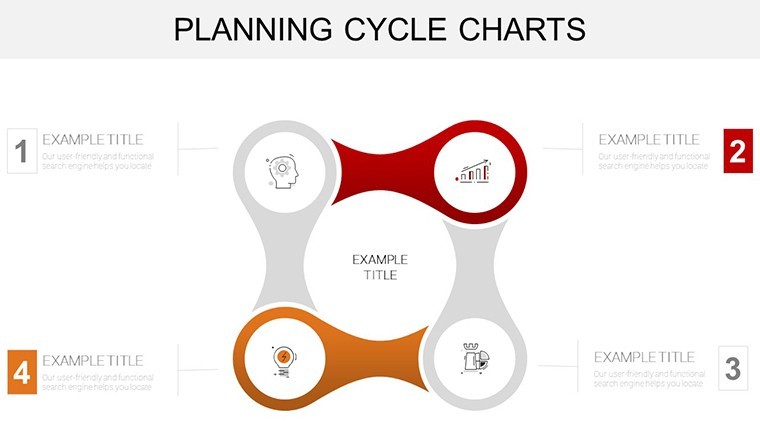
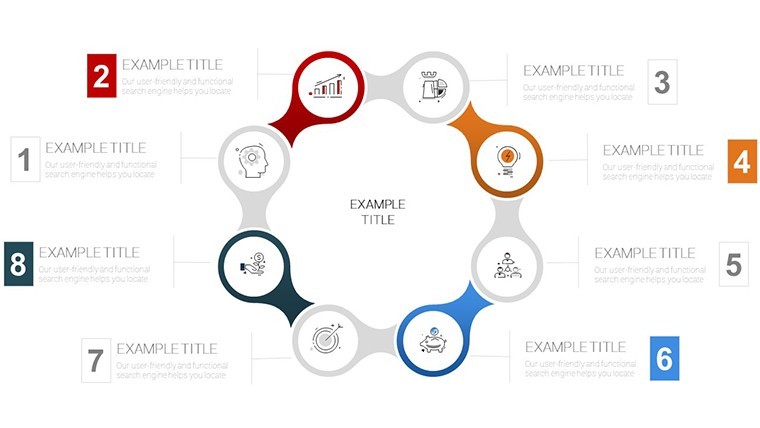
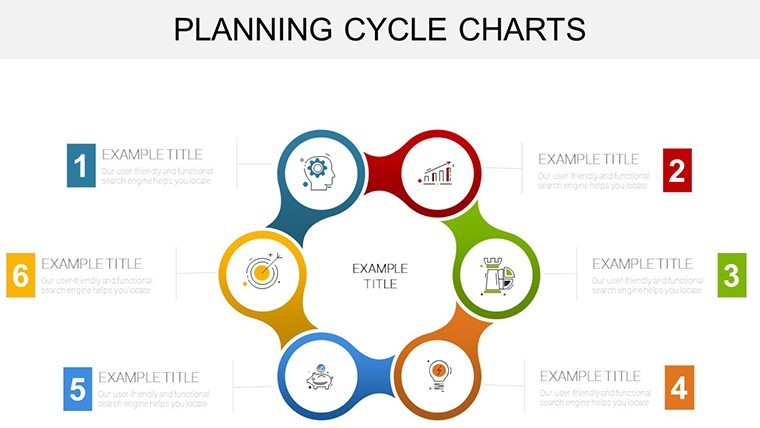
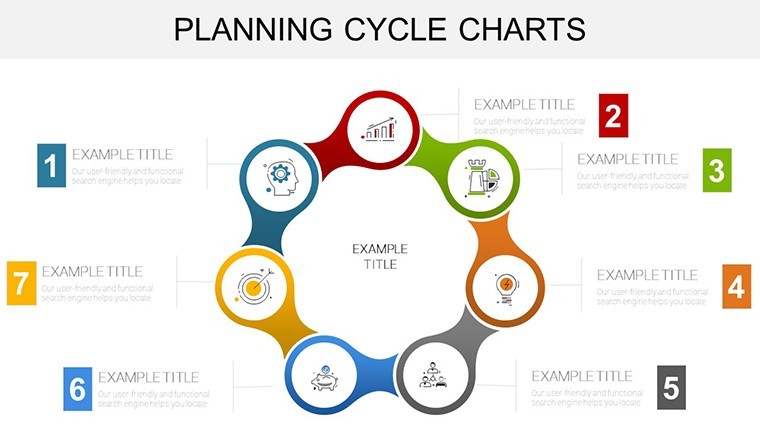
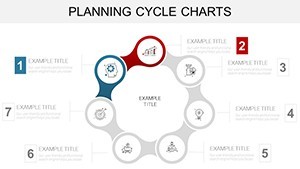
Finance teams map capex cycles with precision (Slides #1-7), aligning spends to forecasts for audit-ready decks. Operations pros chart supply cycles, mitigating disruptions as seen in post-pandemic recoveries per Deloitte.
Event planners visualize timelines for seamless executions, while educators adapt for curriculum loops. Sustainability angles? Track ESG planning cycles to meet UN goals transparently.
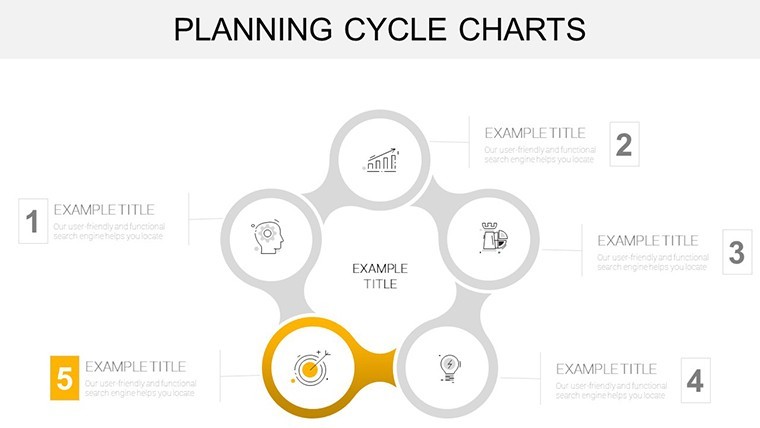
Pro hack: Use opacity layers for phased reveals, keeping focus sharp.
Expert Advice for Peak Performance
Opt for minimalist lines to avoid clutter; integrate QR codes to dashboards. "Transformed our strategic huddles," notes a CFO from Forbes lists.
Averaging 4.6 stars from 2,500+ reviews, it's trusted for high-stakes planning.
Beyond Basics: Why This Template Wins
Standard charts ignore strategy depth; ours adds 42 slides with forecasting tools at $20 - pure value.
Secure your Planning Cycle Charts today and chart the course ahead. Browse more cycles.
Frequently Asked Questions
Editable for forecasts?
Yes, supports data-linked updates for live planning.
PowerPoint friendly?
Complete export fidelity.
Slide count?
42, from basics to advanced strategies.
For finance use?
Prime; excels in budgeting and risk cycles.
Formats?
.key with multi-export.
Returns?
30-day assurance.