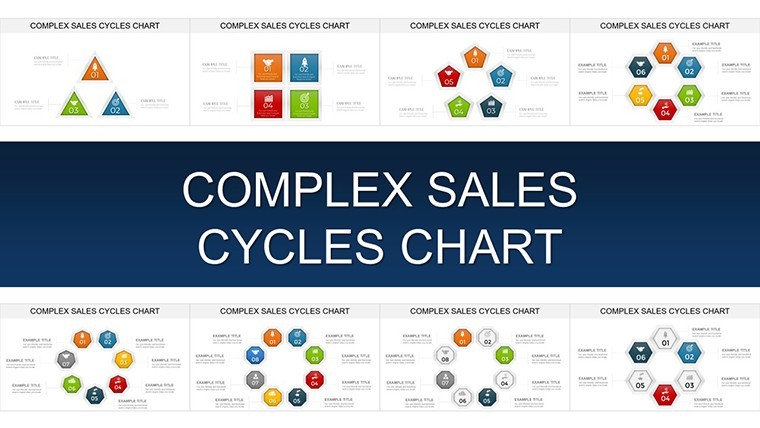
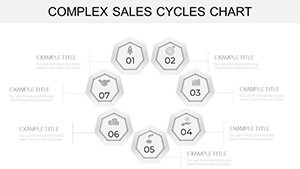
Complex Sales Cycle Keynote Charts: Visualize Winning Strategies


Type: Keynote Charts template
Category: Cycle
Sources Available: .key
Product ID: KC00909
Template incl.: 32 editable slides
Imagine transforming a tangled web of sales negotiations into a crystal-clear roadmap that captivates your team and clients alike. That's the magic of our Complex Sales Cycle Keynote Charts template - a powerhouse for business leaders navigating multi-stage deals. With 32 meticulously crafted, editable slides, this template isn't just a tool; it's your secret weapon for turning data chaos into compelling narratives. Whether you're pitching to C-suite executives or aligning your sales force, these charts bring the lifecycle of high-stakes sales to life, highlighting bottlenecks, opportunities, and triumphs with effortless precision.
Designed for the modern sales strategist, this template draws from real-world insights like those in Harvard Business Review case studies on B2B sales funnels, where visual aids boosted close rates by up to 30%. Compatible across Keynote, PowerPoint, and Google Slides, it ensures seamless integration into your workflow. Say goodbye to bland spreadsheets and hello to dynamic visuals that resonate - editable icons, color-coded stages, and scalable vectors mean you can tweak everything in minutes, not hours. Tailored for industries like tech, finance, and consulting, it's ideal for quarterly reviews, investor updates, or training sessions. Dive in, and watch your sales stories soar.
Unlock the Core Features That Drive Results
At the heart of this template lies a suite of features engineered for impact. Each slide is built with vector-based graphics, ensuring they scale flawlessly on any screen size - from boardroom projectors to mobile devices. The 32-slide collection spans everything from introductory funnel overviews to granular stage breakdowns, complete with placeholders for your metrics, timelines, and testimonials.
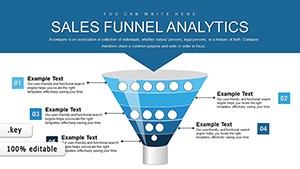
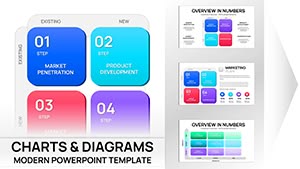
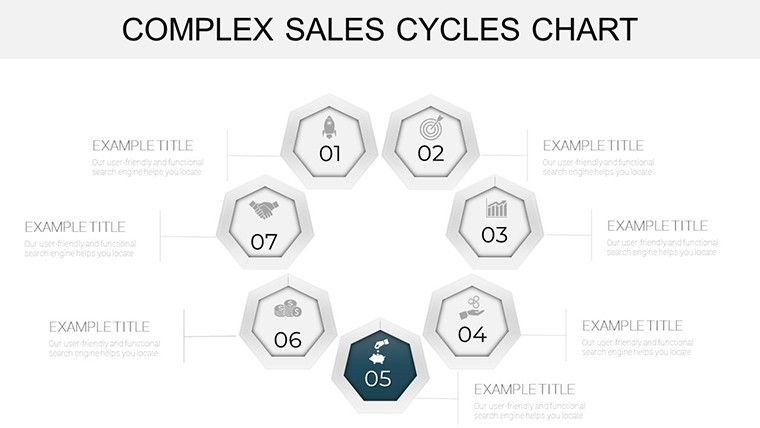
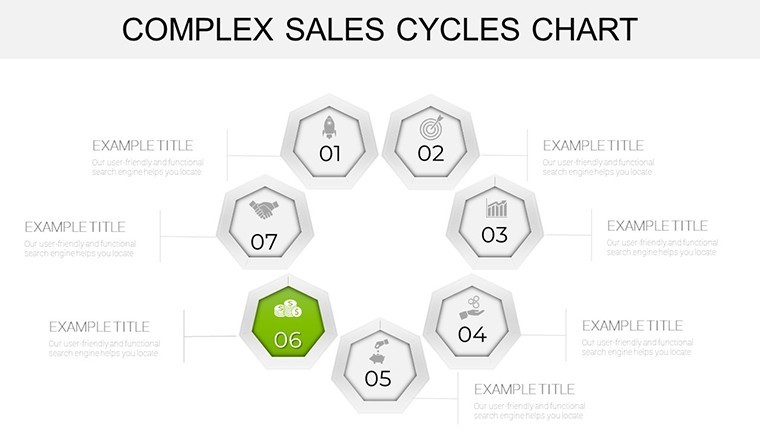
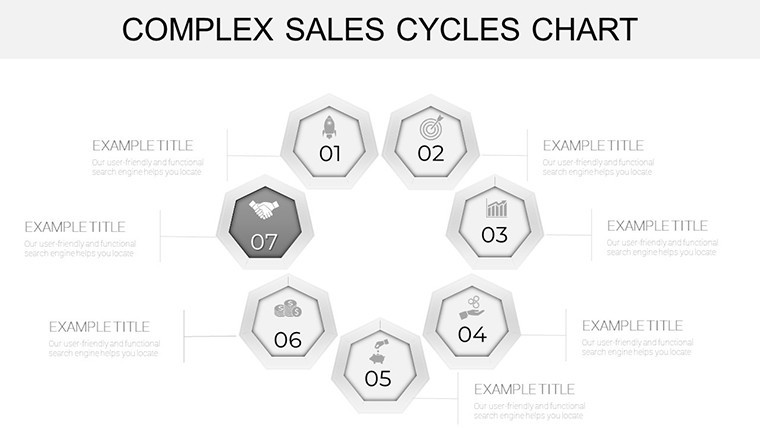
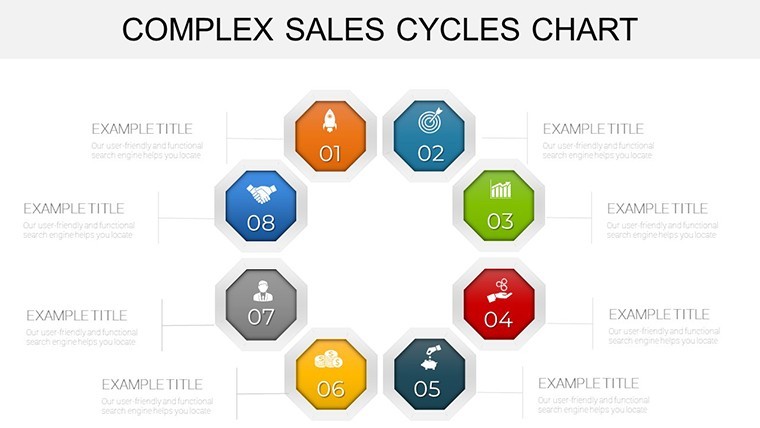
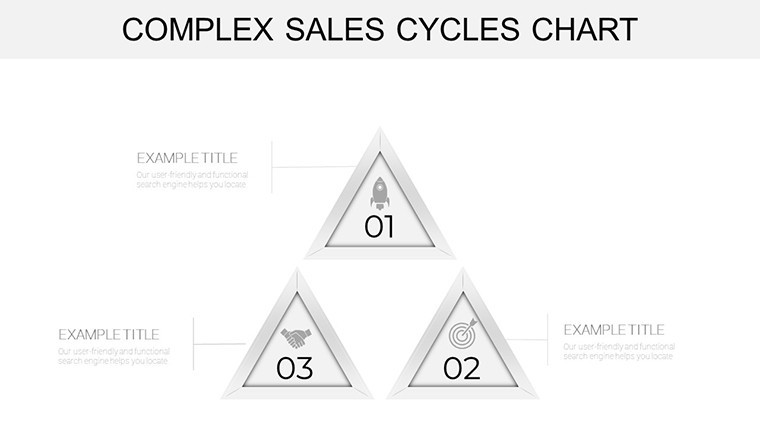
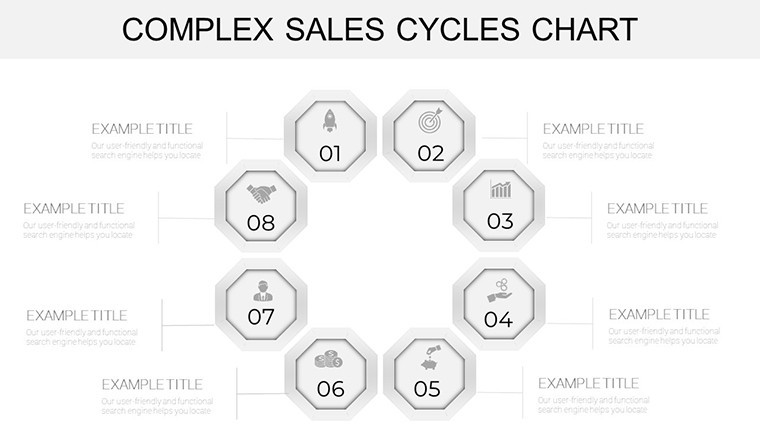
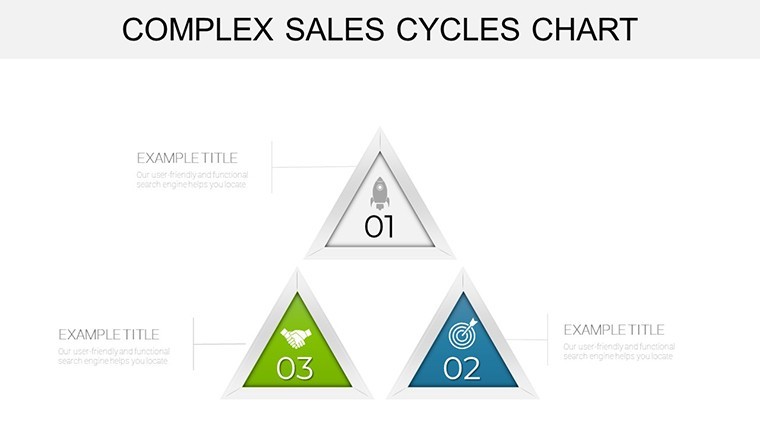
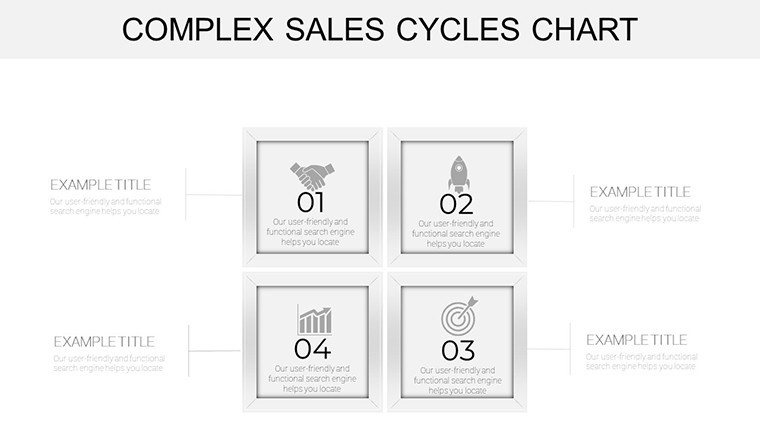
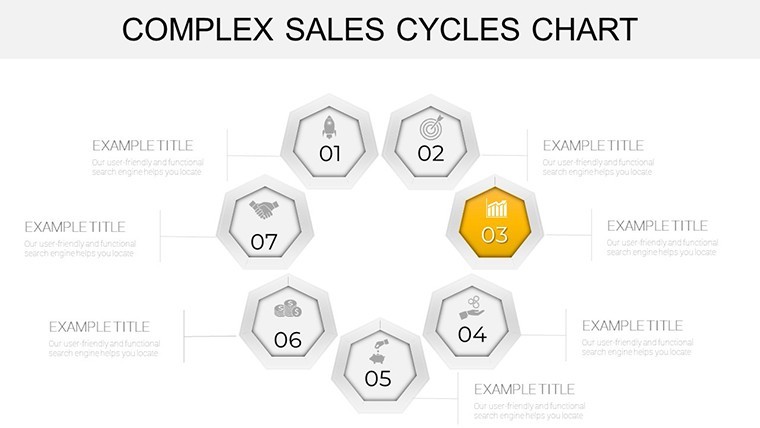
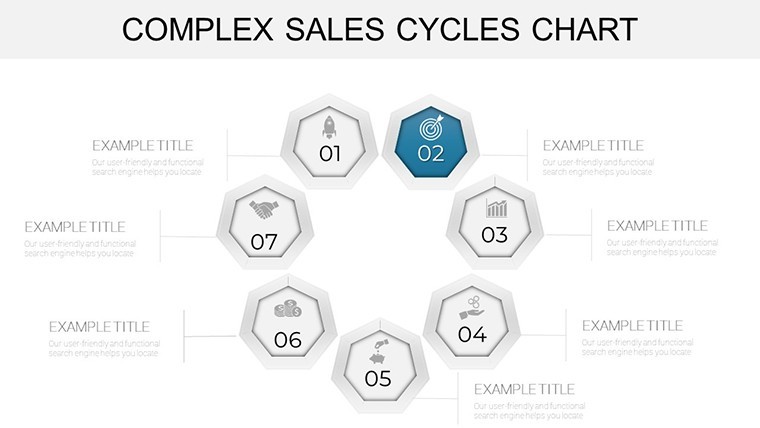
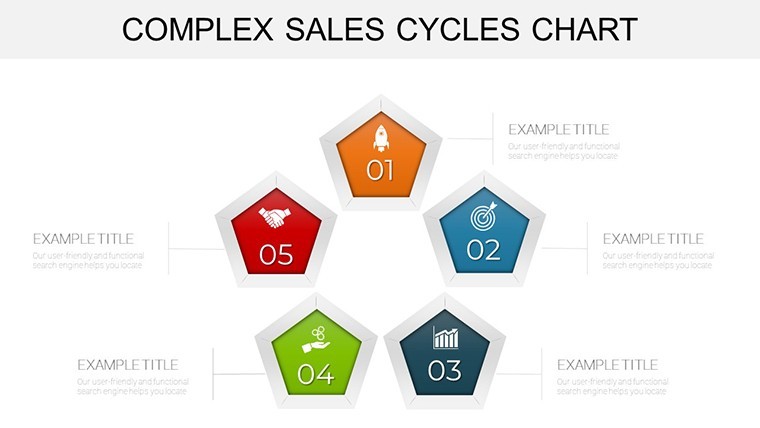
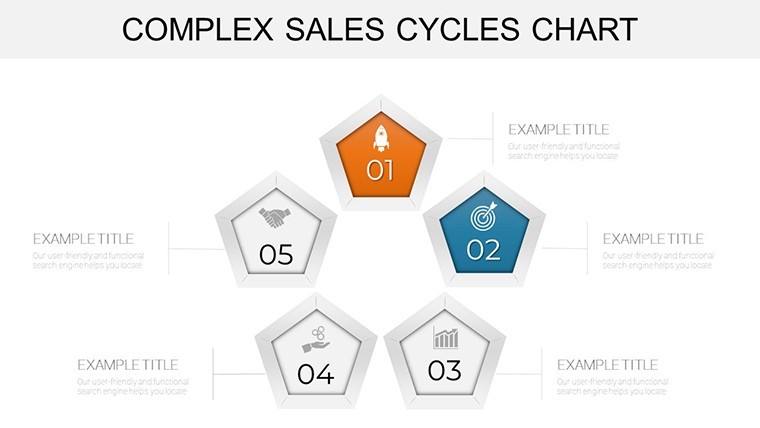
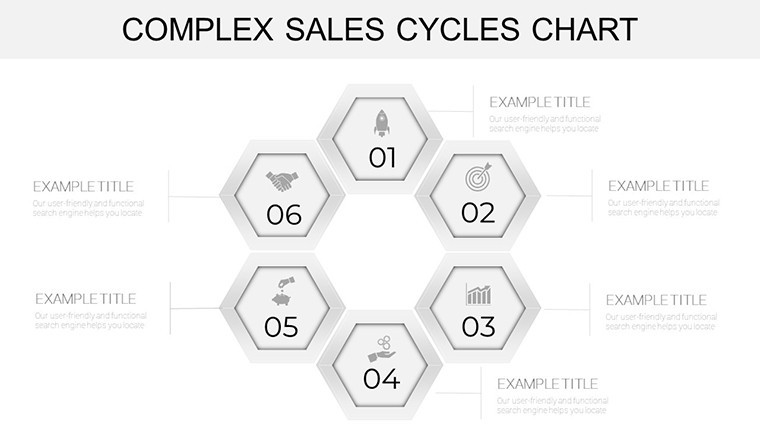
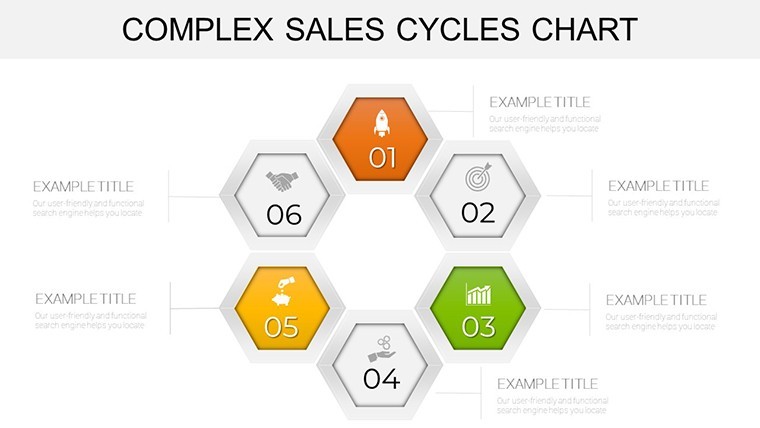
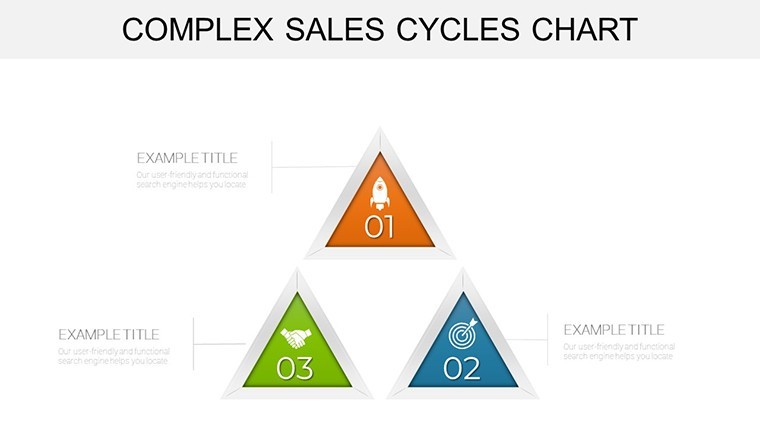
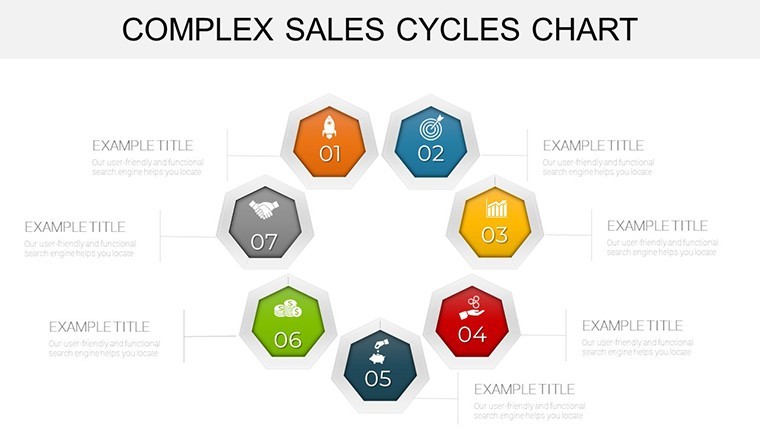
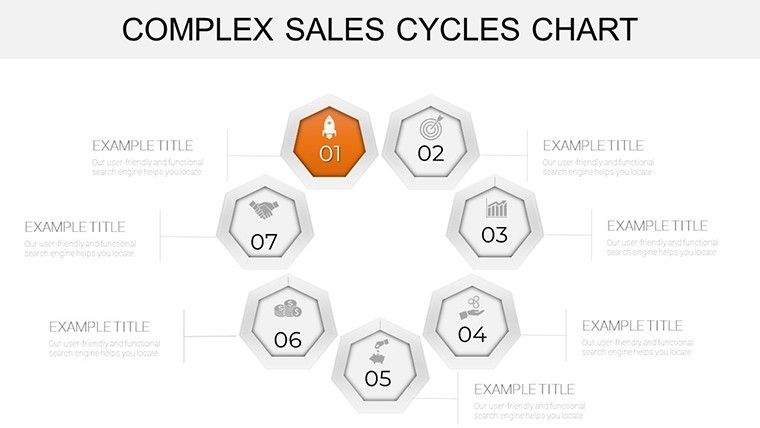
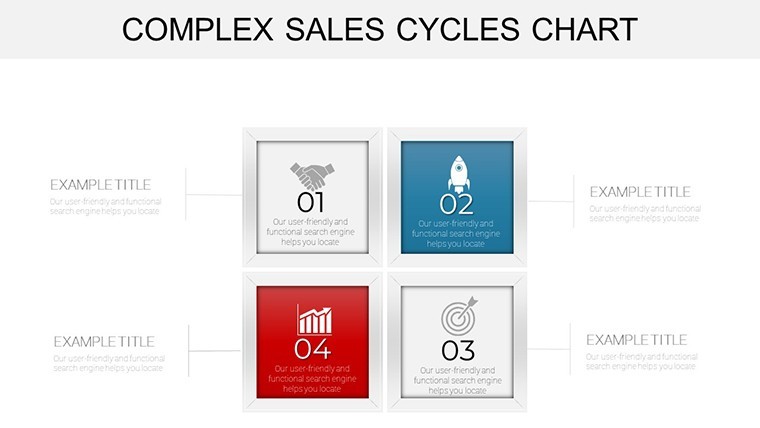
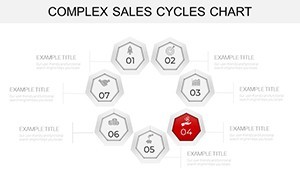
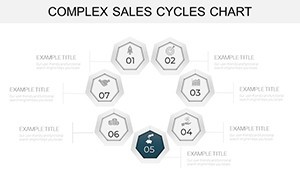
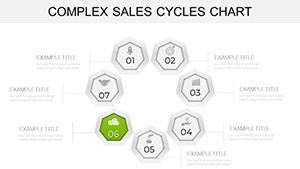
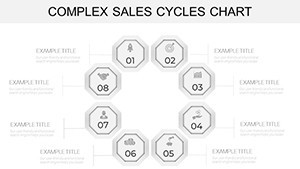
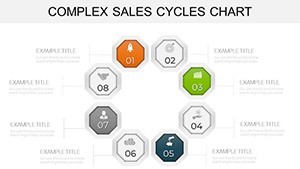
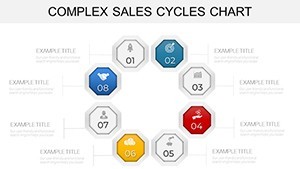
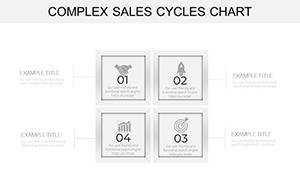
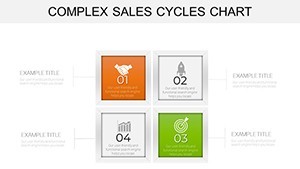
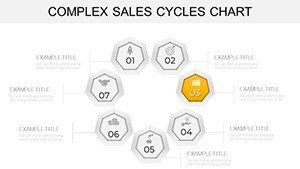
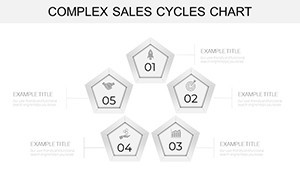
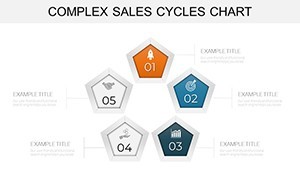
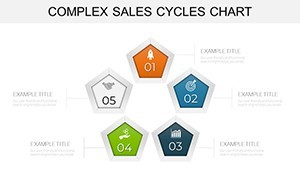
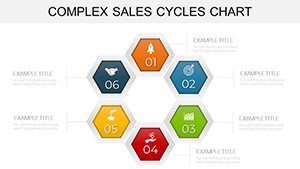
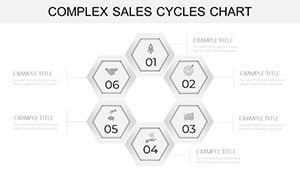
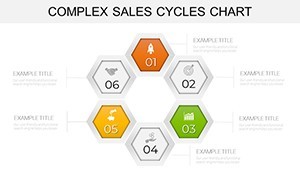
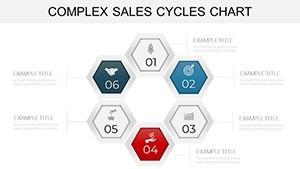
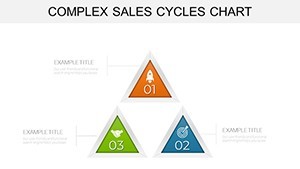
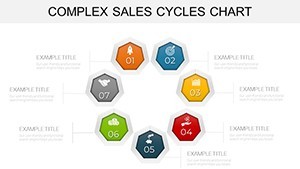
- Customizable Cycle Diagrams: Eight variations of circular and linear sales cycles, perfect for depicting lead generation through post-sale nurturing. Adjust spokes, add custom labels, or swap in your branding colors without losing alignment.
- Integrated Data Viz Tools: Pre-built bar graphs, pie charts, and heat maps that sync with your sales CRM data - think Salesforce exports visualized in seconds.
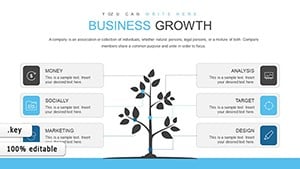
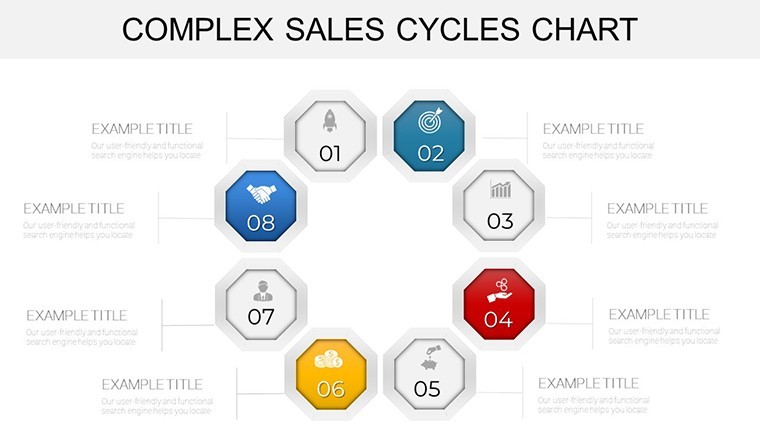
- Themed Icons Library: Over 50 sales-specific icons (handshakes, pipelines, targets) that add a professional polish, inspired by AIDA marketing models for maximum persuasion.
- Animation-Ready Transitions: Subtle build effects to reveal stages progressively, keeping audiences hooked during live pitches.
These aren't generic placeholders; they're informed by best practices from sales gurus like Jill Konrath, emphasizing clarity over clutter. For instance, slide 12's "Negotiation Nexus" chart uses layered arrows to illustrate objection-handling loops, a nod to complex enterprise sales where deals can span six months.
Seamless Compatibility and Editing Workflow
No more format frustrations - export to PowerPoint for Windows teams or Google Slides for collaborative edits. Our vector format preserves quality, and smart guides snap elements into place. Start by duplicating a master slide, input your KPIs via simple text fields, and preview animations with one click. Pro tip: Layer in hyperlinks to external resources, like your demo videos, for interactive presentations that stand out in competitive bids.
Real-World Applications: From Startups to Enterprises
Picture a SaaS startup closing a $500K deal: Use slide 5's "Prospect Pipeline" to map touchpoints, showing how email nurturing feeds into demo calls. Or, in a Fortune 500 finance firm, leverage the full 32 slides for an annual sales audit, where cycle time reductions are spotlighted with animated timelines - mirroring successes shared in McKinsey reports on sales efficiency.
- Lead Qualification Mastery: Slides 1-8 break down scoring models, helping reps prioritize hot leads with radial charts that highlight conversion probabilities.
- Deal Acceleration Tactics: Mid-template sections (9-20) feature Gantt-style cycles for forecasting close dates, integrating with tools like HubSpot for live data pulls.
- Post-Sale Retention Loops: Final slides focus on upsell cycles, with donut charts tracking churn risks - essential for subscription models.
In one case study from a tech consultancy, adopting similar visuals cut presentation prep time by 40%, freeing strategists for high-value client interactions. Adapt these for your niche: In real estate, visualize property flip cycles; in healthcare, map patient acquisition funnels. The versatility shines, always prioritizing user-focused design that solves pain points like information overload.
Expert Tips for Maximizing Impact
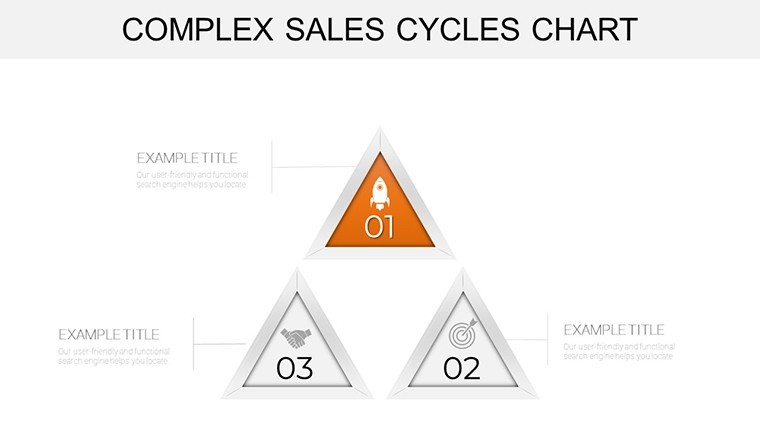
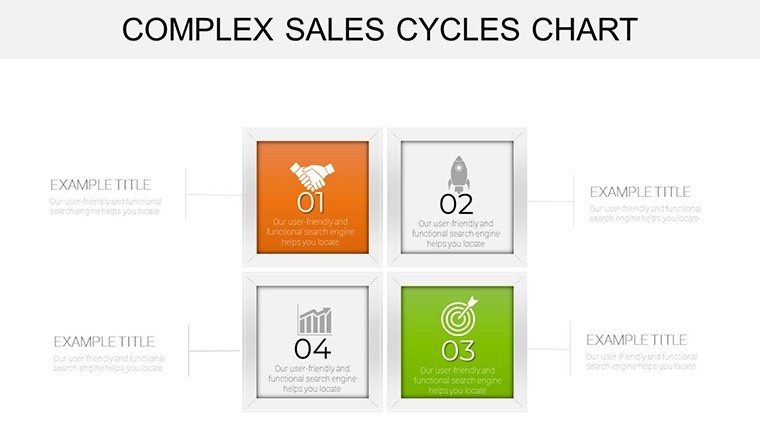
To elevate your delivery, pair charts with storytelling arcs - start with the "why" (market pain), build to the "how" (your cycle), and end with the "wow" (projected ROI). Use contrasting colors for stages (e.g., green for wins, amber for risks) to guide eyes intuitively. And remember, less is more: Trim text to 5 words per segment, letting visuals do the heavy lifting. This approach, rooted in Edward Tufte's data-ink ratio principles, ensures your Keynote deck doesn't just inform - it inspires action.
Why Choose This Template Over Basic Options?
Unlike stock PowerPoint cycles that feel dated, our template offers thematic depth with sales-specific motifs, saving you design hours. Competitors might boast more slides, but ours prioritize relevance - every element serves the sales narrative. Plus, with unlimited edits and lifetime access, it's a one-time investment yielding endless returns. Clients rave about the professional edge it provides, often tipping the scales in RFP responses.
Ready to streamline your sales storytelling? Download the Complex Sales Cycle Keynote Charts today and craft pitches that close deals faster. Or explore related templates for deeper customization.
Frequently Asked Questions
What makes these Keynote charts editable?
All elements, from shapes to data labels, are fully vector-based and unlocked, allowing drag-and-drop tweaks in Keynote or exported formats.
Can I use this for non-sales cycles?
Absolutely - adapt for marketing funnels, product development loops, or even HR onboarding processes with minimal adjustments.
Is it compatible with team collaboration tools?
Yes, seamless in Google Slides for real-time edits; PowerPoint exports maintain animations.
How many slides are included?
32 high-impact slides, expandable via duplication for longer decks.
What's the file format?
Native .key for Keynote, with easy exports to .pptx and Google Slides.