 Click to zoom
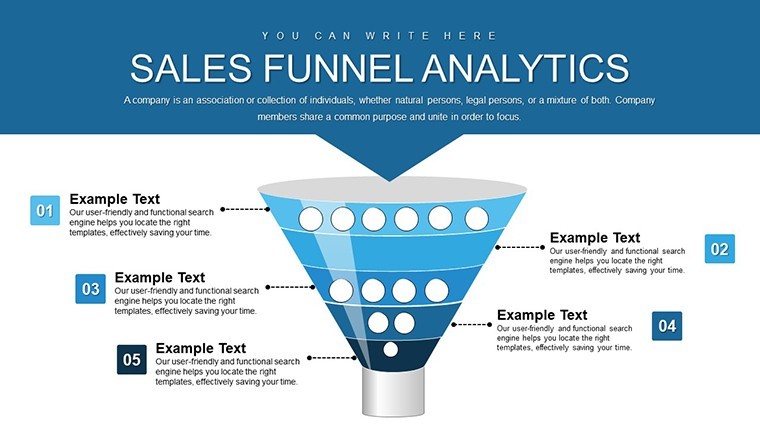
Sales Funnel Analytics Keynote Template: Drive Revenue Growth
| Format | .pptx |
| Slides | 26 unique layouts |
| Aspect ratio | 16:9 |
| Compatibility | PowerPoint |
| Animated | No |
| Language | English |
| License | Commercial |
| File size | — |
| Version | v1.0 |
| Last updated | May 2023 |
What's inside
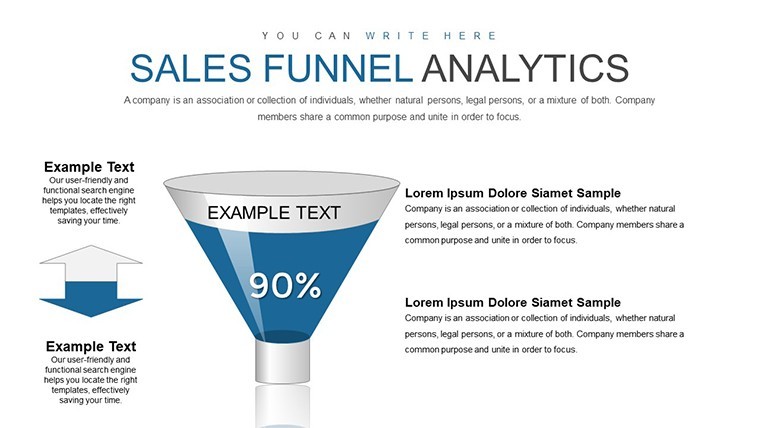
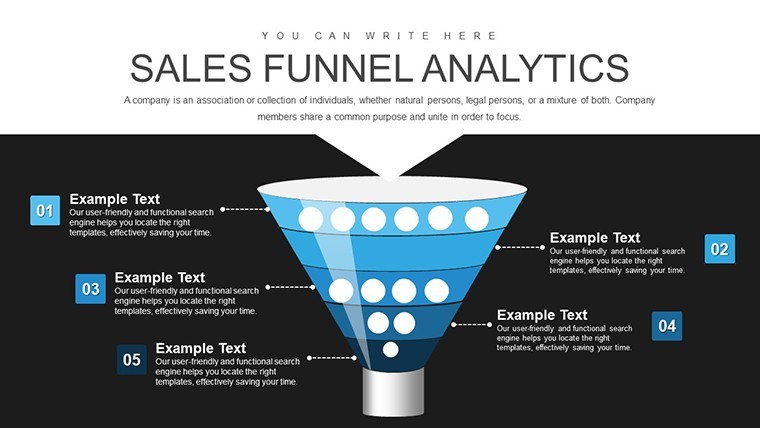
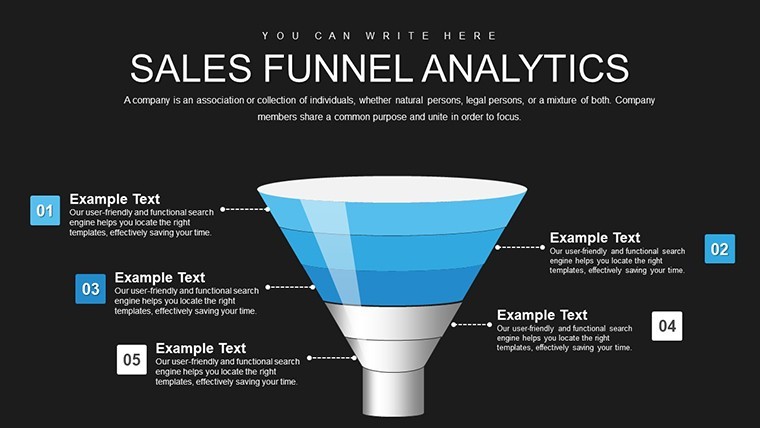
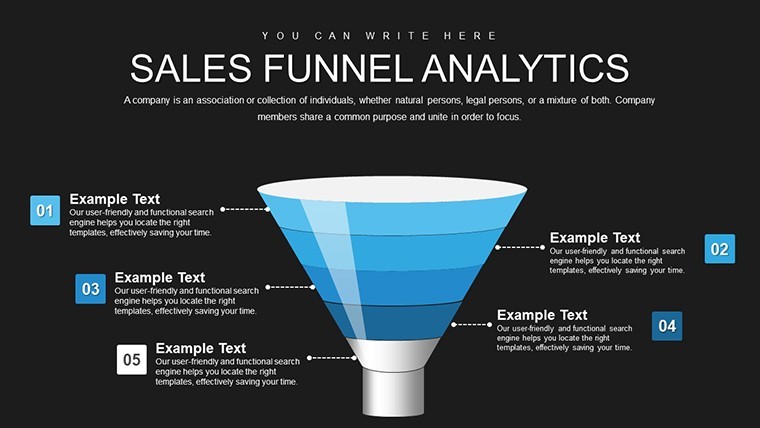
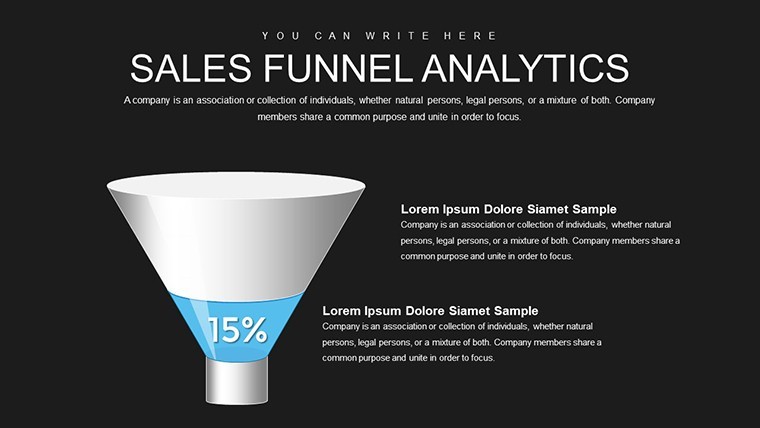
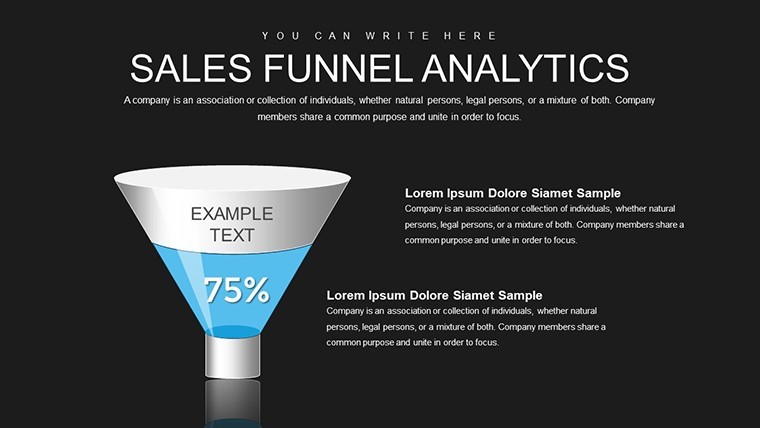
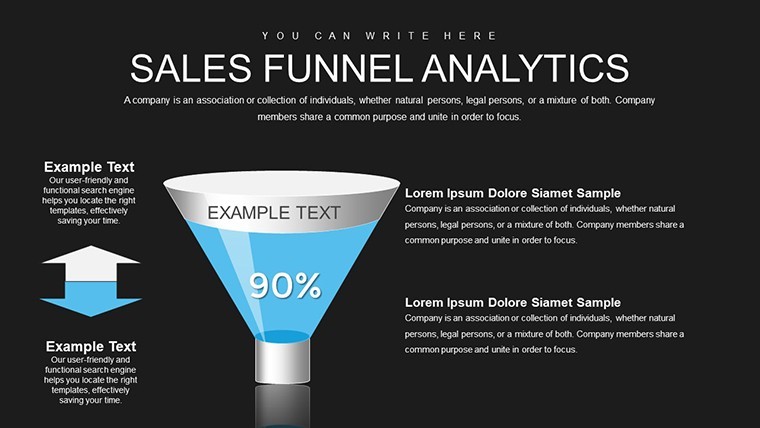
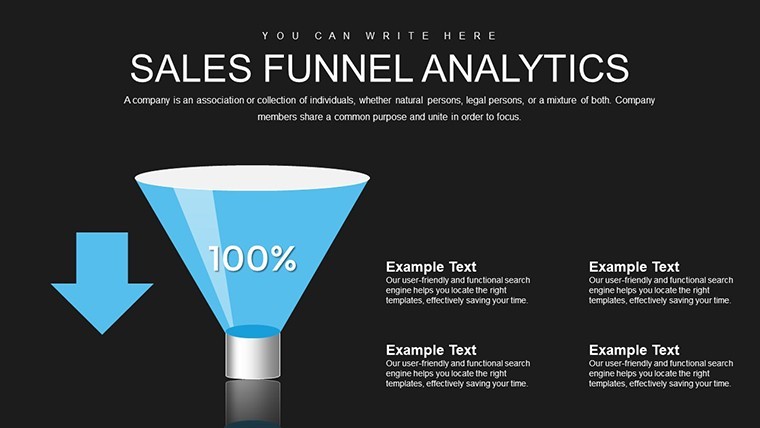
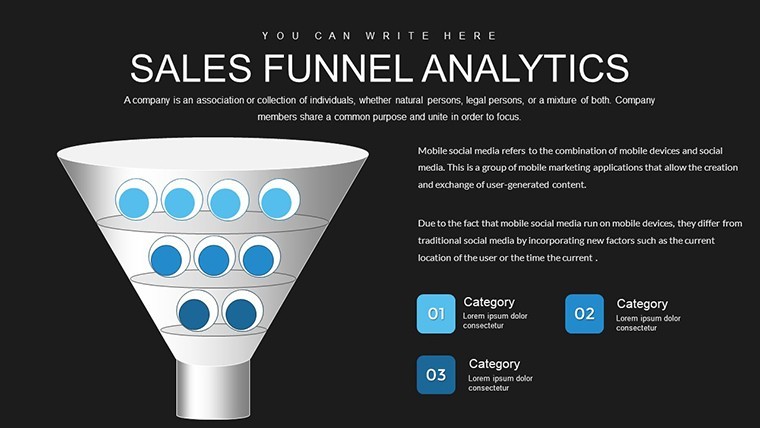
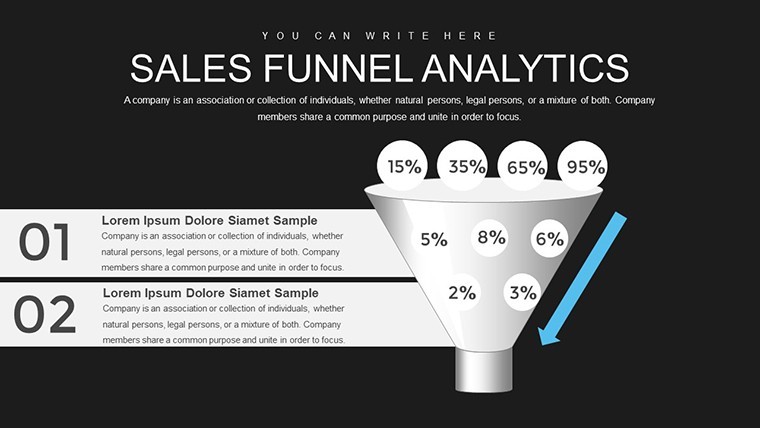
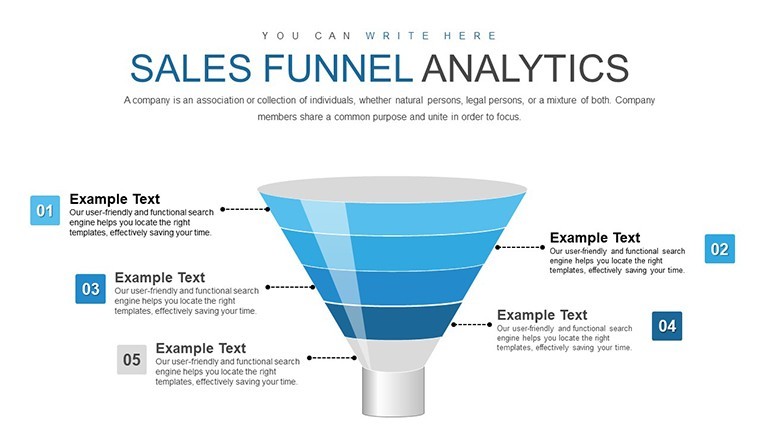
Imagine peering into your sales pipeline with crystal clarity, spotting leaks before they drain profits and amplifying strengths that convert leads to loyal customers. Our Sales Funnel Analytics Keynote template equips marketers and sales pros with 26 editable slides to do precisely that. Designed for data-savvy teams, it visualizes every stage from awareness to advocacy, helping you make informed tweaks that skyrocket performance. Whether refining e-commerce funnels or B2B pipelines, this tool turns metrics into meaningful narratives, backed by insights from sources like HubSpot's sales reports showing optimized funnels can increase closes by 25%.
User-friendly for all skill levels, it integrates with Keynote for seamless customization - adjust flows, colors, and data without coding. A sales manager might use it to present quarterly reviews, highlighting drop-offs and wins with engaging graphs.
Core Features for Funnel Mastery
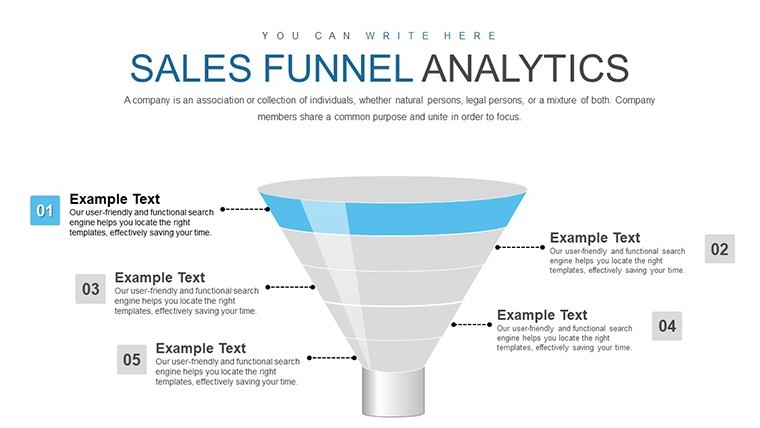
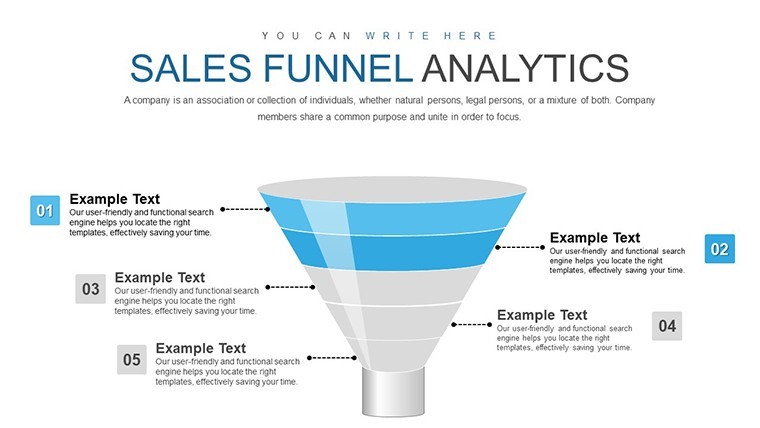
Packed with analytics-ready elements: staged diagrams, conversion rate trackers, and trend lines. Customize everything to your brand, ensuring professional polish.
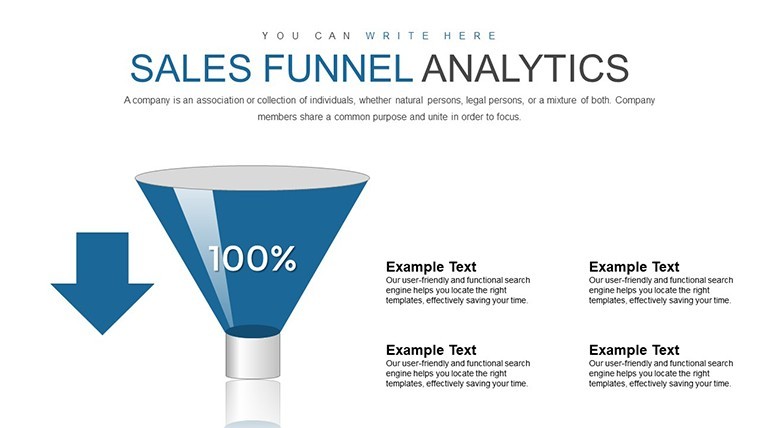
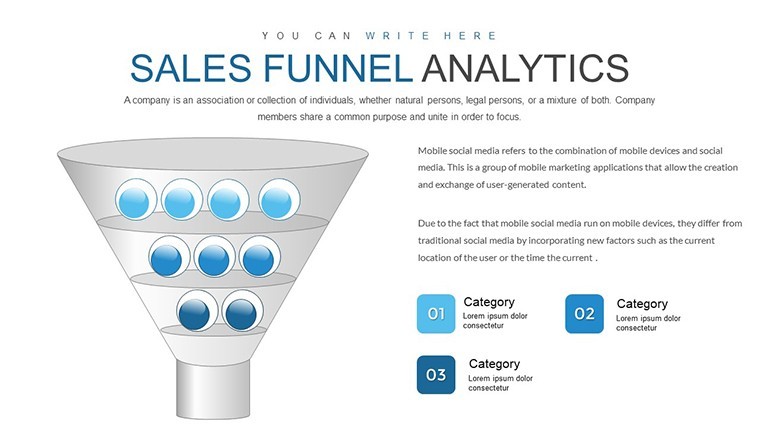
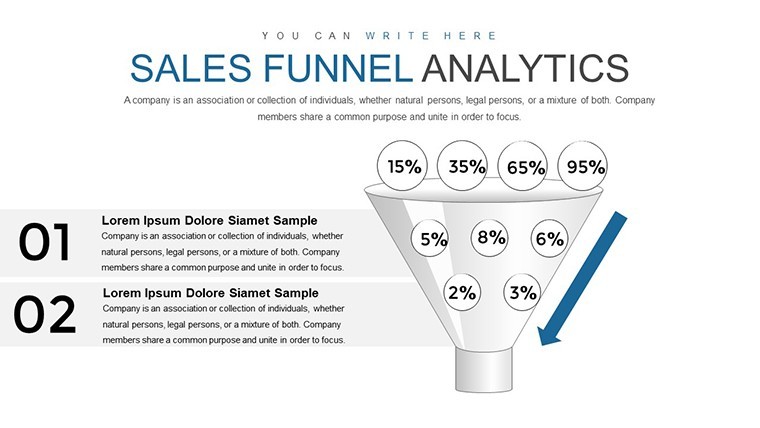
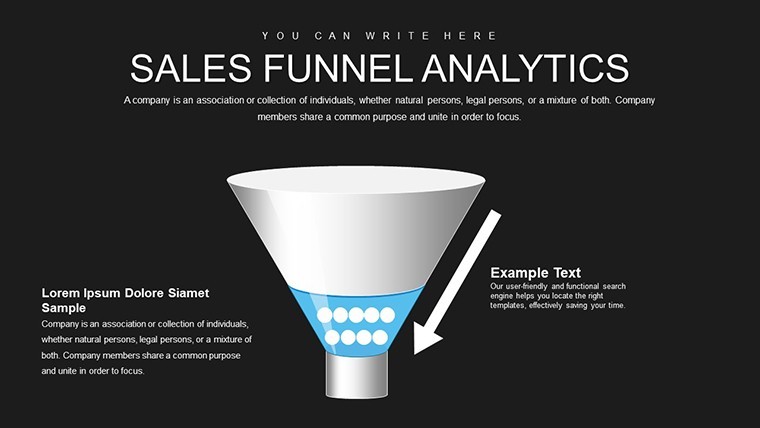
- Stage Visualizations: Flow charts mapping lead journeys with editable metrics.
- Data Integration: Plug in from CRM tools like Salesforce for real-time views.
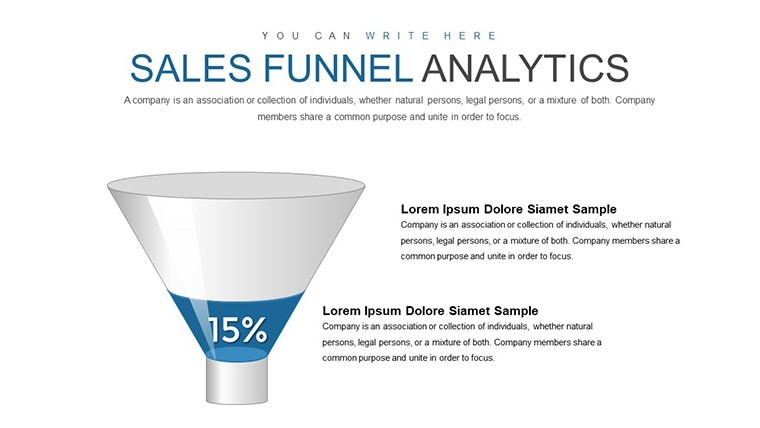
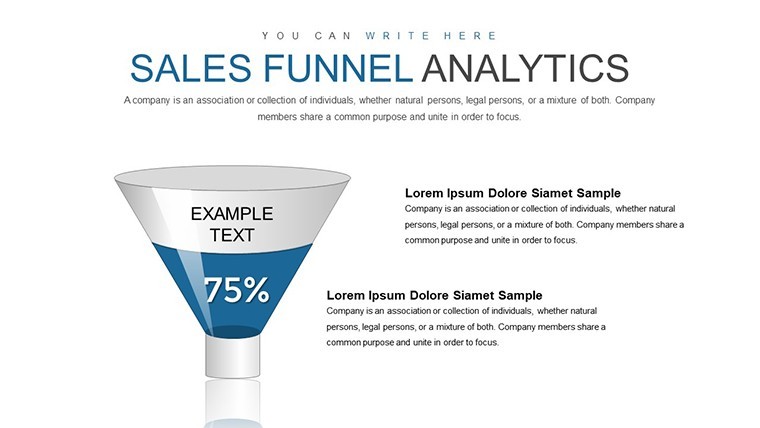
- Performance Metrics: Built-in KPIs for retention and conversion analysis.
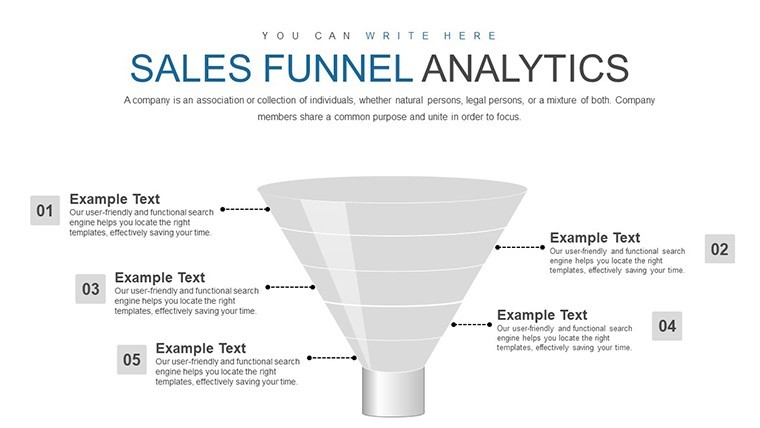
- Branding Flexibility: Fonts, palettes, and layouts tailored to your style.
Addresses pain points like hidden bottlenecks, similar to how architecture sales teams use funnels for project bids, aligning with AIA client engagement protocols.
Strategic Use Cases and Implementation
From startup pitches to enterprise audits, apply in marketing meetings or training. Case from Gartner: Funnel visuals aided a firm in doubling leads.
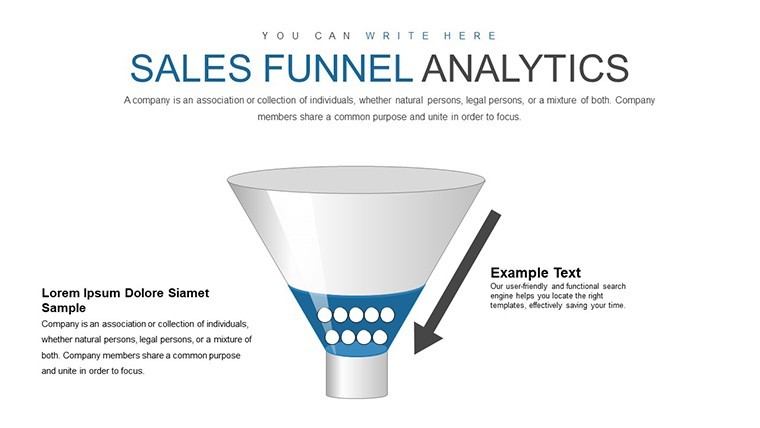
Step-by-step optimization: Slide 4 for awareness metrics. Slide 11 for mid-funnel analysis. Slide 22 for post-sale retention. This builds compelling stories.
- Collect funnel data from analytics.
- Populate slides with figures.
- Customize visuals for impact.
- Analyze trends and adjust.
- Present insights to drive action.
Better than stock charts, it offers depth, slashing analysis time. Tips: Use A/B test visuals, ensure mobile responsiveness, integrate with Google Analytics.
Expert Optimization Strategies
Layer with heat maps for engagement, draw from SEMrush data for benchmark comparisons, enhancing in your strategies.
Amplify Your Sales Potential
This template fuels growth, with users praising its role in revenue boosts. Ignite your funnel - unlock analytics power now.
Frequently Asked Questions
How customizable are the funnels? Completely - edit stages, data, and designs freely.
Supports real-time data? Yes, link to live sources for updates.
Suitable for small businesses? Ideal, scalable from startups to corps.
Includes conversion tips? Embedded notes for best practices.
What about team collaboration? Keynote sharing for group edits.
Good for
- Project roadmaps and sprint plans
- Product launch timelines
- Quarterly or annual review decks
- Company history and milestone summaries
Licence
reviews
Some text spacing needed fixing before presenting.
Used only half the slides but still worth it.
Good template for rushed office work.
The charts were simple enough for my finance presentation.
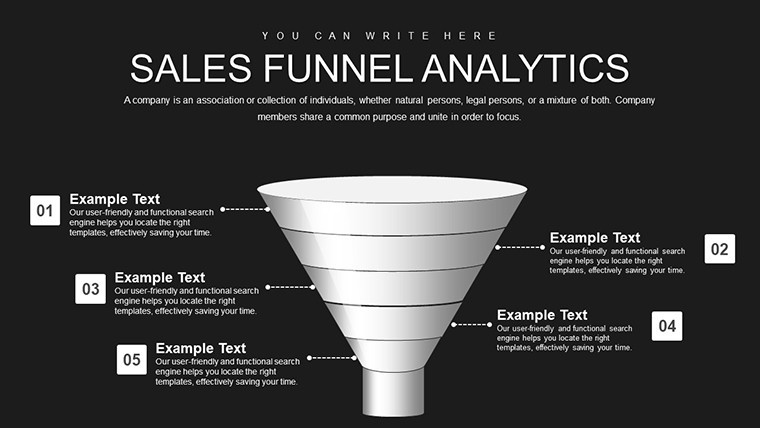
I liked the dark style more than expected.
FAQ
Will it work in Google Slides?
Are fonts embedded?
Can I use this for client work?
What's the refund policy?
Do you update the template after purchase?
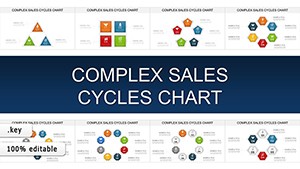
Similar templates
See all Keynote Charts →
All 26 slides