Tree Keynote Charts
Visualizing hierarchies, decision paths, and organizational structures becomes effortless with our tree chart templates for Keynote. Whether you're mapping out company org charts, illustrating decision-making processes, or presenting family trees and taxonomy diagrams, these professionally designed templates help you communicate complex relationships clearly and beautifully.
Each template is fully editable in Keynote, allowing you to customize colors, adjust branch layouts, add or remove nodes, and match your brand identity in minutes. Say goodbye to starting from scratch—our tree diagrams are built for professionals who need polished visuals without the design hassle.
 (1003)
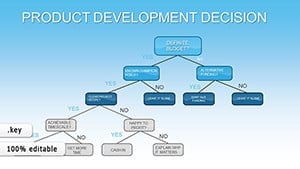
 Product Development Decision Keynote Charts: Branch Out Ideas with Tree VisualsID: #KC00836$12.00
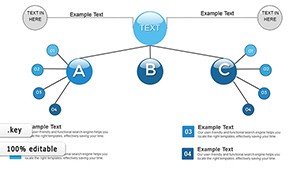 (107)
(107) Organizations Work Keynote Charts: Streamline CoordinationID: #KC00820$15.00
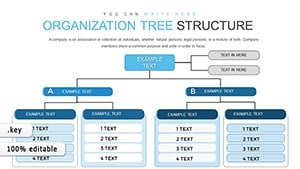 (1013)
Organization Tree Keynote Charts: Visualize Hierarchies EffortlesslyID: #KC00819$16.00
(1013)
Organization Tree Keynote Charts: Visualize Hierarchies EffortlesslyID: #KC00819$16.00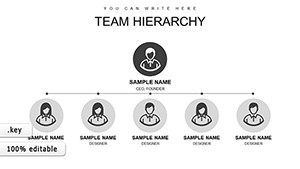 (943)
(943) Hierarchy Organizational Structure Keynote Charts TemplateID: #KC00741$18.00
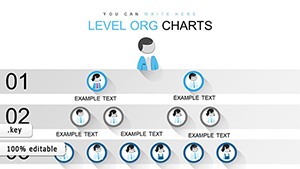 (705)
Free Organizational Keynote Chart Template: Structure Your Success VisuallyID: #KC00635free
(705)
Free Organizational Keynote Chart Template: Structure Your Success VisuallyID: #KC00635free (332)
(332) Interrelationships Between Factors Keynote Charts: Map Connections EffortlesslyID: #KC00596$16.00
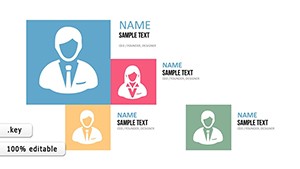 (360)
Animations Smart Keynote Charts: Dynamic Presentations UnleashedID: #KC00481$16.00
(360)
Animations Smart Keynote Charts: Dynamic Presentations UnleashedID: #KC00481$16.00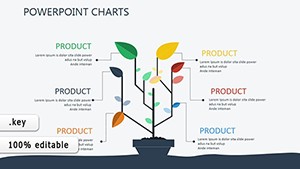 (923)
Technical Analysis Keynote Charts TemplateID: #KC00386$18.00
(923)
Technical Analysis Keynote Charts TemplateID: #KC00386$18.00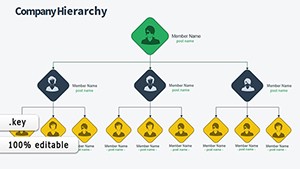 (432)
Master Organizational Flow with Animated Structure Keynote ChartsID: #KC00338$17.00
(432)
Master Organizational Flow with Animated Structure Keynote ChartsID: #KC00338$17.00
Why Tree Charts Transform Your Presentations
Tree diagrams are among the most effective ways to display hierarchical information. Unlike linear lists or dense paragraphs, tree structures show parent - child relationships instantly, making them invaluable for business analysis, educational content, and strategic planning. When your audience can see the entire structure at a glance - from the root concept down to individual branches - comprehension and retention skyrocket.
Our Keynote tree chart templates come pre - designed with balanced layouts, professional color schemes, and clear visual hierarchy. You`ll find options for vertical trees, horizontal trees, radial designs, and multi - level structures that accommodate everything from simple three - tier org charts to complex decision trees with dozens of nodes.
Real - World Applications Across Industries
Business & Corporate Use
Corporate teams rely on tree charts for organizational restructuring presentations, departmental hierarchies, and reporting structures. HR departments use them during onboarding to show new employees where they fit within the company. Project managers map out work breakdown structures to show how large initiatives decompose into manageable tasks.
Strategic Planning & Decision Making
Decision tree templates help executives visualize choice points and potential outcomes. Map multiple scenarios, calculate probability branches, and present risk assessments with clarity. Strategy consultants use these diagrams to show clients how different business decisions cascade through their organizations.
Education & Training
Teachers and trainers use tree diagrams to illustrate biological classifications, grammatical sentence structures, historical lineages, and conceptual frameworks. Students grasp relationships between topics more quickly when information is organized visually rather than presented in text - heavy slides.
Technology & IT
Software architects present system hierarchies, file directory structures, and database schemas using tree charts. Network administrators map infrastructure dependencies. Product teams show feature breakdowns and user journey paths with branching logic.
Key Benefits Over Default Keynote Shapes
Building tree diagrams from scratch in Keynote using basic shapes and connectors is time - consuming and often results in misaligned elements and inconsistent styling. Our templates solve these problems:
- Perfect alignment: All nodes and connecting lines are precisely positioned for professional appearance
- Consistent spacing: Uniform distances between levels and branches create visual harmony
- Professional typography: Font choices, sizes, and weights are optimized for readability
- Color coordination: Pre - selected palettes that work together and print well
- Scalable designs: Easily add or remove branches while maintaining structure
- Multiple styles: Choose from minimalist, corporate, creative, or infographic aesthetics
Design Tips for Maximum Impact
Keep It Focused
Resist the urge to include every possible detail. The most effective tree charts show 3 - 5 levels maximum. If your structure is more complex, consider creating multiple slides that zoom into specific branches or use progressive disclosure where you reveal deeper levels one at a time.
Use Color Strategically
Color - code branches by department, category, or priority level. This adds an extra dimension of information without cluttering your diagram. For example, use warm colors for revenue - generating departments and cool colors for support functions, or assign unique colors to each major branch to help audiences track relationships.
Emphasize Key Paths
When presenting decision trees or process flows, highlight the recommended path or most common route with bolder lines, brighter colors, or subtle animations. This guides your audience`s attention to the most important information while keeping context visible.
Add Icons for Visual Interest
Small icons next to node labels increase visual appeal and aid quick recognition. A dollar sign for financial branches, person icons for personnel, gears for processes - these subtle touches make your tree charts more engaging and easier to scan.
Customization Made Simple
Every template is built with Keynote`s native tools, meaning you don`t need special plugins or design software. Select any node to change its color, double - click to edit text, drag to reposition elements, and duplicate branches to expand your tree. Group related elements to move entire sections together while maintaining alignment.
Need to match your company colors? Simply select all elements and apply your brand palette. Want to change fonts? Use Keynote`s format panel to update typography across your entire diagram in seconds. The templates are designed to be flexible while maintaining their professional structure.
Get Started Today
Browse our collection of tree chart templates and find the perfect starting point for your next presentation. Whether you`re presenting to executives, teaching a class, or documenting processes, these templates will save you hours of design work while ensuring your message is communicated with clarity and visual impact. Download your favorites and start building better presentations today.
Frequently Asked Questions
- Can I add more branches to these tree chart templates?
- Yes, all templates are fully editable. Simply duplicate existing nodes and connectors, then reposition them to expand your tree structure. The templates are designed to maintain alignment as you add elements.
- Do these templates work on iPad and iPhone versions of Keynote?
- Absolutely. Our templates are compatible with Keynote on Mac, iPad, and iPhone. You can edit them on any device where Keynote is installed, though complex editing is easier on larger screens.
- What`s the difference between horizontal and vertical tree layouts?
- Vertical trees flow from top to bottom and work well for organizational charts and hierarchies. Horizontal trees flow left to right, which is ideal for timelines, decision processes, and when you have wide rather than tall content.
- Can I animate tree charts to reveal branches progressively?
- Yes, use Keynote`s build animations to reveal your tree level by level or branch by branch. This is particularly effective for complex structures where showing everything at once might overwhelm your audience.
- Are these templates suitable for printing or only presentations?
- Our tree chart templates work beautifully in both contexts. They`re designed with print - friendly colors and sufficient contrast to ensure clarity whether displayed on screen or printed in reports and handouts.