Medicine - Pharma Keynote Charts
Medicine Keynote Charts Templates assist medical professionals in creating visually appealing, data-rich presentations. With customizable layouts and a clean, modern design, these templates simplify the process of illustrating complex medical data and ideas.
 (16)
(16) Cardiology and Healthcare Charts Template for KeynoteID: #KC01061$22.00
 (13)
(13) Medical 3D DNA Charts Keynote Template: Revolutionize Your Genetics PresentationsID: #KC01053$24.00
 (10)
Education Presentations with Chemical Molecules Charts - Keynote Template for Scientific and Academic UseID: #KC01050$18.00
(10)
Education Presentations with Chemical Molecules Charts - Keynote Template for Scientific and Academic UseID: #KC01050$18.00 (11)
Biomedical Charts Keynote Template for ScienceID: #KC01049$15.00
(11)
Biomedical Charts Keynote Template for ScienceID: #KC01049$15.00 (11)
Medical Charts Keynote Template - Editable Healthcare InfographicsID: #KC01045$20.00
(11)
Medical Charts Keynote Template - Editable Healthcare InfographicsID: #KC01045$20.00 (14)
Microbiology Keynote Charts TemplateID: #KC01044$22.00
(14)
Microbiology Keynote Charts TemplateID: #KC01044$22.00 (13)
Medical Science Charts Template for Keynote PresentationID: #KC01040$20.00
(13)
Medical Science Charts Template for Keynote PresentationID: #KC01040$20.00 (12)
Dental Charts Keynote Template: Illuminate Oral Health InsightsID: #KC01034$22.00
(12)
Dental Charts Keynote Template: Illuminate Oral Health InsightsID: #KC01034$22.00 (272)
Professional Dental Implant Charts Keynote TemplateID: #KC01025$24.00
(272)
Professional Dental Implant Charts Keynote TemplateID: #KC01025$24.00 (49)
Medicine DNA Genome Keynote Charts: Empower Genomic NarrativesID: #KC01016$22.00
(49)
Medicine DNA Genome Keynote Charts: Empower Genomic NarrativesID: #KC01016$22.00 (841)
(841) Spa Procedures Keynote Charts: Revitalize Your Wellness TalksID: #KC01015$22.00
 (293)
(293) Spa Pedicure Treatment Keynote Charts PresentationID: #KC01012$23.00
 (389)
Spa Treatments Keynote Charts for Spa PresentationID: #KC01011$25.00
(389)
Spa Treatments Keynote Charts for Spa PresentationID: #KC01011$25.00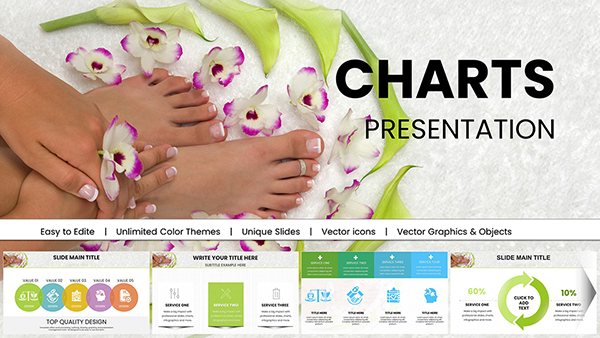 (550)
SPA Foot Charts for Keynote PresentationID: #KC01010$22.00
(550)
SPA Foot Charts for Keynote PresentationID: #KC01010$22.00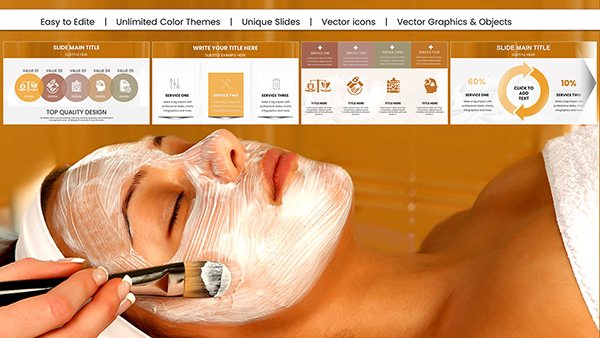 (1125)
DIY Face Mask Spa Charts for Keynote: Beauty & Wellness MasteryID: #KC01005$25.00
(1125)
DIY Face Mask Spa Charts for Keynote: Beauty & Wellness MasteryID: #KC01005$25.00 (522)
Design Automatic Tonometer Keynote Charts Template: Illuminate Eye Health DataID: #KC00978$18.00
(522)
Design Automatic Tonometer Keynote Charts Template: Illuminate Eye Health DataID: #KC00978$18.00 (445)
Pill Pharmaceutical Medical Keynote Charts Template: Master Drug Data StorytellingID: #KC00977$18.00
(445)
Pill Pharmaceutical Medical Keynote Charts Template: Master Drug Data StorytellingID: #KC00977$18.00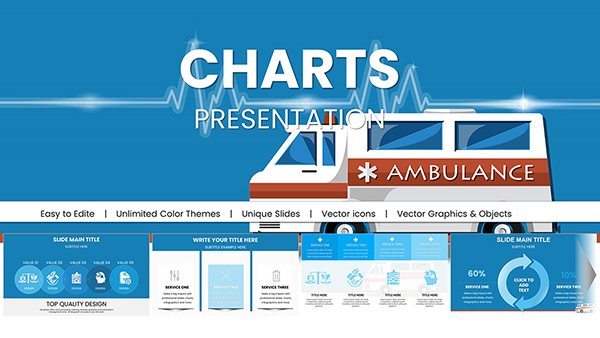 (130)
Design Ambulance Keynote Charts Template: Revolutionize Your Medical VisualsID: #KC00975$18.00
(130)
Design Ambulance Keynote Charts Template: Revolutionize Your Medical VisualsID: #KC00975$18.00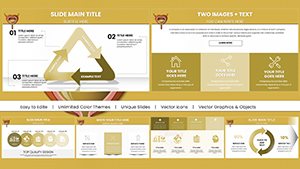 (680)
Urinary System Keynote Charts Template - Fully Editable | Instant DownloadID: #KC00963$16.00
(680)
Urinary System Keynote Charts Template - Fully Editable | Instant DownloadID: #KC00963$16.00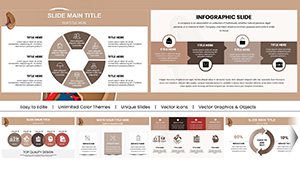 (533)
Spleen and Blood Cell Keynote Charts for MedicineID: #KC00962$18.00
(533)
Spleen and Blood Cell Keynote Charts for MedicineID: #KC00962$18.00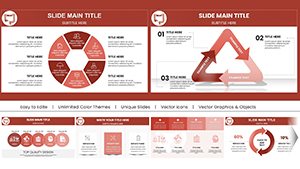 (661)
Large Intestine Keynote Charts Template: Illuminate Anatomical InsightsID: #KC00961$18.00
(661)
Large Intestine Keynote Charts Template: Illuminate Anatomical InsightsID: #KC00961$18.00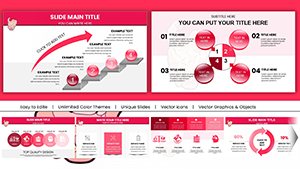 (124)
Small Intestine Medical Keynote Charts TemplateID: #KC00960$18.00
(124)
Small Intestine Medical Keynote Charts TemplateID: #KC00960$18.00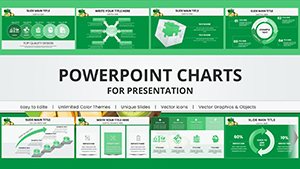 (140)
Vitamin K Keynote Charts Template: Unlock Nutritional InsightsID: #KC00956$20.00
(140)
Vitamin K Keynote Charts Template: Unlock Nutritional InsightsID: #KC00956$20.00 (32)
Foods Vitamin E Keynote Charts Template: Antioxidant Power in VisualsID: #KC00955$20.00
(32)
Foods Vitamin E Keynote Charts Template: Antioxidant Power in VisualsID: #KC00955$20.00 (5)
Nutritious Foods Vitamin D Keynote Charts: Sunshine Nutrient VisualizedID: #KC00954$20.00
(5)
Nutritious Foods Vitamin D Keynote Charts: Sunshine Nutrient VisualizedID: #KC00954$20.00 (1198)
Vitamin C Supplements Keynote Charts Template: Energize Your Immune NarrativesID: #KC00953$20.00
(1198)
Vitamin C Supplements Keynote Charts Template: Energize Your Immune NarrativesID: #KC00953$20.00 (794)
Vitamin B Benefits Keynote Charts TemplateID: #KC00952$20.00
(794)
Vitamin B Benefits Keynote Charts TemplateID: #KC00952$20.00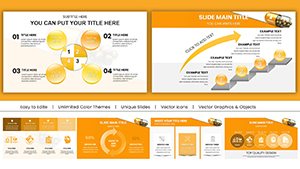 (923)
Vitamin A and Mineral Supplements Keynote ChartsID: #KC00951$20.00
(923)
Vitamin A and Mineral Supplements Keynote ChartsID: #KC00951$20.00 (874)
Vitamin A and Carotenoids Keynote Charts TemplateID: #KC00950$20.00
(874)
Vitamin A and Carotenoids Keynote Charts TemplateID: #KC00950$20.00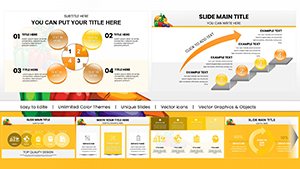 (6)
Vitamin A and Carotenoids Keynote Charts for HealthID: #KC00949$20.00
(6)
Vitamin A and Carotenoids Keynote Charts for HealthID: #KC00949$20.00 (291)
Brain Five Senses Keynote Charts TemplateID: #KC00948$18.00
(291)
Brain Five Senses Keynote Charts TemplateID: #KC00948$18.00 (1096)
Healthy Food Keynote Charts Template - Fully Editable | Instant DownloadID: #KC00946$18.00
(1096)
Healthy Food Keynote Charts Template - Fully Editable | Instant DownloadID: #KC00946$18.00 (730)
Health Food Infographic Keynote Charts: Captivate Audiences with Nutritious VisualsID: #KC00881$15.00
(730)
Health Food Infographic Keynote Charts: Captivate Audiences with Nutritious VisualsID: #KC00881$15.00
What are Medicine Keynote Chart Templates?
Medicine Keynote Chart Templates are pre-designed slide templates tailored for medical presentations. They include pie charts, bar graphs, line graphs, and flowcharts - making them ideal for displaying clinical data, research results, treatment outcomes, and more. Healthcare providers, educators, students, and researchers use them to enhance communication and data visualization.
Advantages of Using Medicine Keynote Chart Templates
- Time Efficiency: Save time with ready-to-use designs focused on medical topics.
- Professionalism: High-quality visuals enhance credibility and engagement.
- Uniformity: Consistent visual language throughout the presentation.
- Customization: Easily modify colors, fonts, and layouts to match your needs.
- Clarity: Well-structured visuals improve comprehension of complex information.
Types of Medicine Keynote Chart Templates
- Epidemiological Charts: Visualize disease incidence, prevalence, and distribution.
- Clinical Trial Charts: Present data on study populations, outcomes, and safety metrics.
- Patient Care Charts: Track recovery rates, satisfaction, and treatment performance.
- Pharmacological Charts: Illustrate medication effectiveness, dosage, and side effects.
- Diagnostic Charts: Show test results, differential diagnoses, and diagnostic flows.
- Financial Charts: Present healthcare costs, resource allocation, and budgeting data.
Application of Medicine Keynote Templates
- Medical Conferences: Share clinical data and research findings.
- Hospital Meetings: Visualize patient care metrics and administrative insights.
- Educational Seminars: Explain medical concepts with clarity using visual aids.
- Public Health Campaigns: Present statistics about vaccination, epidemics, and awareness.
- Patient Consultations: Simplify complex data for patients using easy-to-read visuals.
Who Should Use Medicine Keynote Chart Templates?
- Doctors, Nurses & Healthcare Administrators: Convey treatment data and progress.
- Researchers: Showcase study results in scientific and clinical presentations.
- Medical Educators & Students: Teach and learn with enhanced visual storytelling.
- Public Health Officials: Present statistics and health trends to communities.
- Pharmaceutical Companies: Communicate drug data, research, and safety information.
User Reviews
Users consistently praise these templates for their ease of use, visual appeal, and adaptability. Professionals appreciate how easily they can tailor slides to specific audiences, while students benefit from clearer and more engaging content. These templates greatly enhance both clarity and effectiveness in medical presentations.
In summary, Medicine Keynote Chart Templates are essential for creating compelling, data-driven medical presentations, whether for clinical, academic, or professional use.
FAQ - Medicine Keynote Charts Templates
- What are Medicine Keynote Chart Templates?
These are pre-built slide layouts designed for medical data visualization, including graphs, charts, and diagrams. - Why use Medicine Keynote Templates?
They save time, improve professionalism, and present complex data in a structured, clear way. - What chart types are typically included?
Pie charts, bar graphs, line charts, flowcharts, histograms, and data process visuals. - Are these templates customizable?
Yes. You can modify layouts, colors, text, and chart types to fit your topic and branding. - How do they improve communication?
They visually simplify complex medical topics, making it easier for the audience to understand and retain information.