Discover our collection of Organizational Keynote Charts Templates, designed to help you create professional presentations with ease. These customizable templates feature diverse layouts, including hierarchies, flowcharts, and matrix charts, to clearly showcase your company's structure. Tailor each template to your brand with flexible data fields, colors, and fonts. Whether you`re a business leader, HR professional, or educator, our free and premium Keynote templates save time and deliver polished results.


Organizational Keynote Chart Templates are pre-designed slides for Apple`s Keynote presentation software. They help you visualize organizational structures, including hierarchies, roles, and relationships. These templates feature layouts like flowcharts, org charts, and matrix diagrams, customizable to fit your needs. Perfect for businesses, educators, and non-profits, they simplify complex information for clear, professional presentations.
Using these templates saves time and enhances your presentations. Here`s why they`re a game-changer:
Our collection offers various layouts to suit different needs:
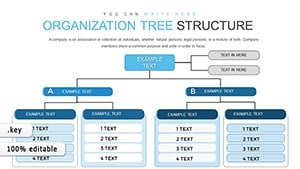
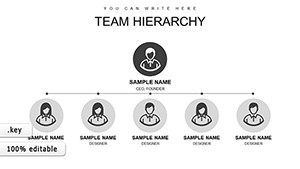
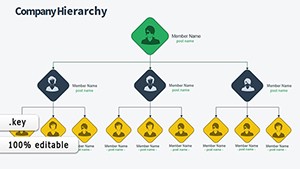
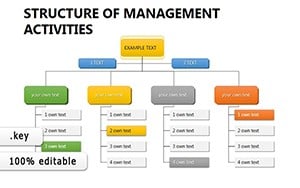
Show the chain of command, from executives to teams, with clear vertical structures.
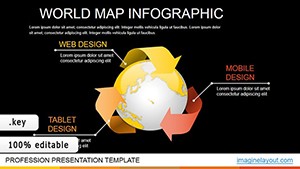
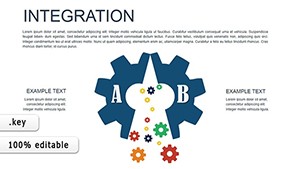
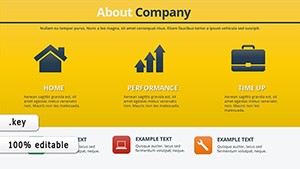
Illustrate processes or workflows alongside organizational roles.
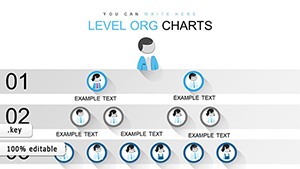
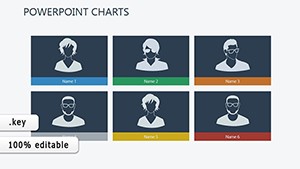
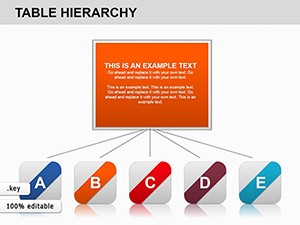
Display complex reporting lines across multiple departments.
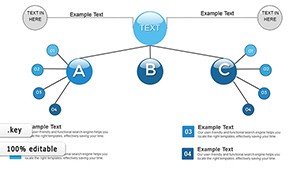
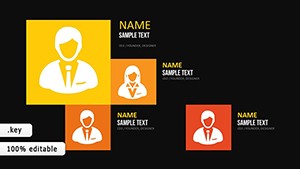
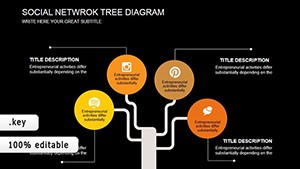
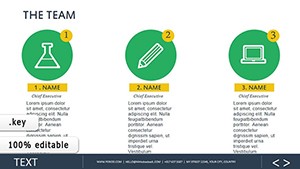
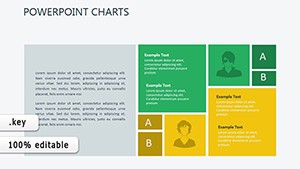
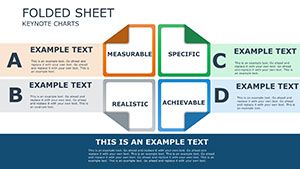
Highlight collaborative or project-based team structures.
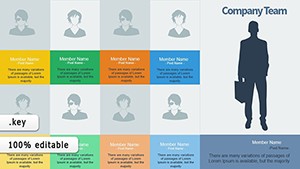
Emphasize egalitarian or team-focused organizational models.
Personalizing your Keynote charts is easy. Follow these steps:
Pro Tip: Save your customized template as a master slide for future use, ensuring consistency across presentations.
These templates are versatile for various scenarios:
These templates are ideal for:
Here`s what users say about our templates:
Our templates stand out because:
Copyright © 2009-2025 ImagineLayout All rights reserved.