World PowerPoint Maps
Formerly known as World PowerPoint Maps Templates - this collection now covers editable world map slides in PowerPoint and Google Slides for global business storytelling.
This collection delivers layered vector maps ready for immediate use in corporate decks. It is for strategy directors, consultants, and C-suite teams who present international performance metrics, expansion roadmaps, or risk assessments - the exact moments when a clean geographic visual carries half the argument.
Picture the regional operations lead pulling together the quarterly global review for the board with only 48 hours left. Instead of piecing together public domain outlines and fighting inconsistent scaling, these templates provide pre-grouped continents and countries with built-in placeholders for data callouts and color-coded regions. The structure is already there; you focus on the story.
Browse the collection and download the map layout that matches your next global update.
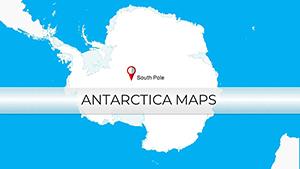 (703)
(703) Antarctica PowerPoint Maps Template: Unveil Polar SecretsID: #PM00226$15.00
 (613)
(613) PowerPoint World Maps TemplateID: #PM00172$30.00
 (746)
(746) Editable World Maps PowerPoint TemplateID: #PM00171$30.00
 (1038)
Global Market Maps PowerPoint Template: Chart Your Worldwide VisionID: #PM00170$25.00
(1038)
Global Market Maps PowerPoint Template: Chart Your Worldwide VisionID: #PM00170$25.00 (681)
(681) World Country Maps PowerPoint Template: Unlock Global InsightsID: #PM00169$26.00
 (788)
World Country Maps PowerPoint Template - EnhanceID: #PM00168$26.00
(788)
World Country Maps PowerPoint Template - EnhanceID: #PM00168$26.00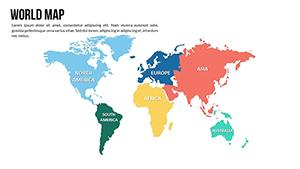 (1085)
Editable World Map PowerPoint TemplateID: #PM00167$25.00
(1085)
Editable World Map PowerPoint TemplateID: #PM00167$25.00 (773)
PowerPoint Maps Template for Global DataID: #PM00164$20.00
(773)
PowerPoint Maps Template for Global DataID: #PM00164$20.00 (150)
World Map PowerPoint Template Download Editable SlidesID: #PM00163$20.00
(150)
World Map PowerPoint Template Download Editable SlidesID: #PM00163$20.00 (792)
World Countries PowerPoint Maps: Download PPTID: #PM00162$20.00
(792)
World Countries PowerPoint Maps: Download PPTID: #PM00162$20.00 (469)
Business Maps of the World for PowerPoint - Editable PPT TemplatesID: #PM00161$20.00
(469)
Business Maps of the World for PowerPoint - Editable PPT TemplatesID: #PM00161$20.00 (117)
World Global PowerPoint Maps: 18 Editable SlidesID: #PM00160$30.00
(117)
World Global PowerPoint Maps: 18 Editable SlidesID: #PM00160$30.00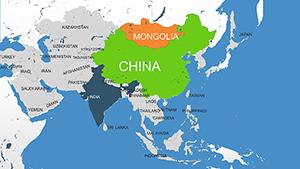 (1181)
Asia Countries PowerPoint Maps: Quick PPT DownloadID: #PM00159$16.00
(1181)
Asia Countries PowerPoint Maps: Quick PPT DownloadID: #PM00159$16.00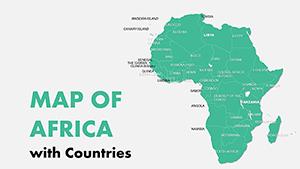 (342)
Editable Africa Countries PowerPoint Maps: Download PPTID: #PM00158$16.00
(342)
Editable Africa Countries PowerPoint Maps: Download PPTID: #PM00158$16.00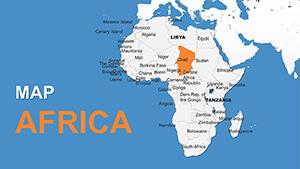 (896)
Africa with Countries PowerPoint Maps Template: Download PPTID: #PM00157$16.00
(896)
Africa with Countries PowerPoint Maps Template: Download PPTID: #PM00157$16.00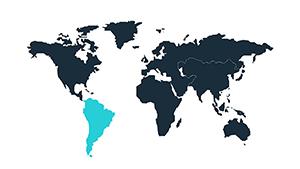 (109)
Continents World Map PPT Template: Download NowID: #PM00088$14.00
(109)
Continents World Map PPT Template: Download NowID: #PM00088$14.00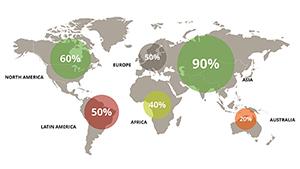 (487)
Widescreen Maps of World for PowerPoint: Panoramic Global VisionsID: #PM00087$20.00
(487)
Widescreen Maps of World for PowerPoint: Panoramic Global VisionsID: #PM00087$20.00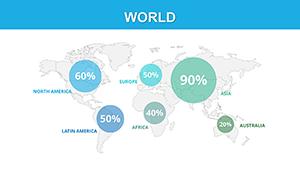 (988)
Political World PowerPoint Maps Template: Global Geopolitics at Your FingertipsID: #PM00086$20.00
(988)
Political World PowerPoint Maps Template: Global Geopolitics at Your FingertipsID: #PM00086$20.00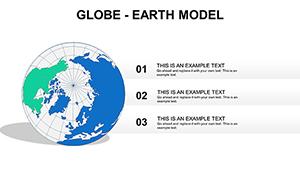 (1169)
Globe Earth Model PowerPoint Maps Template: Download PPTID: #PM00067$15.00
(1169)
Globe Earth Model PowerPoint Maps Template: Download PPTID: #PM00067$15.00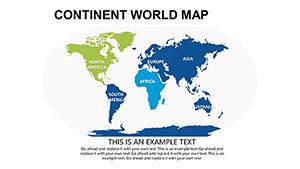 (24)
Modern World PowerPoint Maps: Trendy Templates for Global CommunicationID: #PM00066$16.00
(24)
Modern World PowerPoint Maps: Trendy Templates for Global CommunicationID: #PM00066$16.00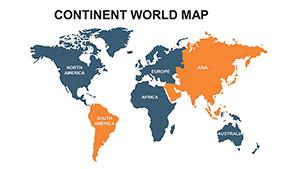 (851)
Continent World PowerPoint Maps: Global Visualization Made SimpleID: #PM00065$22.00
(851)
Continent World PowerPoint Maps: Global Visualization Made SimpleID: #PM00065$22.00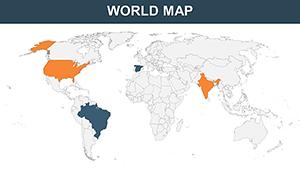 (384)
World Countries PowerPoint Maps: Chart the Globe with 65 Editable MasterpiecesID: #PM00061$35.00
(384)
World Countries PowerPoint Maps: Chart the Globe with 65 Editable MasterpiecesID: #PM00061$35.00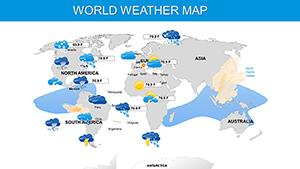 (665)
Weather and Climate Maps for PowerPoint: Forecast Your Message with PrecisionID: #PM00060$20.00
(665)
Weather and Climate Maps for PowerPoint: Forecast Your Message with PrecisionID: #PM00060$20.00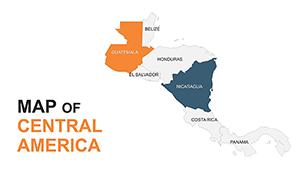 (228)
Central America Editable Maps: Tropical Visions UnleashedID: #PM00051$35.00
(228)
Central America Editable Maps: Tropical Visions UnleashedID: #PM00051$35.00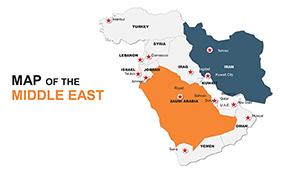 (848)
Custom Middle East Maps PPT: Navigate Global NarrativesID: #PM00049$48.00
(848)
Custom Middle East Maps PPT: Navigate Global NarrativesID: #PM00049$48.00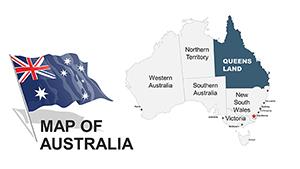 (812)
Australia PowerPoint Maps: 44 Editable DesignsID: #PM00043$48.00
(812)
Australia PowerPoint Maps: 44 Editable DesignsID: #PM00043$48.00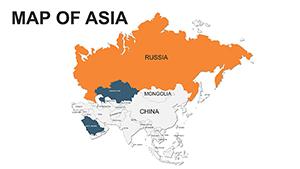 (116)
Asia PowerPoint Maps Template - Versatile VisualsID: #PM00039$48.00
(116)
Asia PowerPoint Maps Template - Versatile VisualsID: #PM00039$48.00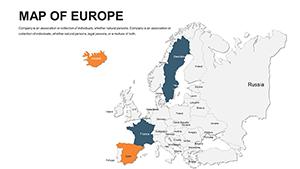 (1145)
Editable Europe PowerPoint Maps: Charting Success Across the ContinentID: #PM00034$48.00
(1145)
Editable Europe PowerPoint Maps: Charting Success Across the ContinentID: #PM00034$48.00 (505)
Editable North America PowerPoint Maps: Transform Data into Visual StoriesID: #PM00033$42.00
(505)
Editable North America PowerPoint Maps: Transform Data into Visual StoriesID: #PM00033$42.00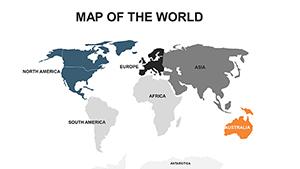 (136)
Asia Map PowerPoint Template - Emerging Markets FocusID: #PM00032$48.00
(136)
Asia Map PowerPoint Template - Emerging Markets FocusID: #PM00032$48.00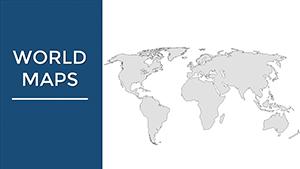 (228)
World Maps PPT Template for Global InsightsID: #PM00002$38.00
(228)
World Maps PPT Template for Global InsightsID: #PM00002$38.00
How world map slides turn geographic data into boardroom decisions
When a supply chain director must explain sourcing vulnerabilities across three continents to the executive committee, a single color-coded map replaces ten bullet slides. The layout already separates continents from countries and leaves space for callout boxes that update when linked data changes. This removes the alignment decisions that eat into thinking time.
Choosing continent-level versus country-level detail for different audiences
A high-level overview of seven continents works for quarterly all-hands meetings where the goal is directional insight. Country-level outlines become essential for market-entry planning when the sales vice president needs to highlight tariff impacts on specific nations. The templates keep both versions on the same slide master so switching requires only a visibility toggle, not a rebuild.
Real-world scenarios where these maps save hours of formatting
A finance director preparing the annual investor presentation must show revenue by region. The North America map already has grouped states; she drops in Excel-linked numbers and the colors update automatically. No more fighting shape order or text overlap.
The consultant running a geopolitical risk workshop uses the Europe map to overlay regulatory changes. Pre-placed callouts let her label each country without resizing the base layer. The client sees the story on first glance instead of decoding a cluttered custom graphic.
An HR leader rolling out international talent mobility policy uses the Asia map to mark office locations. The vector paths stay crisp when printed or exported to PDF, and the slide master ensures every map in the 40-slide deck shares the same color palette.
A product manager presenting expansion plans to the board colors South America in the growth palette. The grouped layers let her hide Antarctica entirely rather than deleting stray shapes that break the layout.
Non-obvious editing techniques that preserve map integrity in PowerPoint
When you ungroup to recolor a single country, select the entire continent group first and use the Format Shape pane to apply consistent stroke weights. This prevents the thin lines that appear when individual paths are edited separately. Always work on a duplicate slide master copy so changes propagate across the deck without manual repetition.
Technical setup that guarantees consistent rendering across devices
These templates use 16:9 aspect ratio with embedded slide master guides that lock the safe zone for logos and titles. When exporting to PDF, the vector paths render at full resolution regardless of zoom level. For Google Slides users, the same files open directly and maintain grouping behavior so one edit updates every instance.
If your next presentation involves global data storytelling, these world map templates remove the mechanical work and leave room for the actual strategy.
Need broader map options or regional deep dives? Check the full PowerPoint maps templates collection. For Keynote versions of the same layouts see Keynote maps templates. Pair maps with structured visuals from the diagram templates when one slide must combine geography and process.
Download the map set that matches your current geography story and open the file.
Are these world map PowerPoint templates compatible with Google Slides?
Yes, every file in the collection opens directly in Google Slides while preserving vector grouping and color placeholders. The slide master guides translate to guide lines so your 16:9 layout stays consistent. If a country path appears slightly offset after import, select the entire group and use the Arrange menu to align to the slide center - a one-click fix that takes under ten seconds.
Can I recolor individual countries without breaking the overall map?
Yes - each continent is a grouped object containing separate country paths. Right-click the country, choose Format Shape, and change fill or line color. The parent group stays intact so the rest of the map does not shift. Always duplicate the slide first when testing multiple color schemes so you can compare versions side by side without rebuilding.
Do the templates work in older versions of PowerPoint?
All files are tested and fully editable in PowerPoint 2016 and newer, including Microsoft 365 on both Windows and Mac. Vector paths use standard shape formats that do not rely on newer features. If you open in PowerPoint 2013 the grouping remains but some gradient options may flatten - simply reapply the corporate palette once and the map is ready for use.
What license terms apply to client presentations?
One purchase grants unlimited internal use and the right to include the maps in client-facing decks or reports. You may not resell or redistribute the original template file itself. Exporting a finished presentation as PDF or embedding static images is permitted under commercial use rights.
How do I add custom data labels to the map callouts?
Each template includes pre-placed text boxes linked to the country shapes. Click the placeholder, type your metric, and the box resizes automatically while staying aligned to the map edge. For dynamic updates link the text to an Excel cell via Paste Special - the label refreshes when the source data changes without moving the map layer.