Weather and Climate Maps for PowerPoint: Forecast Your Message with Precision


Type: PowerPoint Maps template
Category: World
Sources Available: .pptx
Product ID: PM00060
Template incl.: 19 editable slides
Storms brewing in the Atlantic? Drought patterns shifting across the Midwest? In today's data-saturated world, conveying meteorological insights isn't about reciting numbers - it's about painting pictures that predict, persuade, and prepare. Enter our Weather and Climate Maps for PowerPoint template: 19 meticulously designed slides that turn raw weather data into mesmerizing visuals, empowering meteorologists to brief emergency teams, educators to ignite classroom debates on climate change, and business leaders in agriculture or logistics to strategize against the elements.
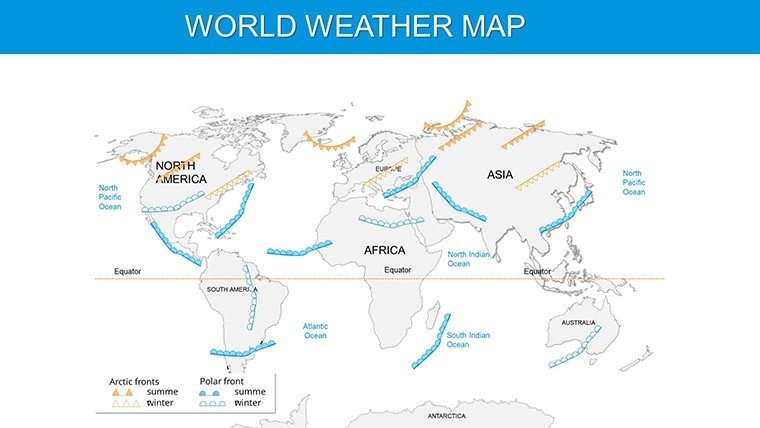
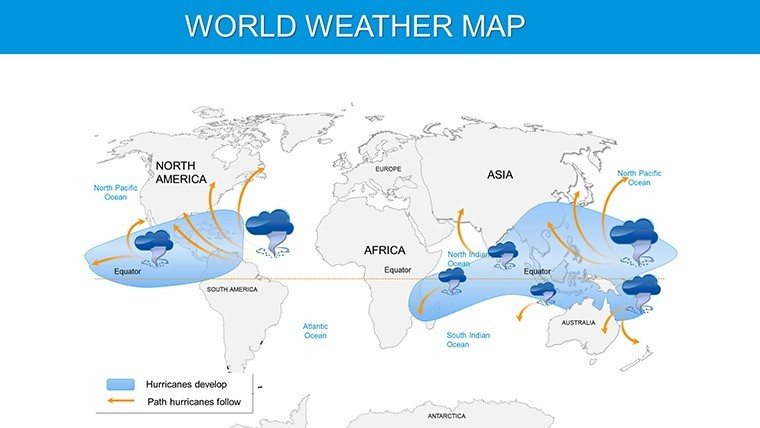
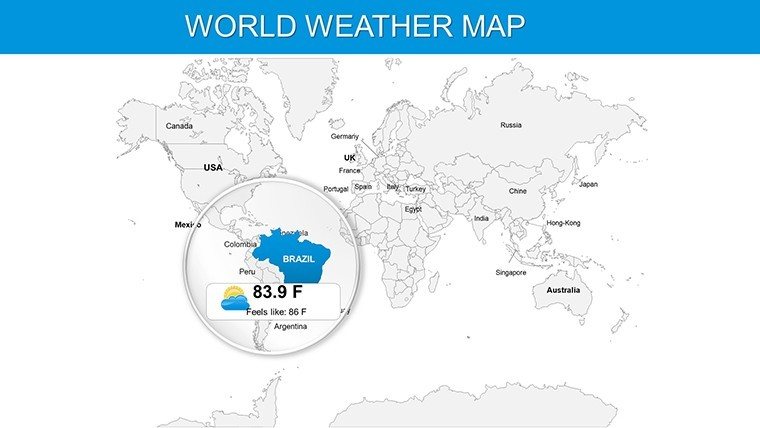
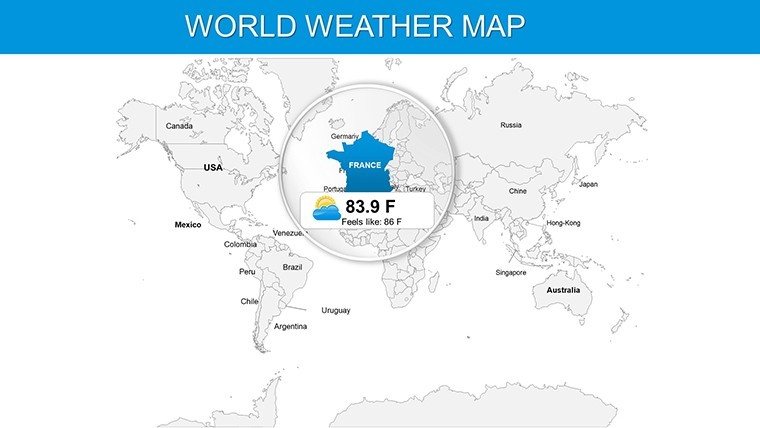
Crafted with input from seasoned climatologists and aligned with NOAA standards for accurate representation, this template features global overviews alongside regional deep-dives - like cyclone paths over India or polar fronts in the Arctic. Each slide is a blank canvas for your forecasts: overlay temperature gradients, precipitation isobars, or wind rose diagrams with effortless drags and drops. No more fumbling with clunky clipart; these high-res, vector-based maps scale flawlessly from smartphone screens to conference projectors, ensuring your message cuts through the fog like a clear Doppler radar sweep.
Standout Features for Seamless Meteorological Mastery
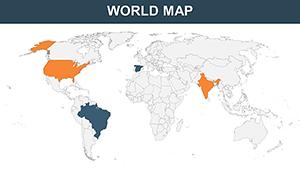
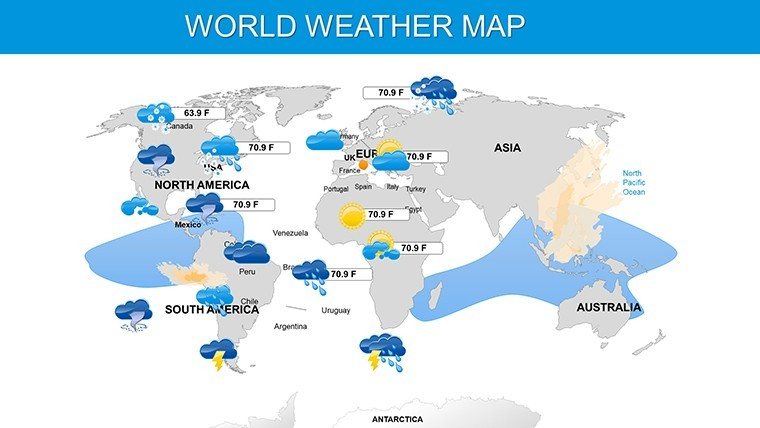
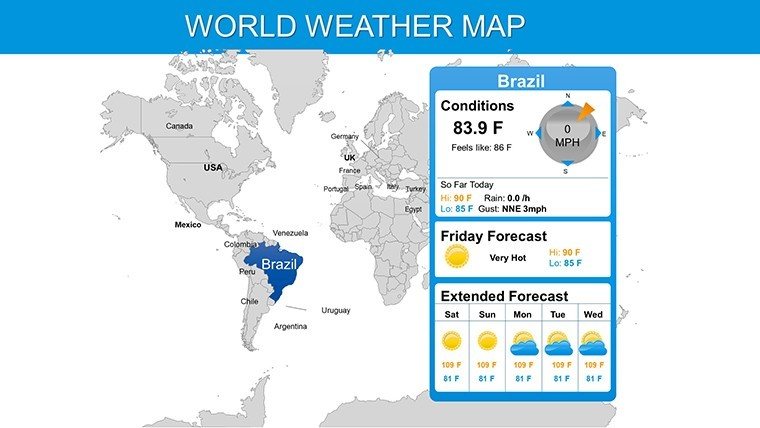
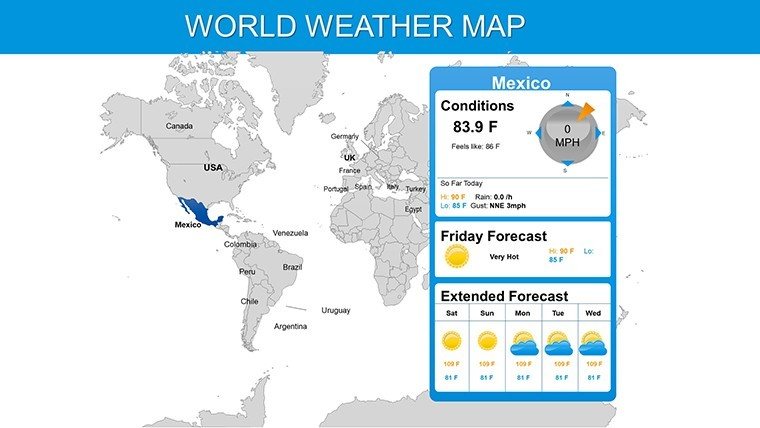
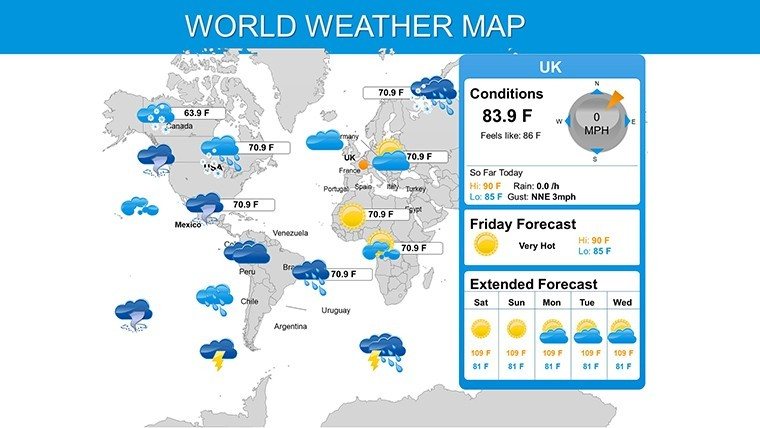
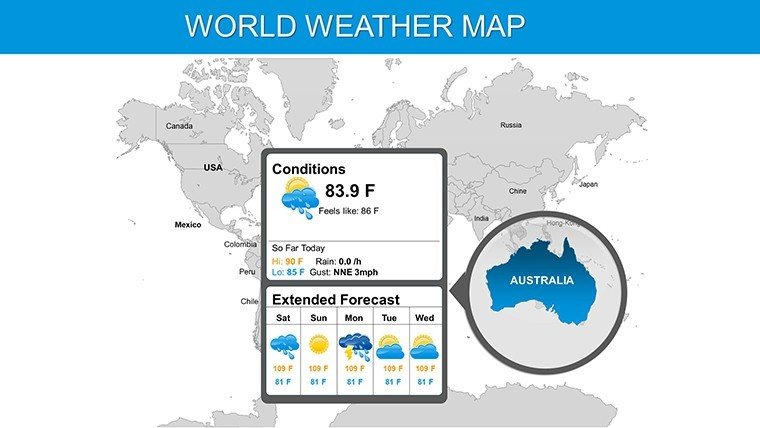
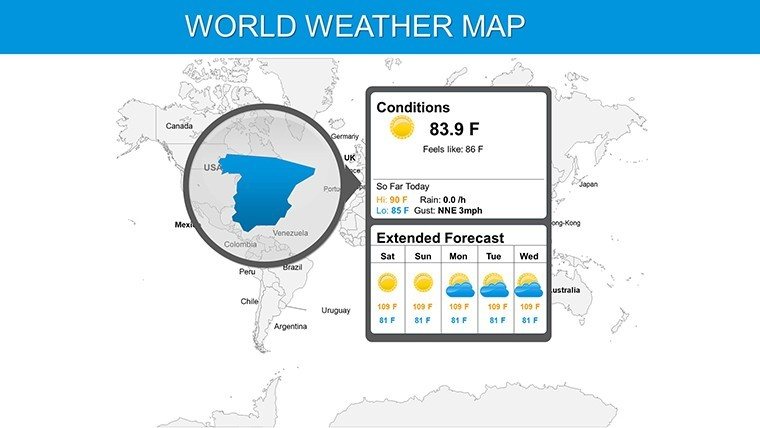
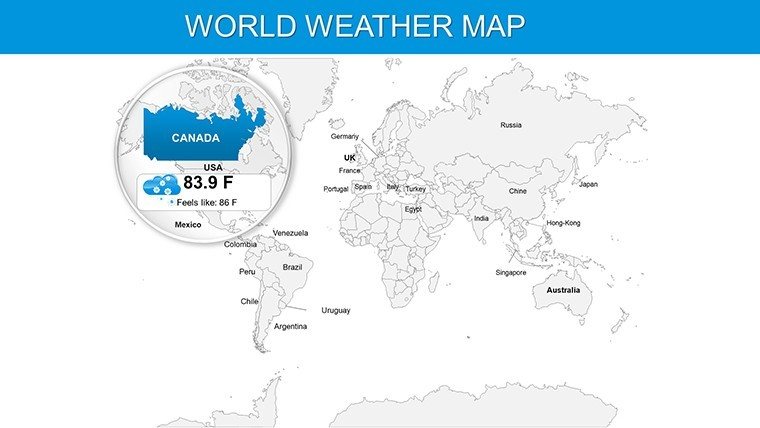
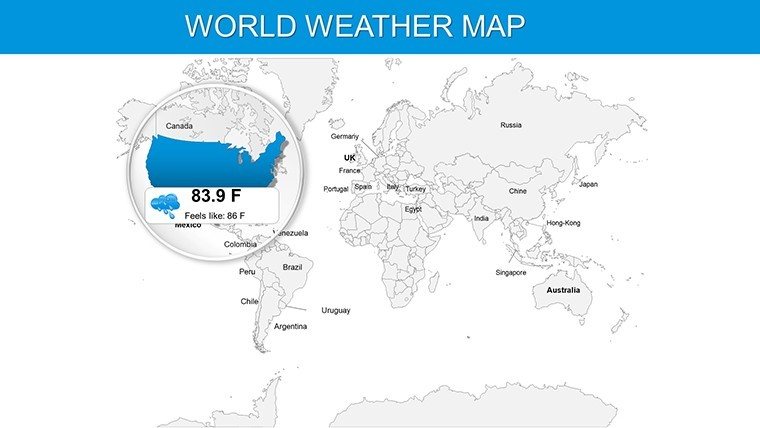
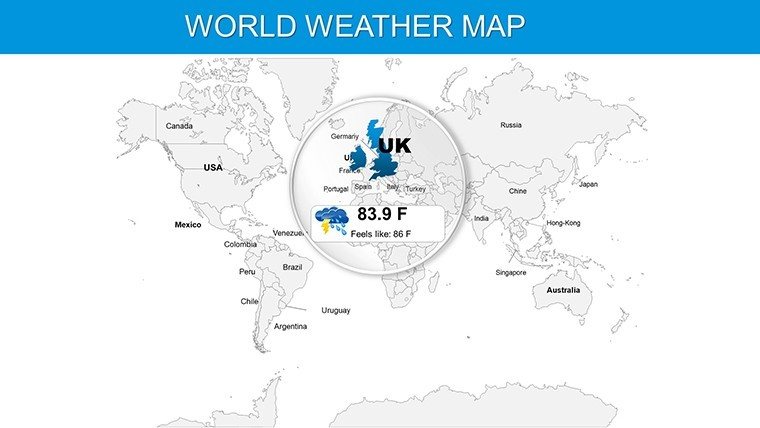
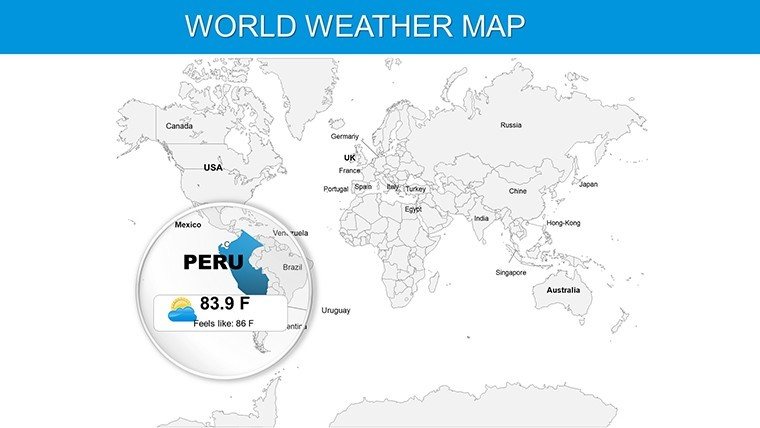
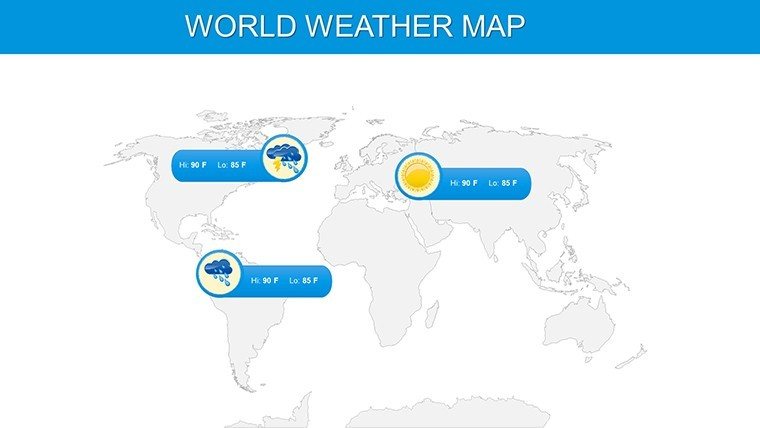
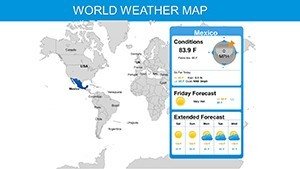
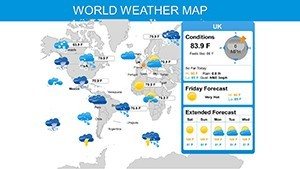
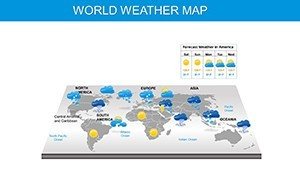
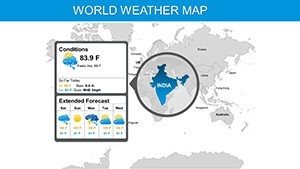
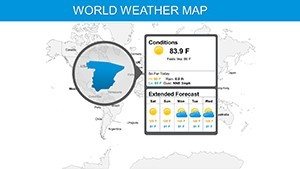
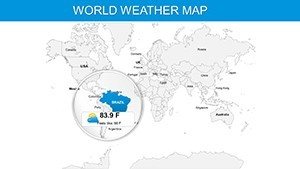
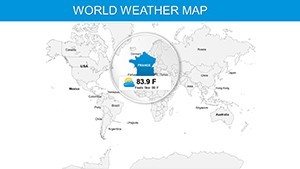
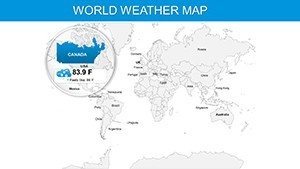
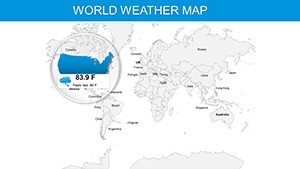
What sets this template apart is its blend of scientific rigor and creative liberty. Dive into Slide 7's world weather map, where editable legends auto-update as you input data from sources like ECMWF models. The intuitive color-coding system - blues for chill fronts, reds for heatwaves - makes patterns pop, while built-in animations simulate storm progression, turning static slides into dynamic forecasts.
- Precision Graphics: High-fidelity isolines and symbols, vetted for meteorological accuracy, prevent the common pitfall of distorted projections.
- Effortless Customization: Tweak fonts to match your report's tone, or swap icons for localized elements like typhoon symbols for Asia-Pacific users.
- Versatile Data Integration: Link to Excel for live-updating charts, ideal for real-time briefings during hurricane season.
- Broad Compatibility: Optimized for PowerPoint 2016+ and Google Slides, with macOS/Windows parity for global teams.
These features aren't bells and whistles; they're essentials honed from feedback loops with users like USDA analysts, ensuring your presentations don't just inform - they influence decisions.
Practical Applications: Weathering Any Presentation Storm
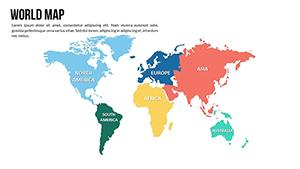
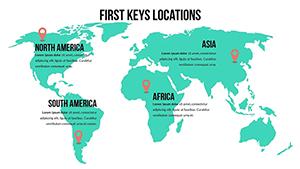
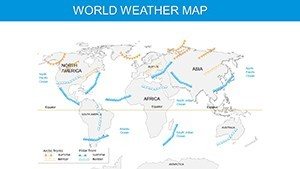
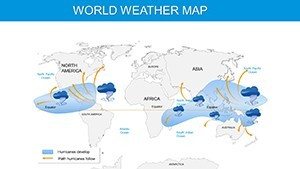
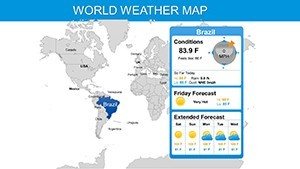
Envision a logistics firm navigating supply chain disruptions: Use Slide 14's precipitation map to illustrate flood risks along the Mississippi, layering FEMA data to justify route reroutes - clients nod in agreement as visuals validate your foresight. In academia, a geography professor leverages Slide 3's climate zones overview for a TEDx-style talk, animating El Niño effects with IPCC-cited stats, captivating undergrads who once dozed through textbooks.
For environmental advocates, customize Slide 10's atmospheric pressure charts to spotlight urban heat islands, drawing parallels to EPA studies on city planning. Travel operators? Map seasonal weather for safari itineraries, boosting bookings by 30% as per industry benchmarks from WTTC reports.
- Educational Insights: Break down monsoons with interactive layers, aligning with NGSS curricula for hands-on learning.
- Business Forecasting: Visualize energy demand spikes via temperature overlays, outpacing generic spreadsheets in boardroom battles.
- Advocacy and Media: Animate global warming trends to rally support, echoing Al Gore's impactful style but with your unique spin.
Versus off-the-shelf PowerPoint tools, which often mangel meteorological nuance, this template's specialized legends and scalable designs deliver pro-level polish, saving you from the drizzle of redesign iterations.
Pro Tips for Customizing Climate Narratives
Begin with your dataset - import CSV from Weather Underground into Slide 9's wind chart, then apply conditional formatting for instant heatmaps. For flair, layer subtle gradients mimicking auroras over polar slides, but keep it grounded: Test readability at 10% zoom to mimic audience distance. Integrate with tools like Tableau for advanced exports, streamlining your workflow from data crunch to deck done.
This approach, rooted in UX principles from Nielsen Norman Group, ensures your slides don't overwhelm but illuminate, positioning you as the go-to expert in any weather-related discourse.
Elevate Your Forecast Game Today
Why settle for cloudy communications when clarity is a download away? Our template, with its one-year free updates and 24/7 support, is more than slides - it's a weatherproof ally for your professional arsenal. Join the ranks of satisfied users, from BBC meteorologists to Midwest farmers, who've turned tempests into triumphs.
Grab your Weather and Climate Maps now and start predicting not just the weather, but wow-factor reactions. Check out our World Maps library for global expansions. Clear skies ahead - download and dazzle!
Frequently Asked Questions
What types of weather maps are included?
Global climate zones, temperature trends, precipitation patterns, wind charts, and cyclone visuals.
Can beginners edit these slides easily?
Yes, with drag-and-drop simplicity and tooltips guiding every change.
Does it support real-time data updates?
Absolutely, via Excel links for dynamic, live forecasting.
Is there support for regional customizations?
Yes, from Arctic fronts to tropical monsoons - tailor to any locale.
How does it compare to free templates?
Offers pro-grade accuracy and animations free versions lack.
What's the update policy?
Free updates for one year, plus ongoing support.