South America PowerPoint Maps
This collection includes South America map slides built for teams that present regional data, coverage, or expansion plans. You`re not just placing a map on a slide. You`re showing how numbers connect to geography, which is where most decks get messy.
I`ve used similar layouts when a sales director needed to explain territory gaps across Brazil, Chile, and Peru in a quarterly review. A chart didn`t work. A table confused everyone. The map made it obvious in seconds.
If your next meeting involves country comparisons, logistics routes, or market rollout, start with a layout that already handles geographic clarity. You drop in your data. Done.
 (83)
(83) Falkland Islands PowerPoint Maps TemplateID: #PM00225$15.00
 (56)
Venezuela PowerPoint Maps Template: Engage and InspireID: #PM00201$50.00
(56)
Venezuela PowerPoint Maps Template: Engage and InspireID: #PM00201$50.00 (355)
(355) Peru PowerPoint Map Template - Professional & Fully EditableID: #PM00200$35.00
 (557)
Chile PowerPoint Maps Template: Editable Slides for Dynamic PresentationsID: #PM00186$40.00
(557)
Chile PowerPoint Maps Template: Editable Slides for Dynamic PresentationsID: #PM00186$40.00 (197)
(197) Costa Rica PowerPoint Maps: Versatile Editable Templates for Impactful StorytellingID: #PM00185$50.00
 (824)
Ecuador PowerPoint Map Template: Visualize Andean WondersID: #PM00180$53.00
(824)
Ecuador PowerPoint Map Template: Visualize Andean WondersID: #PM00180$53.00 (898)
Argentina PowerPoint Maps Template: Diverse Landscapes in FocusID: #PM00176$50.00
(898)
Argentina PowerPoint Maps Template: Diverse Landscapes in FocusID: #PM00176$50.00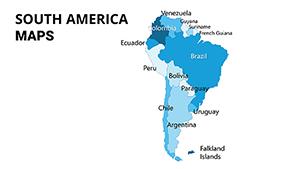 (1153)
South America PowerPoint Maps: Chart the Continent's PulseID: #PM00074$25.00
(1153)
South America PowerPoint Maps: Chart the Continent's PulseID: #PM00074$25.00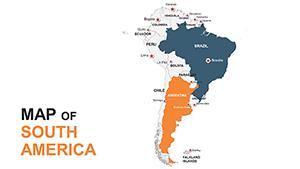 (675)
South America Editable Maps: PowerPoint Template ProID: #PM00054$45.00
(675)
South America Editable Maps: PowerPoint Template ProID: #PM00054$45.00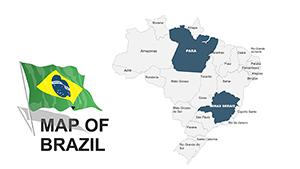 (407)
Brazil PowerPoint Maps: 46 Editable SlidesID: #PM00037$45.00
(407)
Brazil PowerPoint Maps: 46 Editable SlidesID: #PM00037$45.00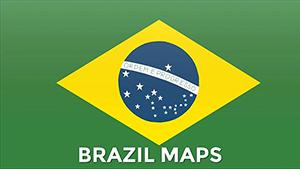 (1152)
Brazil PowerPoint Maps: Interactive Template for Insightful PresentationsID: #PM00028$45.00
(1152)
Brazil PowerPoint Maps: Interactive Template for Insightful PresentationsID: #PM00028$45.00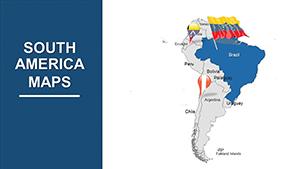 (109)
Journey Through South America: Premium 41-Slide PowerPoint Maps TemplateID: #PM00007$54.00
(109)
Journey Through South America: Premium 41-Slide PowerPoint Maps TemplateID: #PM00007$54.00
Why a geographic map works when numbers alone fail
There`s a specific moment in regional reporting when a table stops being useful. Too many rows. Too many countries. You lose the pattern. That`s where a map slide does something a chart cannot. It ties numbers to place. And suddenly the story is visible.
The column alignment here actually saves you a lot of pain. You`re not fighting spacing or labels. The structure is already doing half the thinking for you.
In practice, after working on dozens of regional decks, I noticed the same issue: people try to force geographic data into bar charts. It works, technically. But it doesn`t explain anything.
Use a map when location matters to the decision. Not just when it looks nice.
If you`re preparing a regional update, start with a layout that already separates countries clearly and keeps labels readable. That`s usually the difference between a slide that gets skipped and one that gets discussed.
Real scenarios where these slides actually get used
A logistics manager preparing a supply chain overview. The issue wasn`t the data. It was explaining delays across multiple countries. When I last used a similar map layout, the route overlays made bottlenecks obvious without extra explanation.
A marketing lead presenting campaign coverage. Different markets, different budgets. A map with color-coded intensity replaced three slides of explanation. Slightly annoying at first to match colors, but once set, it works.
A finance team showing revenue by country. Honestly, I opened it and thought, okay, this works. No adjustments needed. Just swap numbers, adjust legend, done.
You know that moment when the deck is due at 9am and you haven`t finished the regional slide? This is that moment. You don`t build anything. You just fill it in.
What this map layout does better than charts or tables
Maps handle spatial relationships. That`s the whole point. A table lists data. A chart compares values. A map shows distribution across space.
But here`s the part people miss. If the layout is poorly built, labels overlap. Colors blend. Borders disappear when resized. These templates avoid that by keeping country shapes grouped cleanly and spacing consistent.
From experience, the difference shows up when you duplicate slides. Good layouts stay aligned. Bad ones fall apart immediately.
When to use this instead of other categories
If your message depends on geography, stay here. If you`re comparing abstract metrics without location, you`re better off with PowerPoint charts.
Need more conceptual flows instead of regions? Go with diagram templates. Those explain relationships, not locations.
And if you`re just showing global presence without detail, a broader map collection makes more sense.
Basically, use this category when country-level clarity is the point. Not decoration. Not filler. Actual decision support.
Why these layouts hold up in real decks
Most map slides break when resized or recolored. Borders shift. Text overlaps. It looks fine until you actually use it.
Here, shapes are grouped logically. Colors follow a consistent system. And labels stay readable even after edits. At first it feels a bit much, but once you get the logic it becomes second nature.
I always check the slide master first. Usually messy. These are cleaner than most. Not perfect, but usable without rebuilding everything.
Also works for internal ops reviews, not just client decks.
FAQ
Can I edit individual countries separately?
Yes, each country is usually a separate shape, so you can recolor or highlight them individually. From experience, this is where many templates fail, but here it works fine. Just be careful when ungrouping, because sometimes labels are tied to the shapes and can shift slightly.
Do these work in older PowerPoint versions?
Usually yes, but it depends a bit on how old. PowerPoint 2016 and newer works without issues. Earlier versions may open the file, but gradients or fonts might shift. If that happens, just reset the theme and it stabilizes quickly.
Can I add more countries or regions?
The short answer is no, not directly. These are fixed maps. You can duplicate shapes or import new ones, but alignment becomes tricky. In most cases, it`s easier to adapt what`s already there instead of extending the map structure.
Are these suitable for commercial presentations?
Yes. It`s the same license most marketplaces use - one buyer, one project, commercial use included. If you`re working across multiple clients, just make sure each project has its own license. That`s basically it.
Can I export these slides to PDF without issues?
Yes, exporting works as expected. Maps keep their structure and colors. I`ve seen minor font shifts occasionally, but nothing major. Just check alignment once after export. Oh, and you can also export to PDF directly from PowerPoint.