Cycle PowerPoint Charts
A collection of cycle chart templates built for PowerPoint and Google Slides. Use them whenever repeating processes or interconnected strategies must be shown at a glance instead of building circles from scratch.
A manager outlining the product development lifecycle knows the visual must illustrate the loop clearly. These slides handle segment angles, icon placement, and animation timing so the focus stays on the workflow.
This selection prioritizes circular storytelling. Pick the file that matches your process length and open it in PowerPoint.
 (13)
(13) Environmental Impact of Projects PowerPoint Template and ChartsID: #PC01155$15.00
 (14)
(14) Academic Achievement VS Student Satisfaction PowerPoint Template and ChartsID: #PC01151$15.00
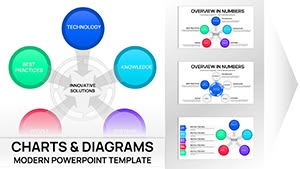 (12)
Innovative Solutions PowerPoint Charts Template | 41 Editable Slides - Business Models ReadyID: #PC01114$18.00
(12)
Innovative Solutions PowerPoint Charts Template | 41 Editable Slides - Business Models ReadyID: #PC01114$18.00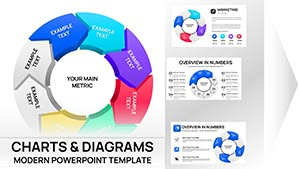 (8)
3D Volume Cyclic PowerPoint Charts - Editable SlidesID: #PC01113$20.00
(8)
3D Volume Cyclic PowerPoint Charts - Editable SlidesID: #PC01113$20.00 (10)
Cycle Periods PowerPoint Template for Time-Based ChartsID: #PC01096$20.00
(10)
Cycle Periods PowerPoint Template for Time-Based ChartsID: #PC01096$20.00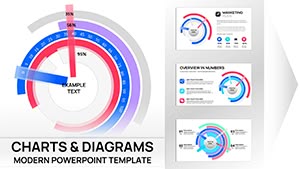 (17)
Circular Cycle Diagram Template for PowerPointID: #PC01091$12.00
(17)
Circular Cycle Diagram Template for PowerPointID: #PC01091$12.00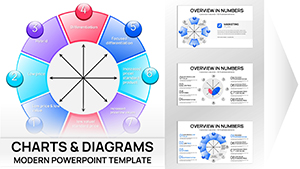 (17)
Bowman's Strategy Clock Charts Template for PowerPoint - 40 editable slidesID: #PC01088$16.00
(17)
Bowman's Strategy Clock Charts Template for PowerPoint - 40 editable slidesID: #PC01088$16.00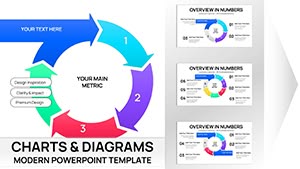 (16)
Cycle Periods Incoming PowerPoint Charts Template - 44 SlidesID: #PC01087$20.00
(16)
Cycle Periods Incoming PowerPoint Charts Template - 44 SlidesID: #PC01087$20.00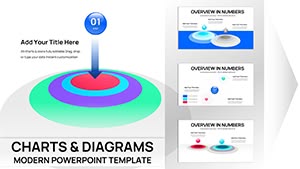 (11)
Ripple Effects PowerPoint Charts TemplateID: #PC01086$15.00
(11)
Ripple Effects PowerPoint Charts TemplateID: #PC01086$15.00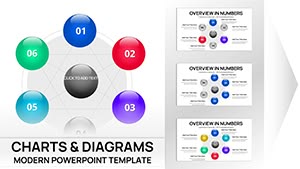 (13)
Connected Balls Chart Template for PowerPoint - 26 SlidesID: #PC01084$12.00
(13)
Connected Balls Chart Template for PowerPoint - 26 SlidesID: #PC01084$12.00 (13)
Cyclical Balls Charts Template for PowerPoint - 40 SlidesID: #PC01083$14.00
(13)
Cyclical Balls Charts Template for PowerPoint - 40 SlidesID: #PC01083$14.00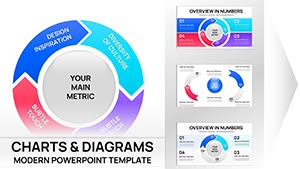 (11)
Cyclical Pie Chart PowerPoint TemplateID: #PC01079$18.00
(11)
Cyclical Pie Chart PowerPoint TemplateID: #PC01079$18.00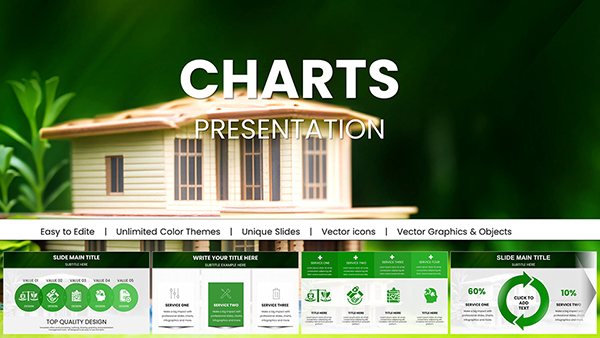 (1195)
 House Rent and Sale PowerPoint Charts: Elevate Your Real Estate GameID: #PC01057$25.00
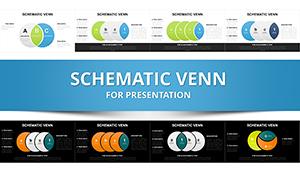 (377)
Schematic Venn Diagram PowerPoint TemplateID: #PC00295$20.00
(377)
Schematic Venn Diagram PowerPoint TemplateID: #PC00295$20.00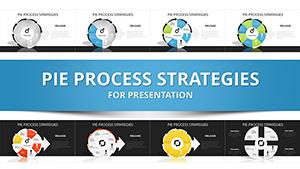 (574)
(574) Pie Process Strategies PowerPoint Charts Template - Presentation PPTID: #PC00293$24.00
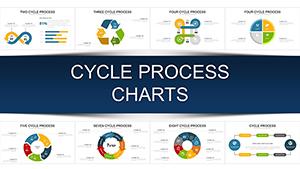 (749)
Cycle Process PowerPoint Charts Template: Visualize Your Workflows EffortlesslyID: #PC00922$20.00
(749)
Cycle Process PowerPoint Charts Template: Visualize Your Workflows EffortlesslyID: #PC00922$20.00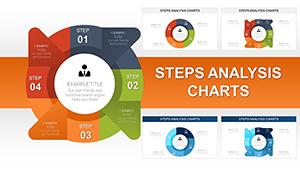 (583)
Steps Analysis PowerPoint Charts Template: Visualize Processes with PrecisionID: #PC00918$18.00
(583)
Steps Analysis PowerPoint Charts Template: Visualize Processes with PrecisionID: #PC00918$18.00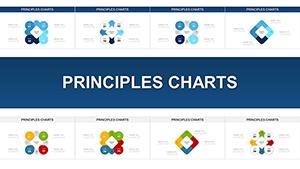 (724)
Principles PowerPoint Charts for PresentationID: #PC00917$16.00
(724)
Principles PowerPoint Charts for PresentationID: #PC00917$16.00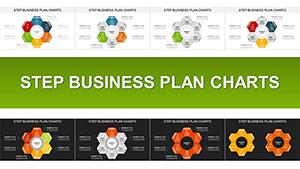 (212)
Step Business Plan PowerPoint Charts Template for Compelling PitchesID: #PC00916$23.00
(212)
Step Business Plan PowerPoint Charts Template for Compelling PitchesID: #PC00916$23.00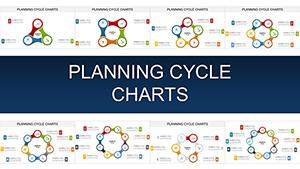 (911)
Planning Cycle PowerPoint Charts Template for Strategic PresentationsID: #PC00915$20.00
(911)
Planning Cycle PowerPoint Charts Template for Strategic PresentationsID: #PC00915$20.00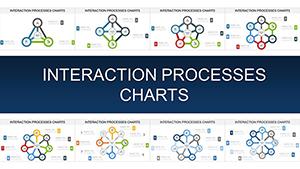 (248)
Interaction Processes PowerPoint Charts for Dynamic PresentationsID: #PC00914$22.00
(248)
Interaction Processes PowerPoint Charts for Dynamic PresentationsID: #PC00914$22.00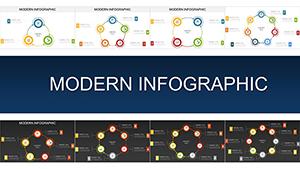 (508)
Modern Infographic Charts - Editable PPTX | ImagineLayoutID: #PC00913$15.00
(508)
Modern Infographic Charts - Editable PPTX | ImagineLayoutID: #PC00913$15.00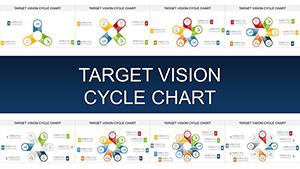 (1164)
Illuminate Strategy with Target Vision Cycle PowerPoint ChartsID: #PC00912$18.00
(1164)
Illuminate Strategy with Target Vision Cycle PowerPoint ChartsID: #PC00912$18.00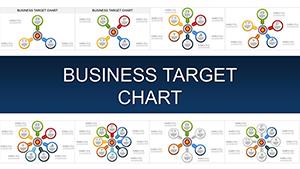 (569)
Drive Business Success with Targeted PowerPoint Chart MasteryID: #PC00911$22.00
(569)
Drive Business Success with Targeted PowerPoint Chart MasteryID: #PC00911$22.00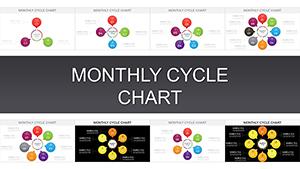 (560)
Elevate Monthly Reporting with Dynamic Cycle Charts in PowerPointID: #PC00910$15.00
(560)
Elevate Monthly Reporting with Dynamic Cycle Charts in PowerPointID: #PC00910$15.00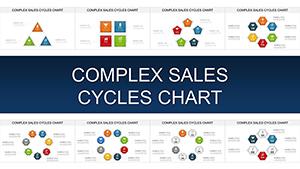 (207)
Master Complex Sales Cycles with Stunning PowerPoint ChartsID: #PC00909$18.00
(207)
Master Complex Sales Cycles with Stunning PowerPoint ChartsID: #PC00909$18.00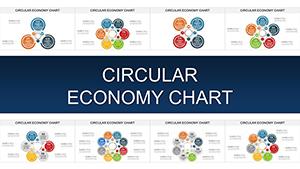 (746)
Circular Economy PowerPoint Charts - Infographic TemplateID: #PC00908$20.00
(746)
Circular Economy PowerPoint Charts - Infographic TemplateID: #PC00908$20.00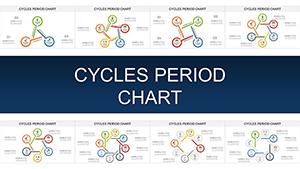 (1174)
Cycles Period PowerPoint Charts Template for PresentationID: #PC00907$18.00
(1174)
Cycles Period PowerPoint Charts Template for PresentationID: #PC00907$18.00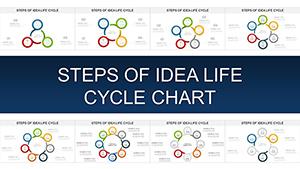 (507)
Presenting the Idea Life Cycle: Step-by-Step PowerPoint Charts for InnovationID: #PC00906$18.00
(507)
Presenting the Idea Life Cycle: Step-by-Step PowerPoint Charts for InnovationID: #PC00906$18.00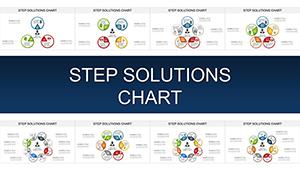 (453)
Step Solutions PowerPoint Charts: Master Problem-Solving PresentationsID: #PC00905$20.00
(453)
Step Solutions PowerPoint Charts: Master Problem-Solving PresentationsID: #PC00905$20.00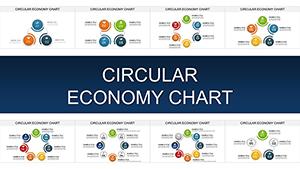 (986)
Circular Economy Charts: PowerPoint Tools for Sustainable ArchitectureID: #PC00904$15.00
(986)
Circular Economy Charts: PowerPoint Tools for Sustainable ArchitectureID: #PC00904$15.00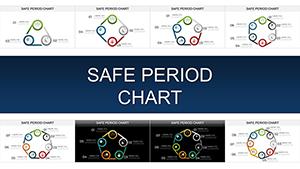 (1091)
Safe Period Charts: Your Ultimate PowerPoint Guide to Cycle AwarenessID: #PC00903$20.00
(1091)
Safe Period Charts: Your Ultimate PowerPoint Guide to Cycle AwarenessID: #PC00903$20.00 (290)
Project Cycle Steps PowerPoint Charts: Mastering Architecture ManagementID: #PC00902$20.00
(290)
Project Cycle Steps PowerPoint Charts: Mastering Architecture ManagementID: #PC00902$20.00
Why cycle diagrams reveal repeating patterns in business operations?
The closed loop shape instantly communicates iteration and feedback that linear lists cannot.
What if my process has an uneven number of stages?
Duplicate any segment and adjust the angle with the shape edit tool. The slide master keeps color coding and text alignment consistent.
Practical guidance for recurring presentations
Save the cycle style in the slide master library. Future quarterly updates inherit the exact icon set and animation sequence.
Real scenarios where the right cycle chart changes the meeting
A sustainability lead presents the annual reporting cycle. The 4-stage diagram with icons shows the feedback loop and the animation highlights improvements.
An educator teaching the marketing funnel uses the circular template. Students see the continuous loop and the client immediately grasps the retention phase.
A consultant maps the customer service lifecycle. The 6-stage layout reveals the repeat purchase loop that text descriptions had obscured.
A product manager reviews the agile sprint cycle. The diagram with arrows shows the iteration path and the team spots bottlenecks at a glance.
What you lose when you build cycle charts manually
Aligning segment angles, matching icon sizes, and setting consistent rotation across slides consumes hours that should have gone into refining the narrative.
Technical detail for PowerPoint users
Group the segments and apply the entrance animation to the group. The morph transition then smoothly rotates the entire cycle when values update.
What sets this collection apart
The layouts focus on corporate storytelling through circular hierarchy rather than decorative effects. All elements stay fully editable with vector scalability and color palettes drawn from standard business schemes.
Choosing the right category for your next deck
If your work involves linear flows explore our arrows PowerPoint chart templates or the graphs PowerPoint chart templates. For organizational visuals in Keynote see the hierarchy Keynote charts templates.
If this matches your current deliverable the full set is ready below.
Are these templates compatible with Google Slides?
Yes every PPTX file imports without loss of segment angles or animations. Linked data becomes static but colors and icons remain fully editable.
Can I adjust the number of stages?
Yes all cycles are native PowerPoint shapes. Duplicate or delete segments then use the shape edit tool to redistribute angles while the slide master keeps the overall style.
Do the templates support team sharing?
The license allows internal company use. You may distribute the customized decks inside the organization. The files contain no watermarks and all elements remain editable without purchase restrictions.
What PowerPoint versions are supported?
The templates open in PowerPoint 2019 and newer including Microsoft 365. Older versions may require the shape update add-in but the slide master and layouts remain intact.