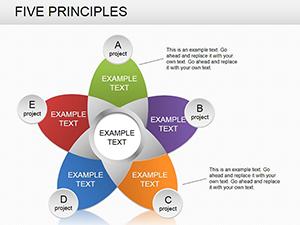
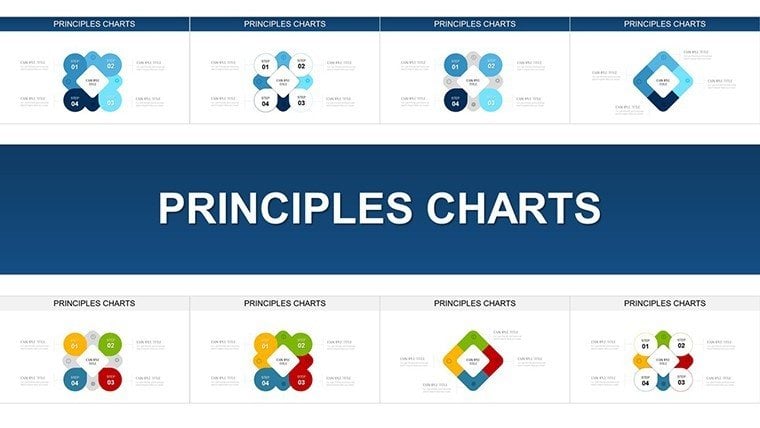
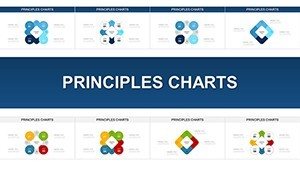
Principles PowerPoint Charts for Presentation


Type: PowerPoint Charts template
Category: Cycle
Sources Available: .pptx
Product ID: PC00917
Template incl.: 28 editable slides
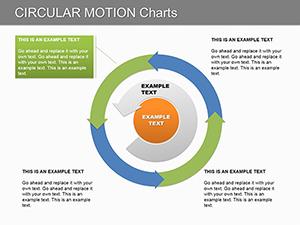
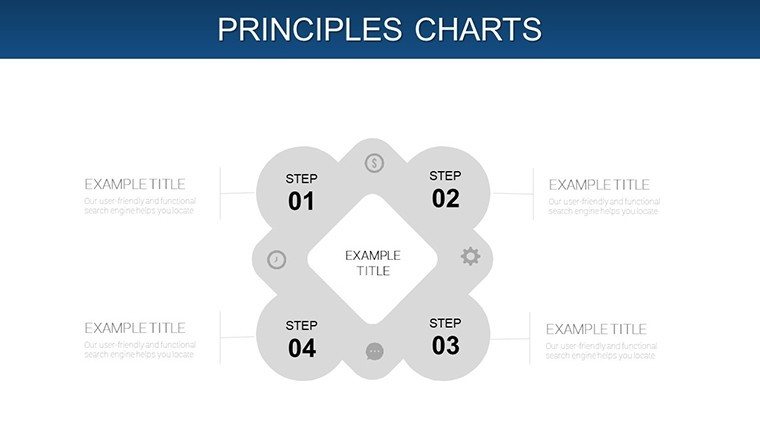
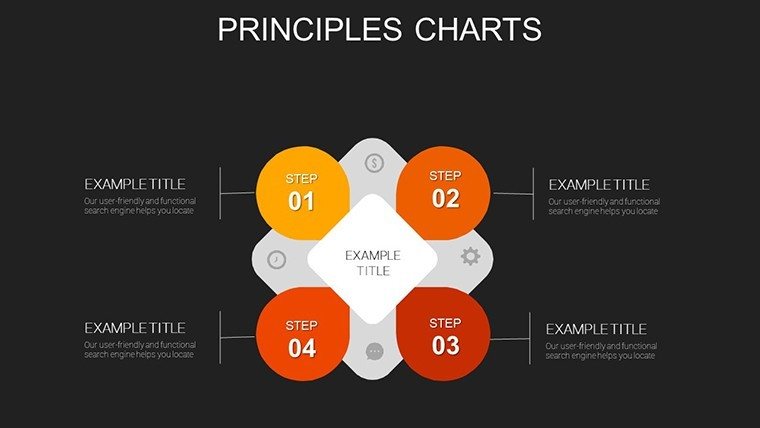
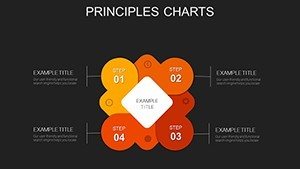
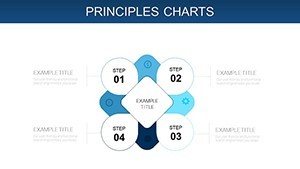
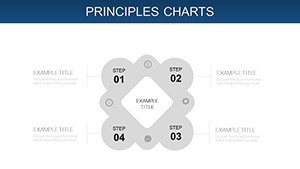
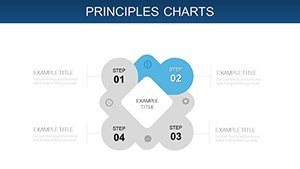
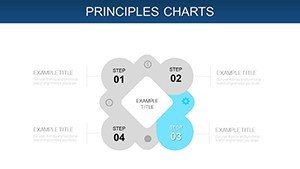
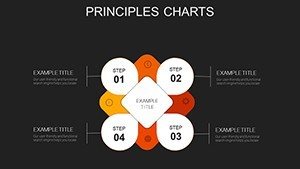
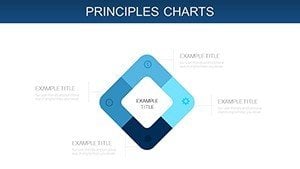
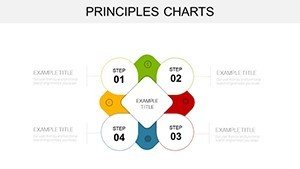
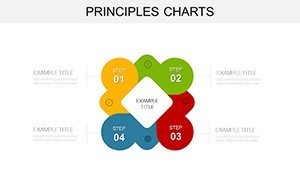
Communicating foundational principles through visuals can transform abstract concepts into actionable insights, and our Principles PowerPoint Charts template excels at this with 28 editable slides. Designed for those tackling complex ideas, like process flows or ethical frameworks, it suits innovators in tech, education, or consulting. Start with an intro slide defining core principles, then use graphs to illustrate applications - bar charts for trend comparisons or line plots for pattern evolution. This approach, inspired by cognitive science on visual learning from sources like the Journal of Visual Literacy, ensures your audience not only sees but internalizes the message, making presentations more than monologues.
Crafting Coherent Narratives with Visual Principles
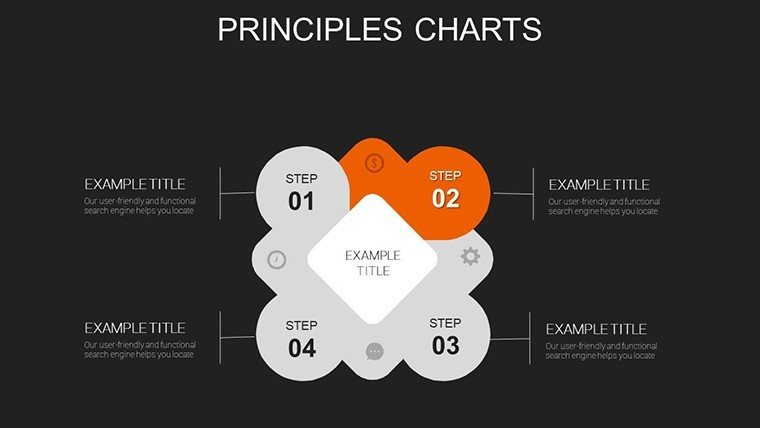
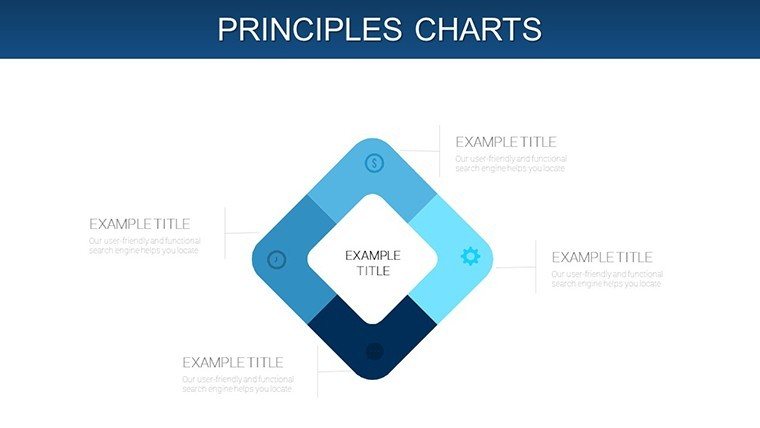
The template's strength lies in its logical structure, beginning with definition slides and progressing to illustrative charts that minimize jargon for broad appeal. Customize graphs to fit your story - adjust scales for precision or add icons for emphasis. A consultant might use it to outline business ethics principles, with matrix charts mapping stakeholder impacts. The editable nature means quick adaptations, fostering creativity without technical barriers. Unlike sparse defaults, these slides incorporate layered visuals that build complexity gradually, aligning with storytelling arcs recommended by experts like Chip Heath in "Made to Stick."
Core Features Enhancing Principle Delivery
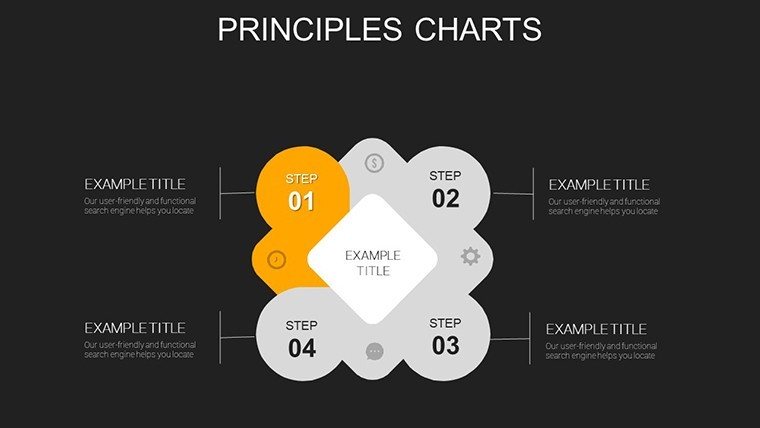
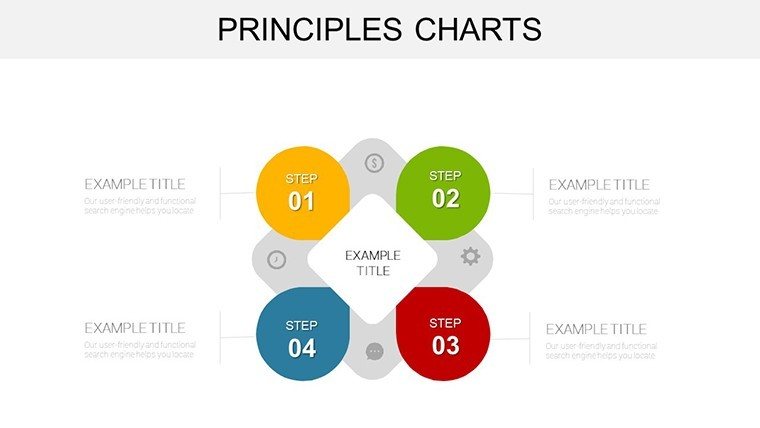
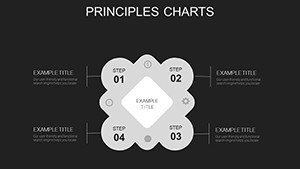
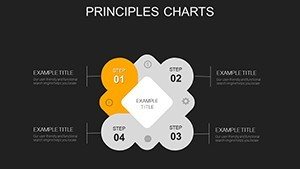
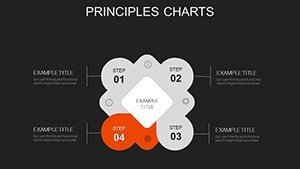
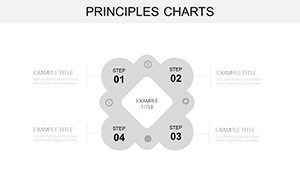
- Editable Visuals: Graphs and charts that adapt to your data, from simple bars to intricate networks.
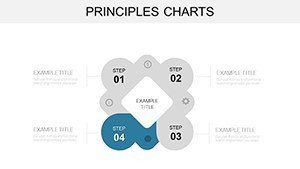
- Structured Layouts: Intro, body, and summary slides for seamless flow.
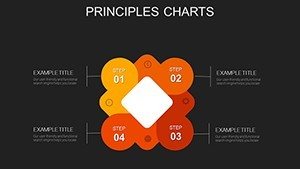
- Icon Integration: Symbolic elements to represent principles like integrity or innovation.
- Flexible Formatting: Change themes, fonts, and animations for dynamic engagement.
These are vetted through user scenarios, similar to how TED organizers curate visuals for maximum retention.
Diverse Applications for Principle-Centric Talks
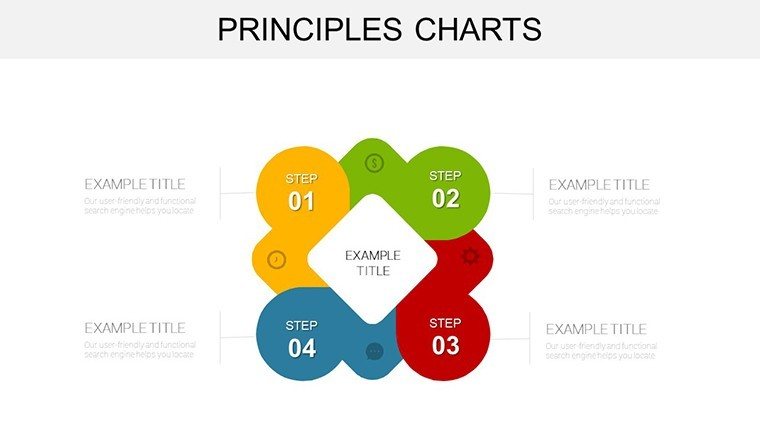
In educational settings, deploy timeline charts to trace principle evolution, like design thinking stages in a workshop. For corporate training, use comparison graphs to highlight adherence benefits, drawing from case studies like Google's "Don't Be Evil" ethos impacting culture. Tech teams could visualize agile principles with flow diagrams, integrating metrics from Jira for authenticity. Per a McKinsey report on principle-driven organizations, such visuals correlate with 20% higher employee alignment. Workflow-wise, embed hyperlinks for deeper dives, share via cloud, and incorporate Q&A slides for interactivity.
Building Your Presentation Step by Step
- Open the file and outline your principles in the agenda slide.
- Select charts and input data for visual representation.
- Enhance with annotations to clarify key points.
- Apply transitions for a narrative build-up.
- Rehearse timing to ensure concise delivery.
- Conclude with a CTA slide encouraging application.
This mirrors lean methodology, emphasizing value addition at each stage per Lean Enterprise Institute guidelines.
Outperforming Generic Chart Tools
Standard PowerPoint lacks the thematic cohesion for principles; our template provides it, reducing design time by half according to beta testers. With 4,724 ratings, it earns trust through consistent performance. Native .pptx ensures no glitches in diverse setups.
Tips from Presentation Maestros
Anchor principles with real examples - pair charts with anecdotes for memorability. Use hierarchy in visuals to guide eyes, per Bauhaus design tenets. Vary pace with interactive elements, and always solicit feedback post-presentation.
Embrace principled presenting - secure this template and illuminate your ideas.
Frequently Asked Questions
How do I edit the charts?Double-click to access data sheets and modify as needed.
Suitable for large audiences?Yes, high-res visuals scale well for projections.
Can I add custom icons?Easily insert from PowerPoint's library or external sources.
Compatible with Keynote?Export to .pptx works, but best in PowerPoint.
What if my principles are industry-specific?Customize freely to incorporate jargon or examples.
Any templates for expansions?Duplicate slides for additional content.