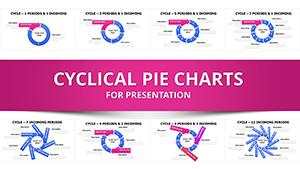
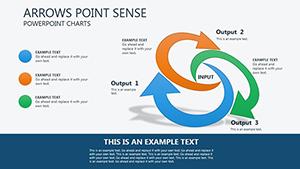
Physics Circular Motion Charts PowerPoint Template


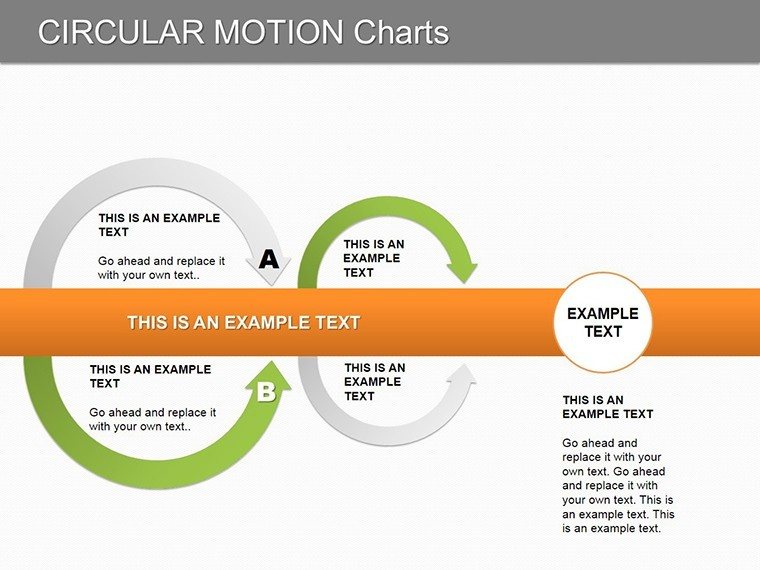


Circular motion, the dance of objects around a central axis, underpins everything from planetary orbits to amusement park rides. Our Circular Motion PowerPoint Charts Template captures this essence with 28 editable slides, making it an indispensable tool for physics educators, researchers, and students. Delve into velocity changes, accelerations, and forces through tailored diagrams that simplify the abstract, turning lectures into visual adventures. Whether explaining centripetal force in a classroom or presenting research at a conference, these charts provide the clarity needed to convey intricate principles with ease.
Rooted in fundamental physics, the template aligns with curricula like AP Physics, offering graphs and diagrams that illuminate relationships - velocity vectors curving gracefully, acceleration pointing inward - fostering deeper intuition.
Essential Features for Physics Visualization
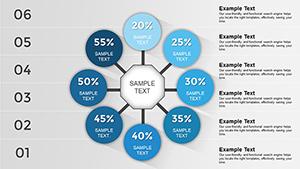
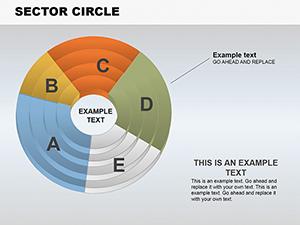
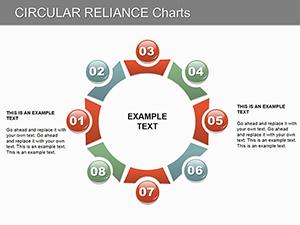
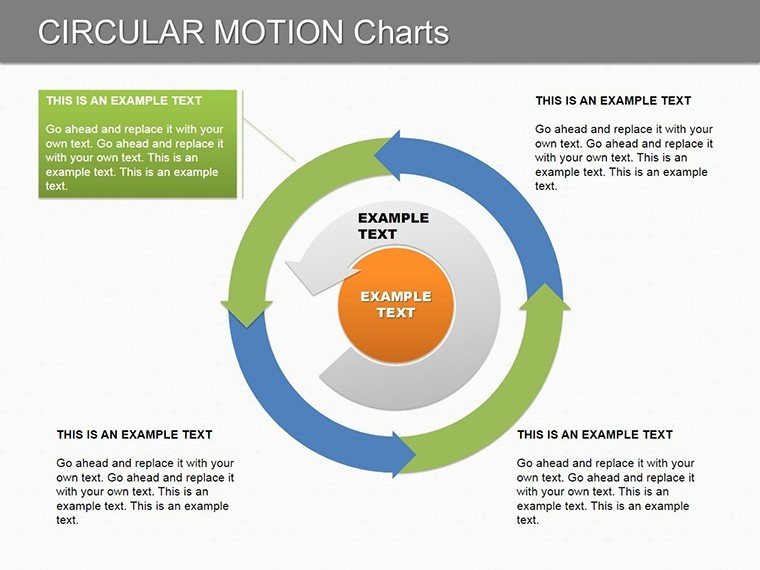
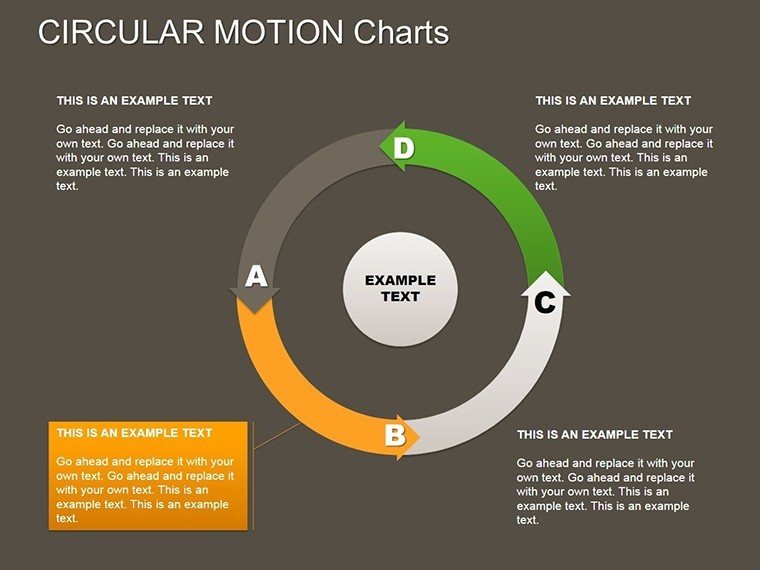
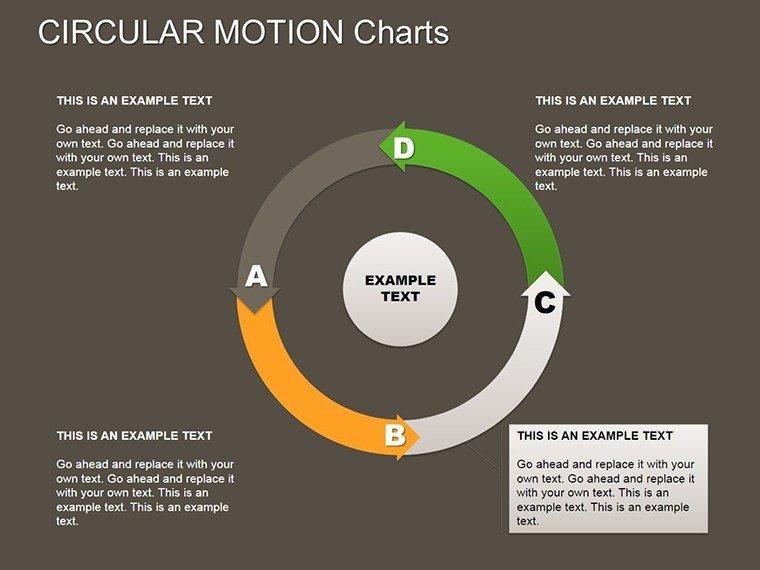
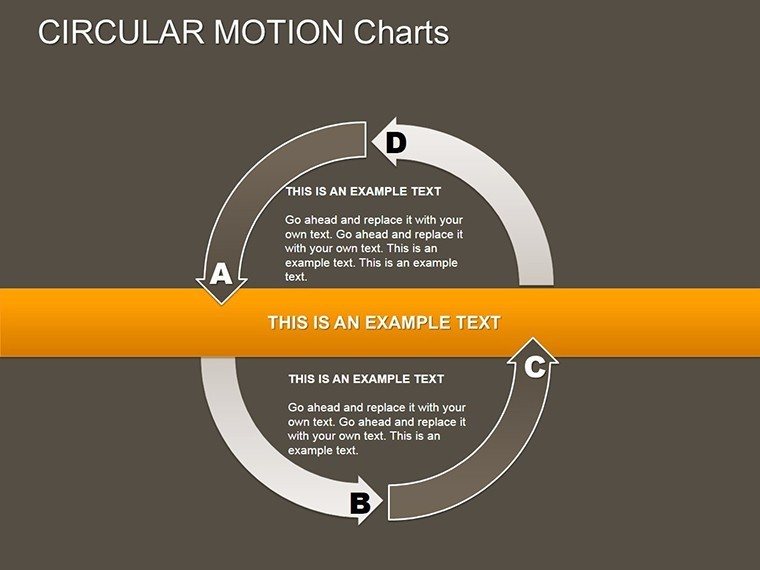
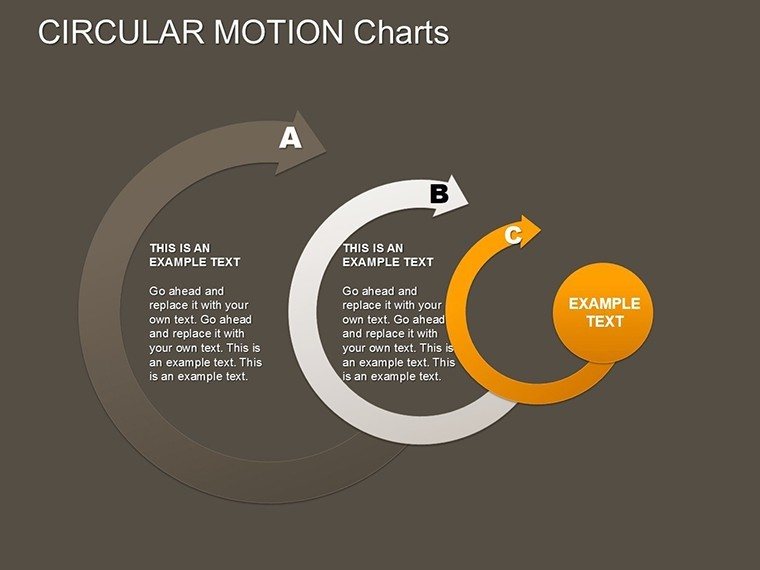
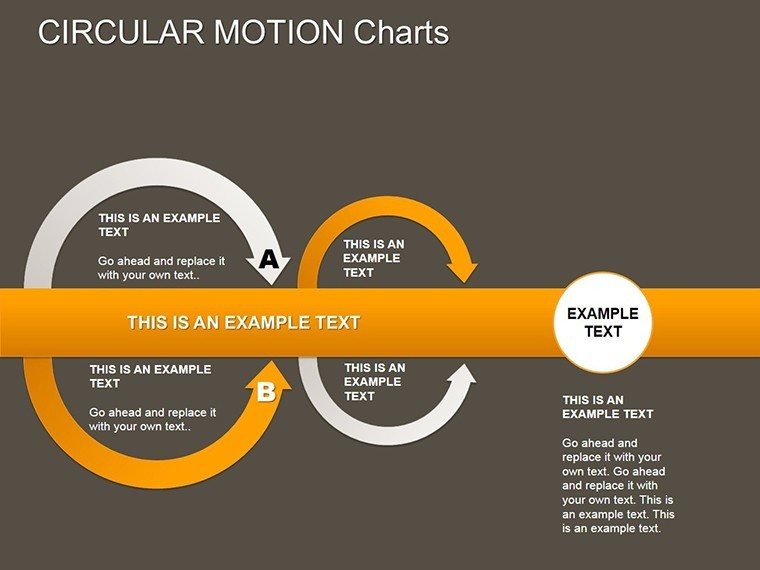
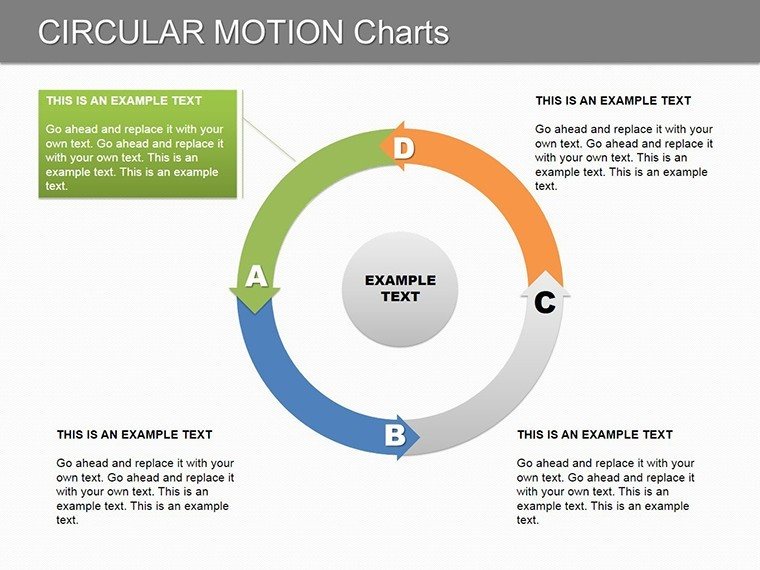
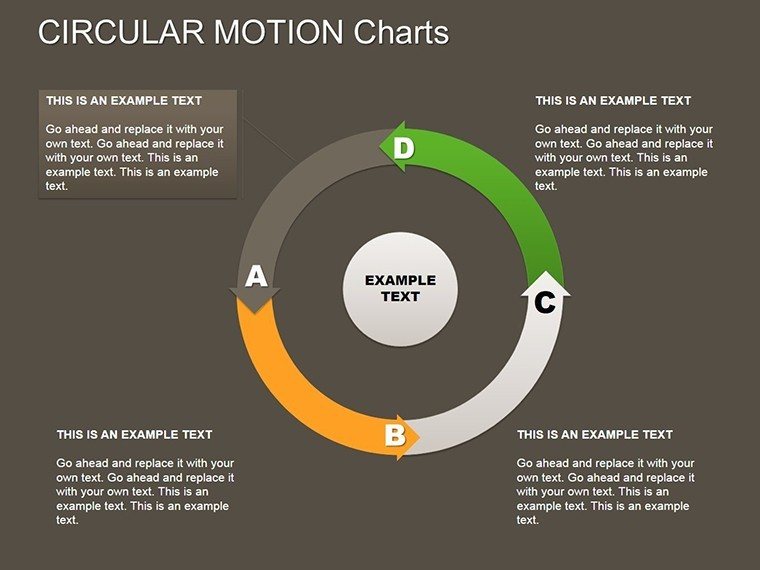
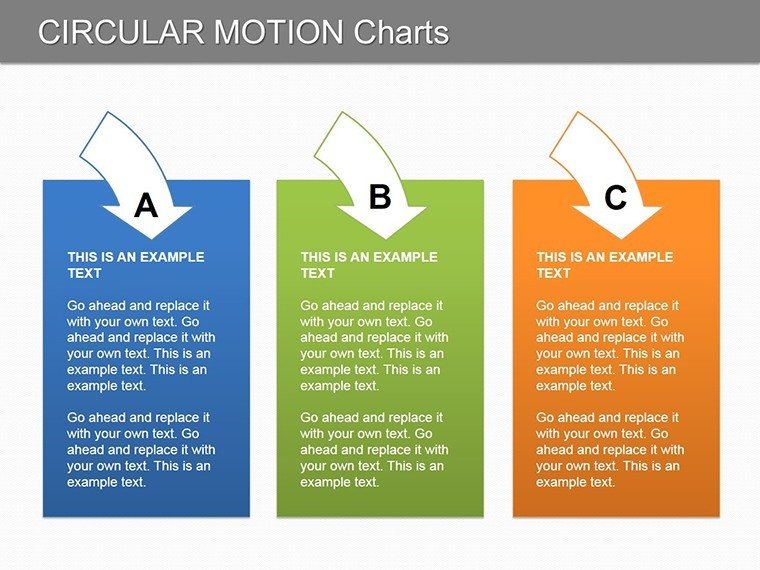
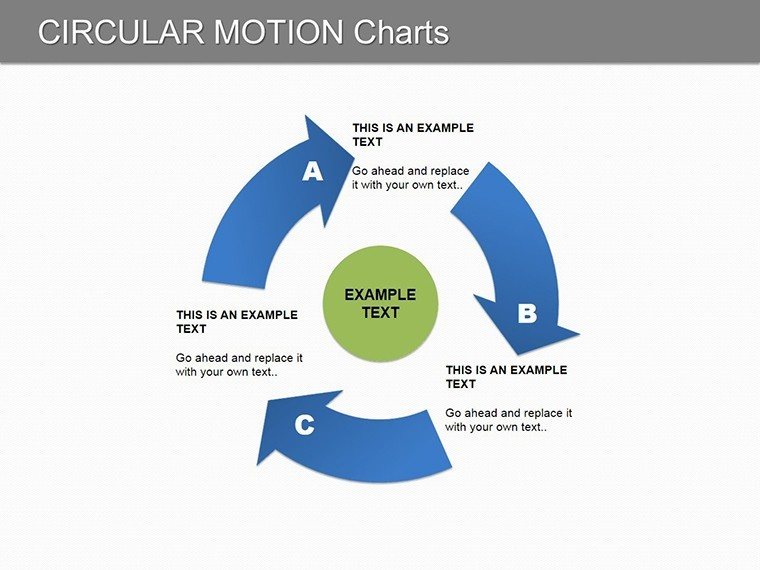
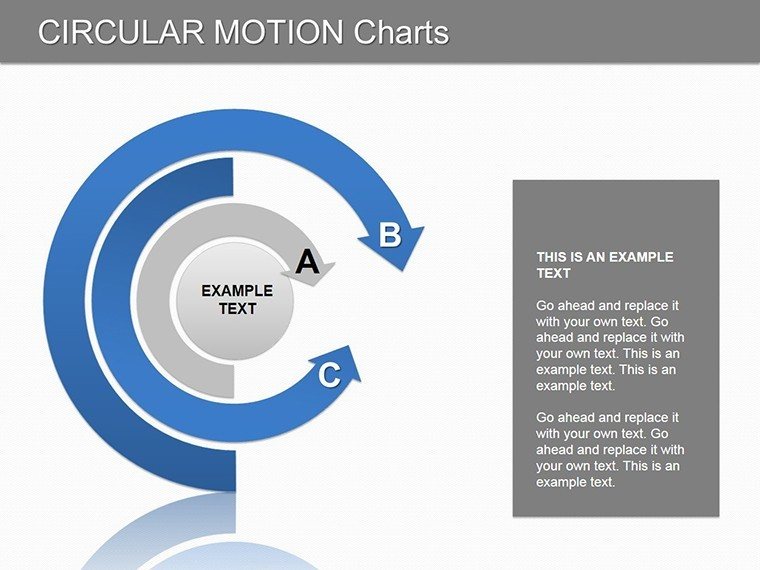
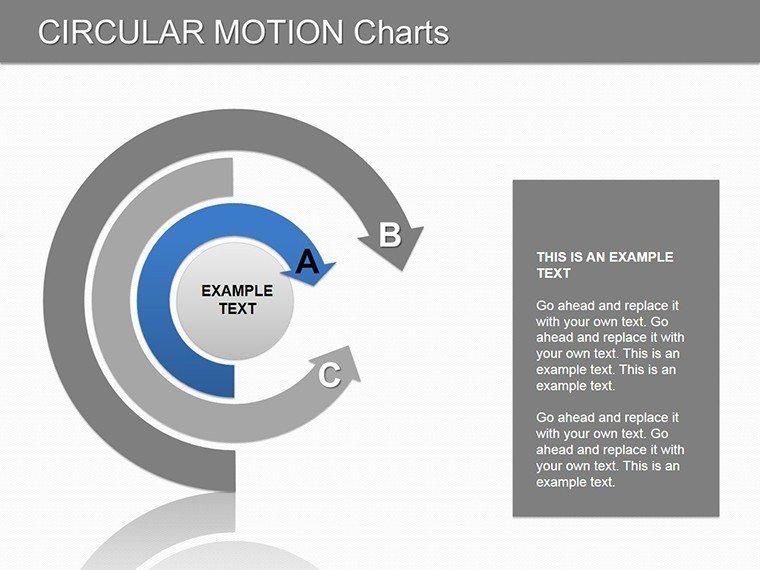
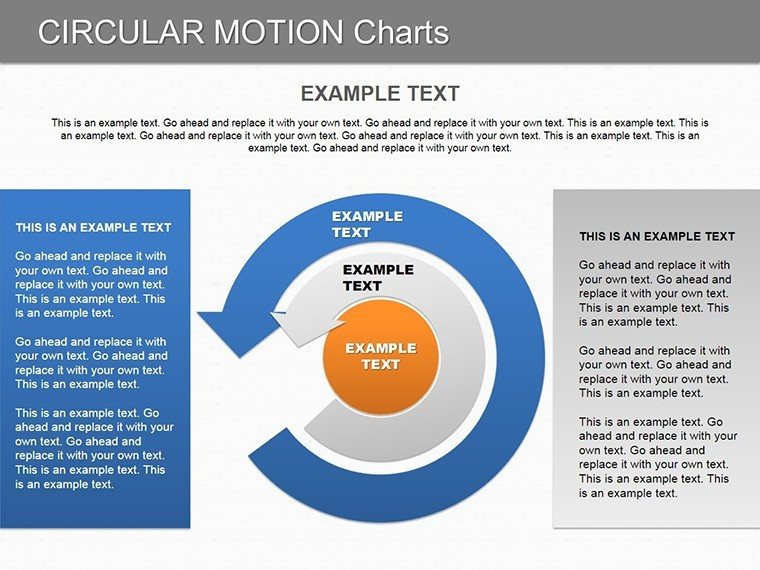
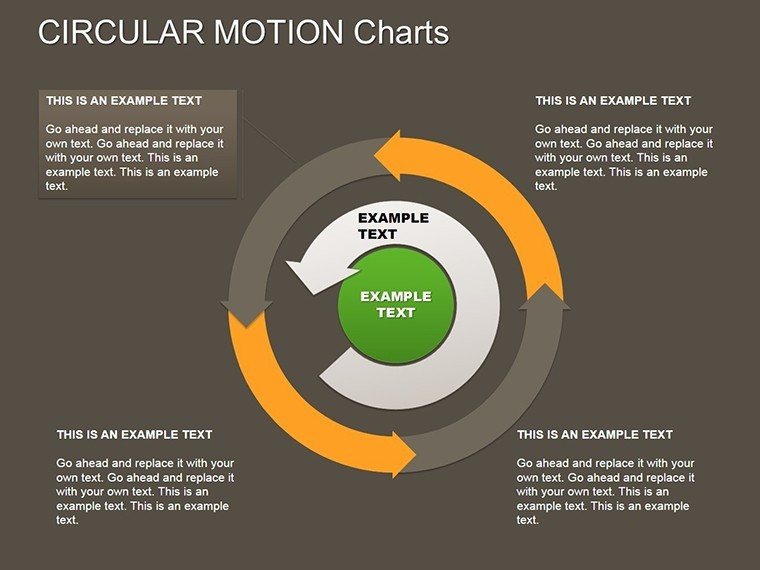
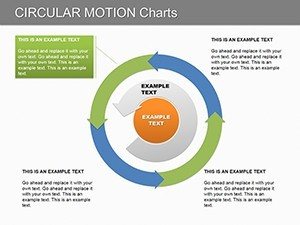
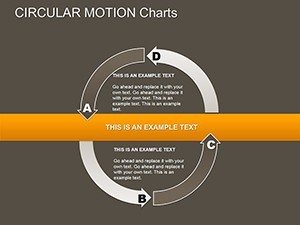
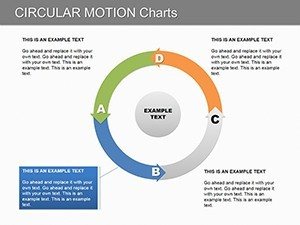
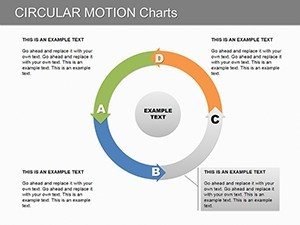
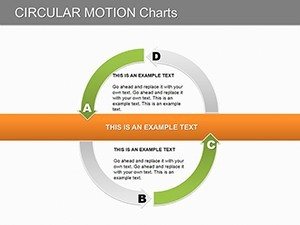
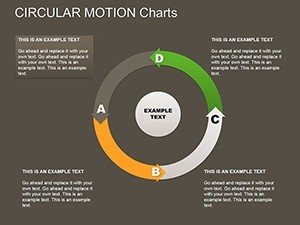
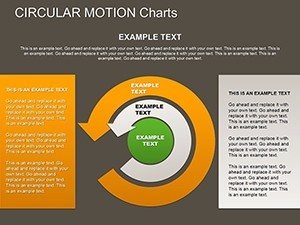
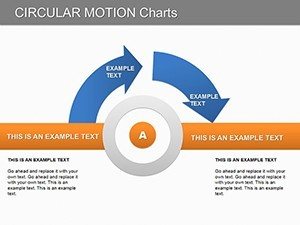
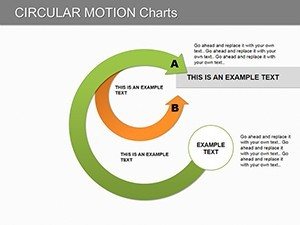
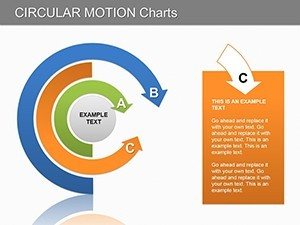
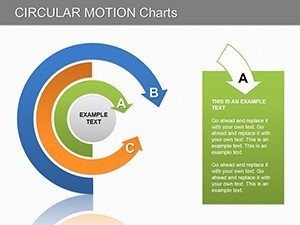
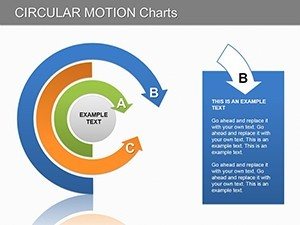
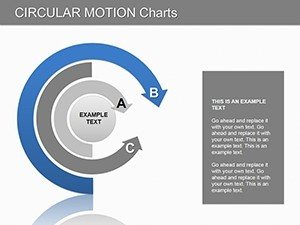
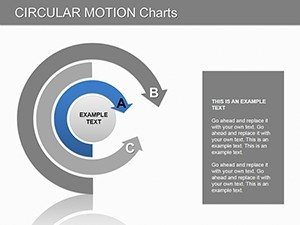
The template includes specialized charts: Velocity-Time Graphs showing periodic oscillations, Acceleration-Time for constant magnitudes, Radial Acceleration Diagrams illustrating inward pulls, Velocity Vector Diagrams with tangential components, and Centripetal Force Diagrams balancing tensions.
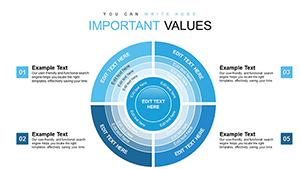
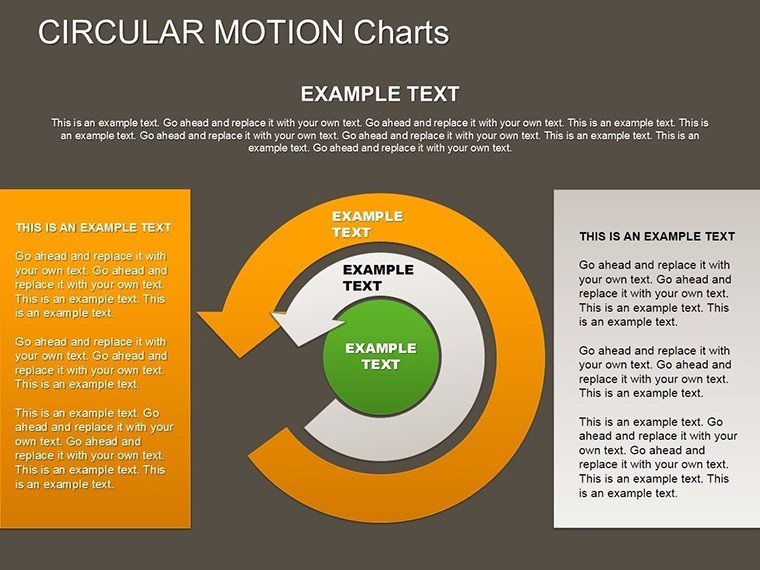
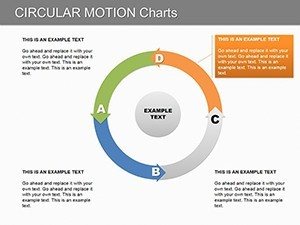
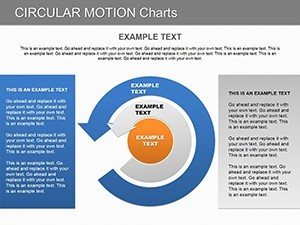
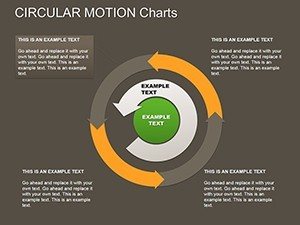
Editability is paramount: adjust scales for different scenarios, like satellite orbits vs. car turns; modify colors to highlight vectors; alter layouts for comparative analyses. This supports rigorous standards from the American Physical Society, ensuring accurate representations.
Interactive elements allow animations of motion paths, simulating real-time dynamics without complex software.
Practical Applications in Education and Research
Educators can use Velocity Vector slides to demo uniform circular motion, as in Ferris wheel examples, enhancing student grasp per PER (Physics Education Research) findings. Researchers might chart non-uniform cases, like roller coasters, for papers on variable accelerations.
In engineering, apply to design analyses, such as bridge swings under wind, aligning with ASME codes. Students preparing for exams benefit from customizable quizzes embedded in slides, reinforcing concepts like Newton's laws in circular contexts.
A case: A high school teacher reported 30% improved test scores after using these visuals to explain centripetal vs. centrifugal misconceptions.
Guided Workflow for Physics Presentations
- Identify Concept: Pick slides matching topics like uniform or variable motion.
- Customize Data: Input parameters like radius or speed for accurate graphs.
- Add Annotations: Label forces and vectors for clarity.
- Animate Dynamics: Set paths to show motion evolution.
- Integrate and Teach: Use in lessons or exports for online platforms.
This echoes lab workflows, bridging theory and practice.
Beyond Basic PowerPoint Graphs
Standard tools lack physics-specific accuracy; this template pre-calibrates for circular metrics, saving time and ensuring precision. Trusted by educators, it boosts credibility in presentations.
Tips from Physics Experts
- Scale axes proportionally for realistic depictions.
- Use arrows for vector directions consistently.
- Incorporate real-world data from sources like NASA.
- Vary speeds in animations to show effects.
- Encourage interactive Q&A with slide notes.
These, inspired by Feynman lectures, enrich teaching.
Our Circular Motion PowerPoint Charts Template orbits around understanding. Illuminate physics - download and propel your explanations forward.
FAQ
Are the diagrams physics-accurate?
Yes, designed with standard equations for velocity, acceleration, and forces.
Suitable for advanced topics?
Absolutely, covers uniform to non-uniform motion with editable parameters.
Can I animate the motions?
Yes, built-in paths simulate circular paths dynamically.
Compatible with online teaching?
Sure, export to video or use in Zoom for virtual classes.
What age group is it for?
High school to university, adaptable for varying complexities.