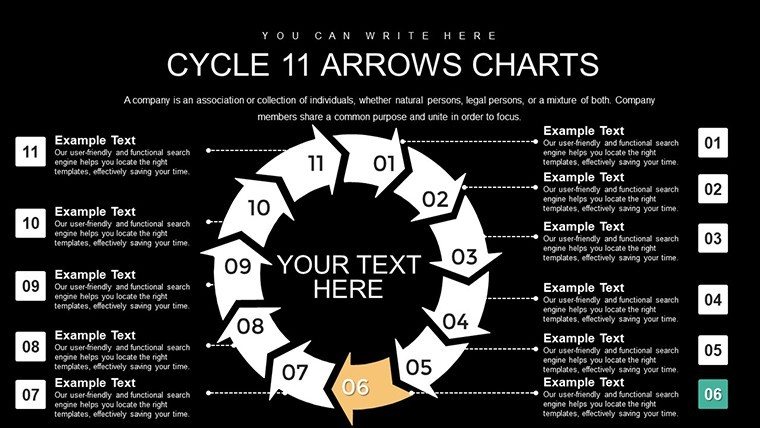
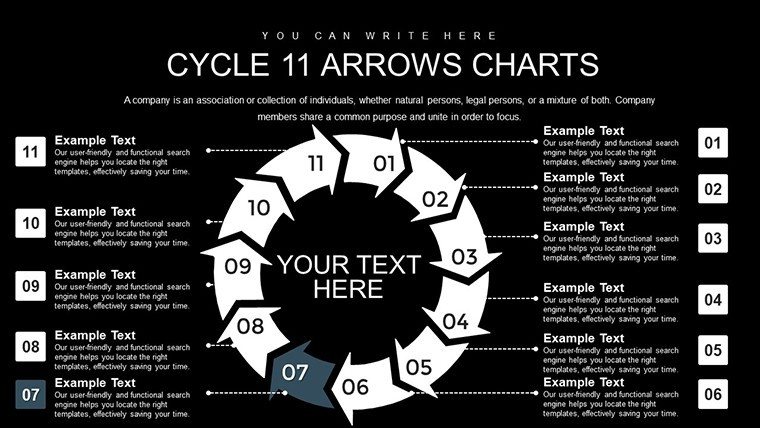
11-Step Cycle Arrows PowerPoint: Detailed Process Mastery


Type: PowerPoint Charts template
Category: Cycle
Sources Available: .pptx
Product ID: PC00773
Template incl.: 28 editable slides
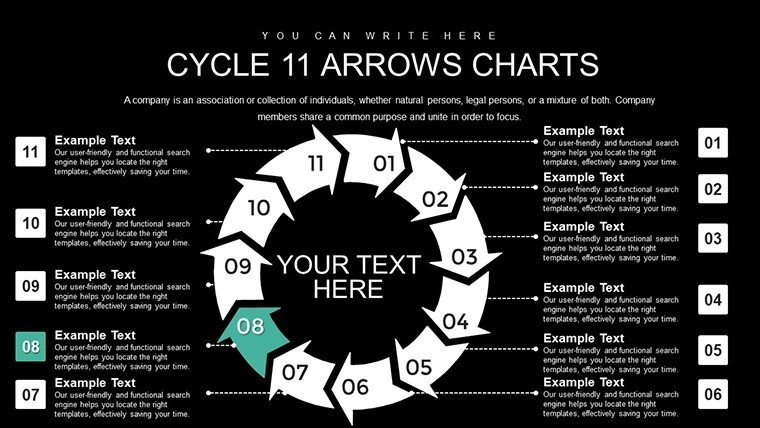
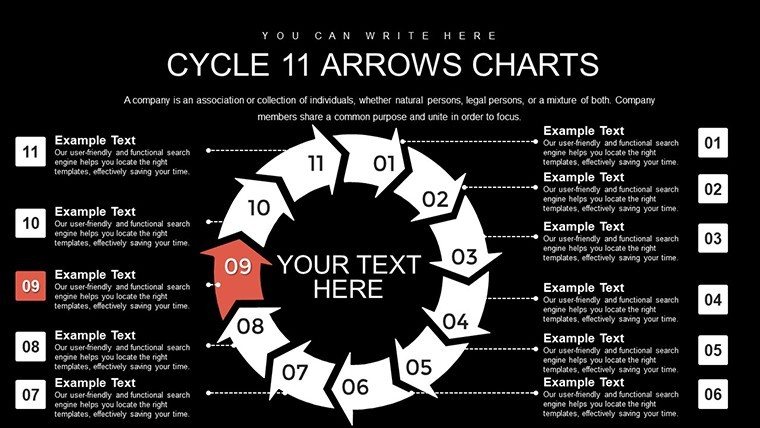
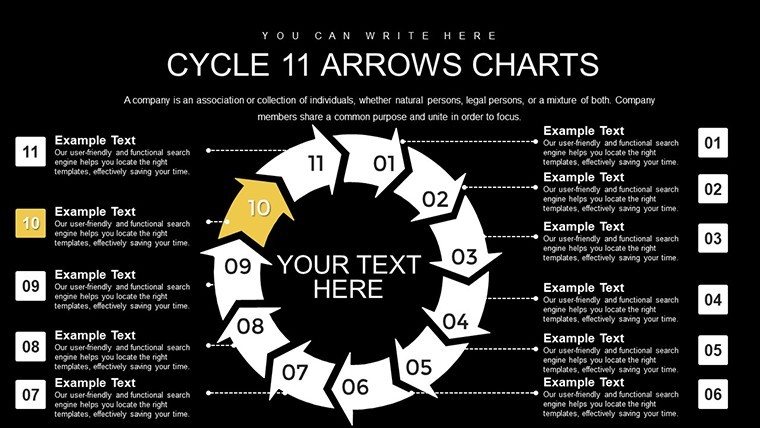
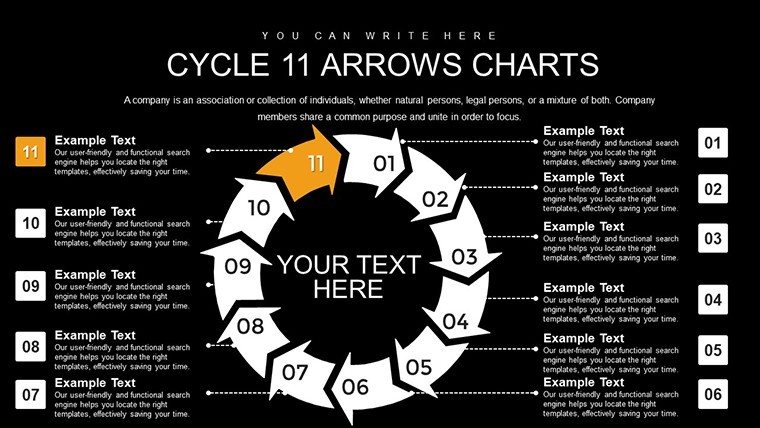
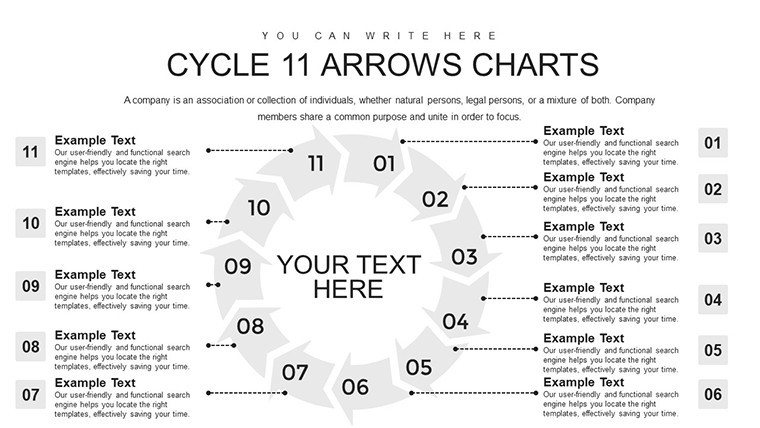
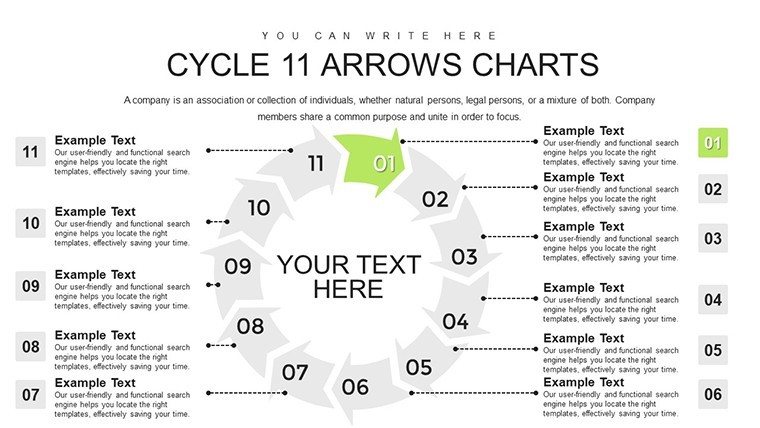
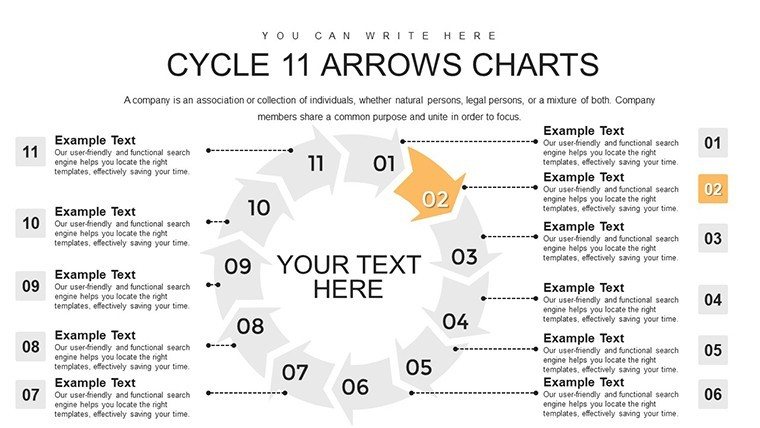
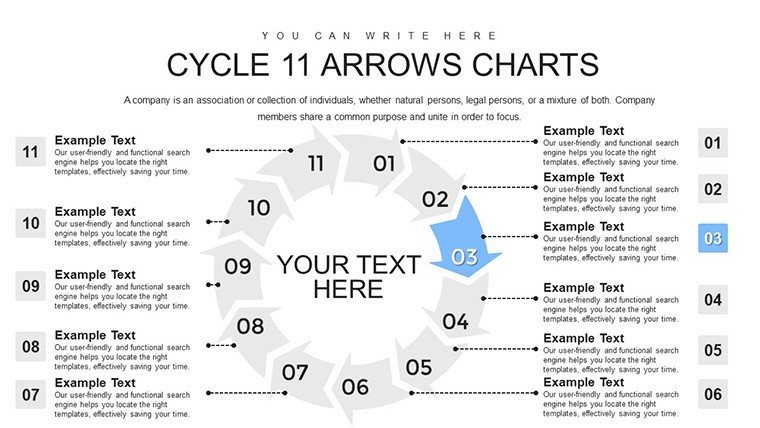
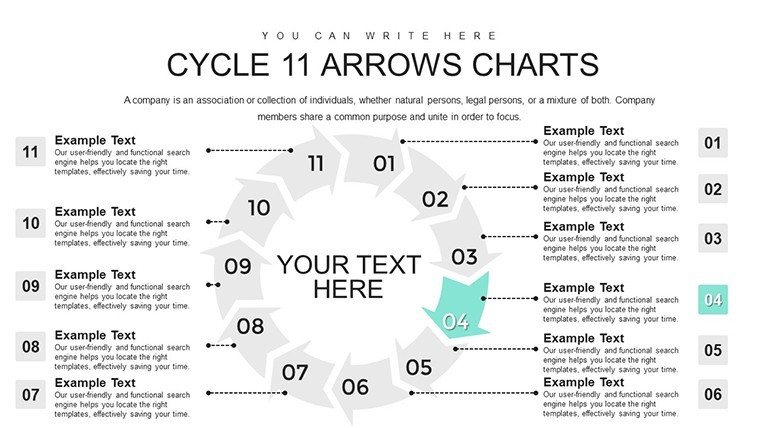
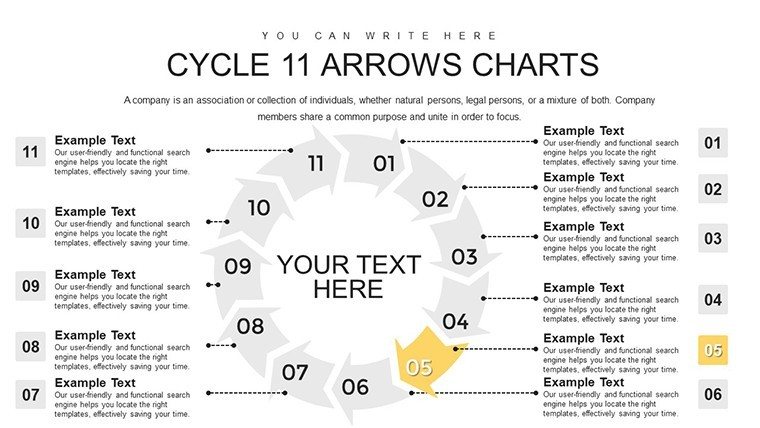
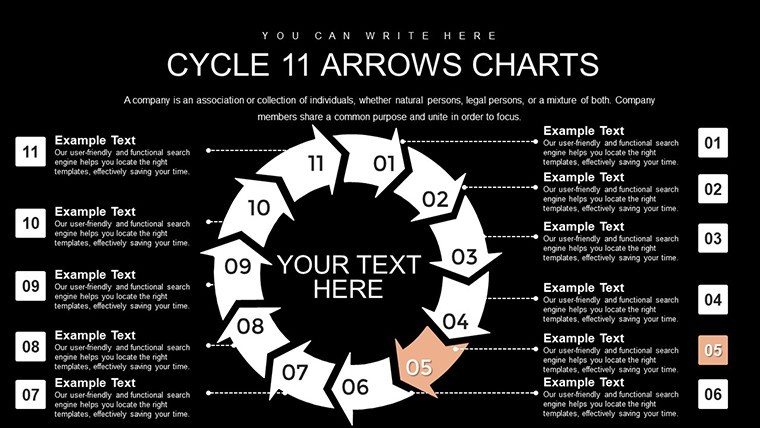
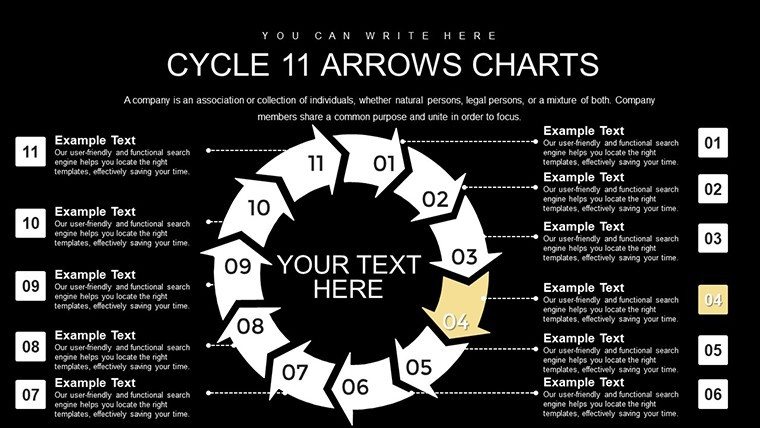
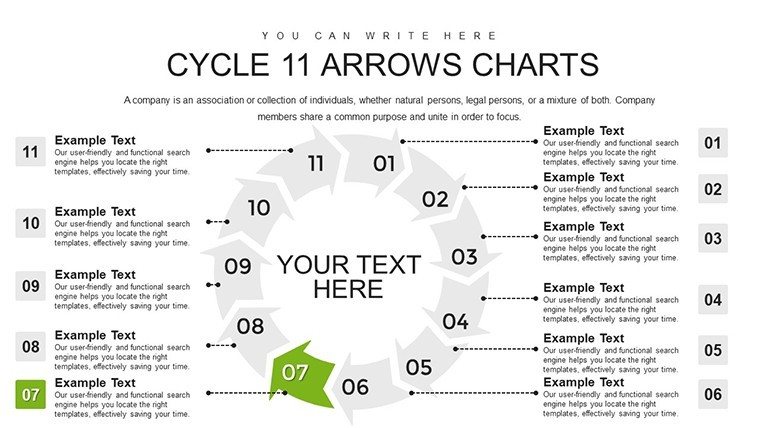
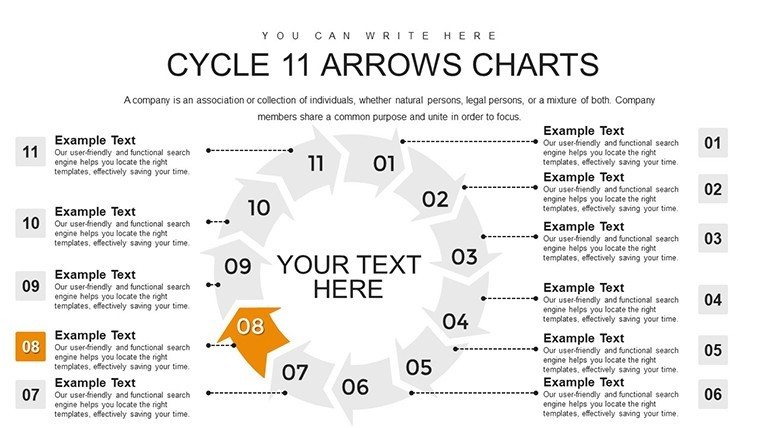
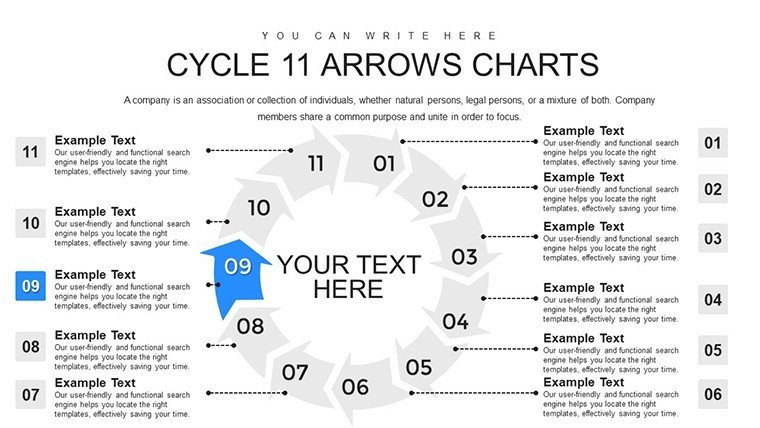
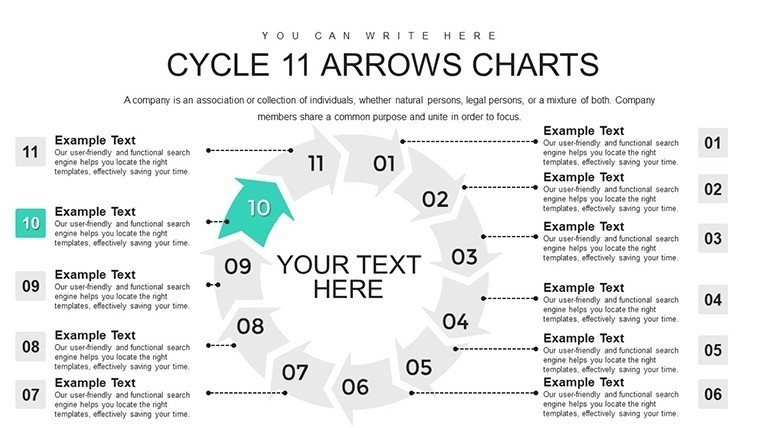
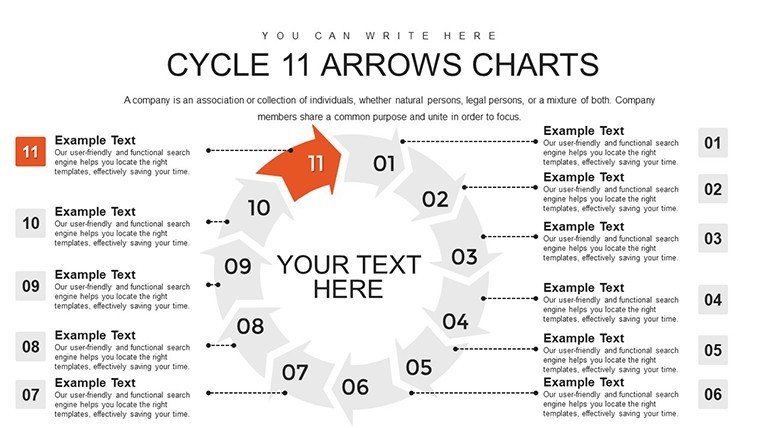
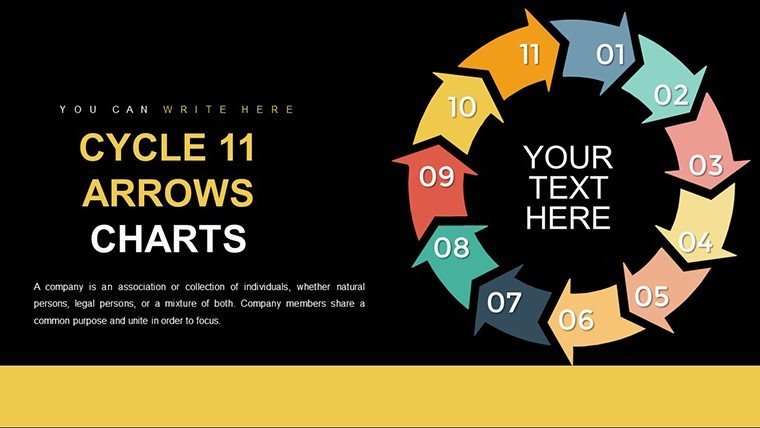
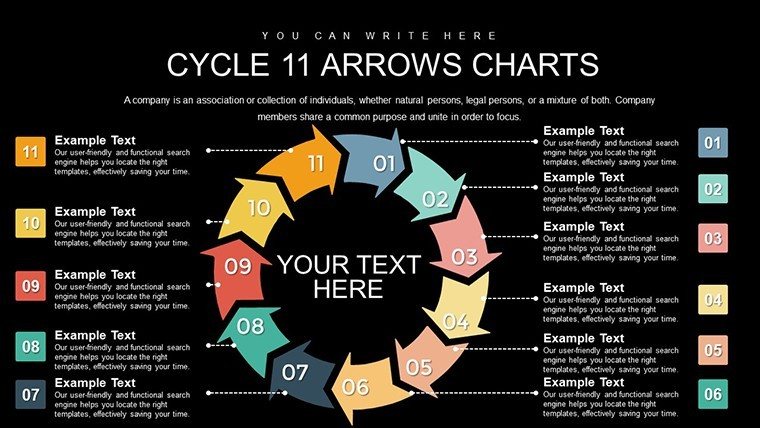
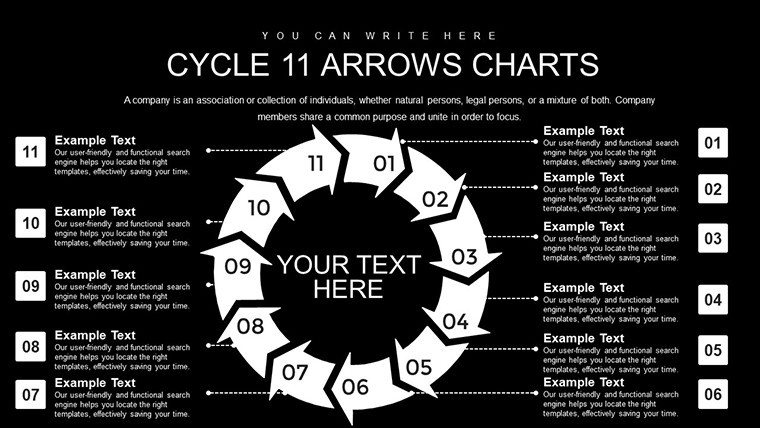
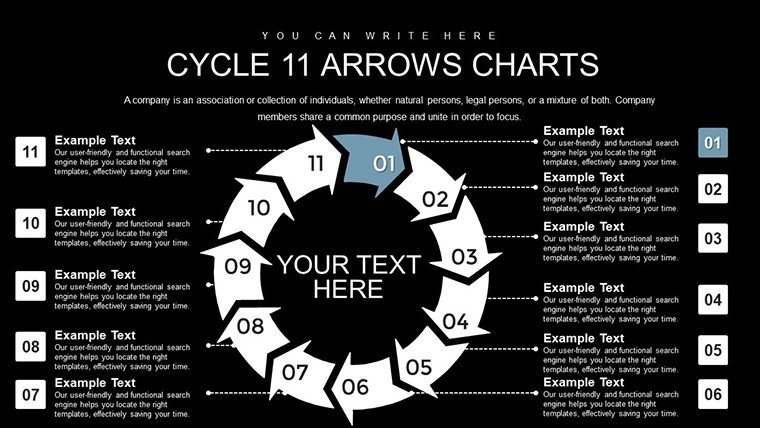
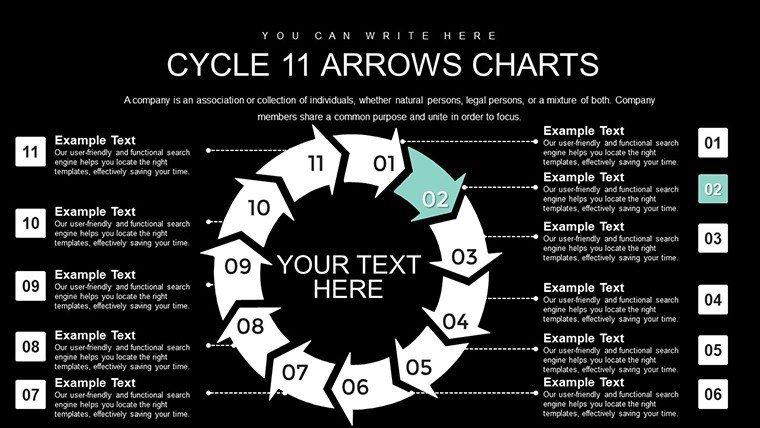
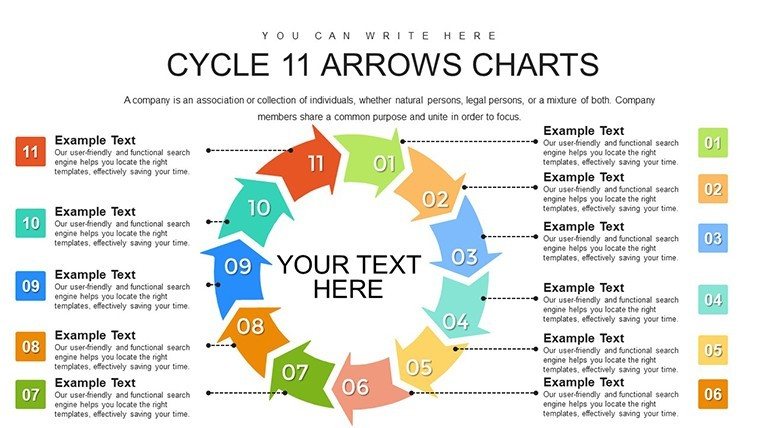
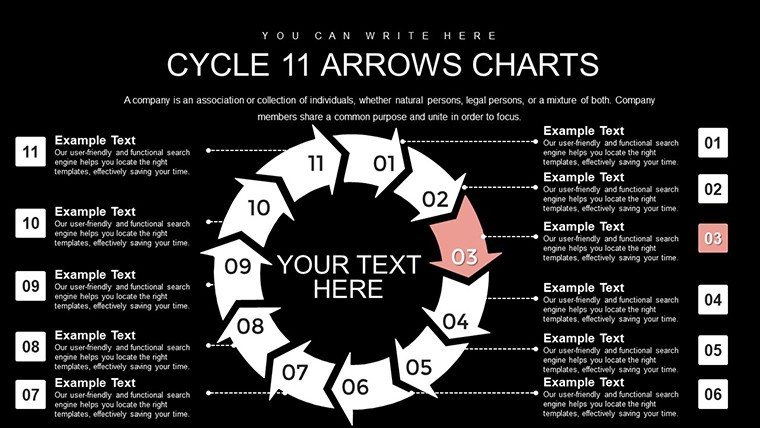
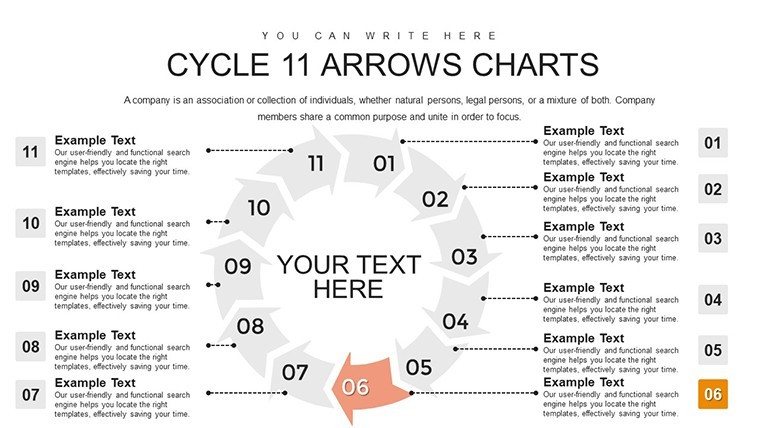
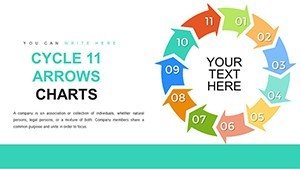
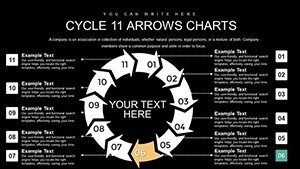
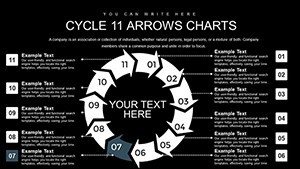
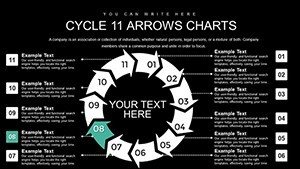
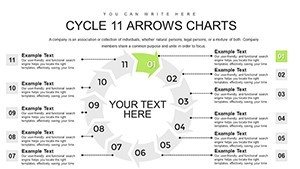
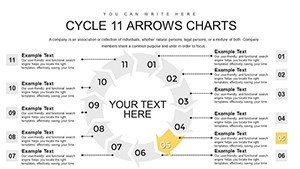
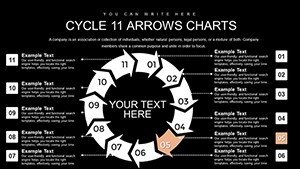
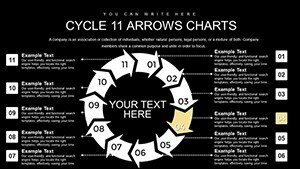
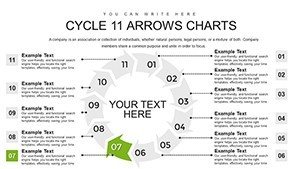
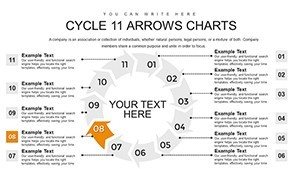
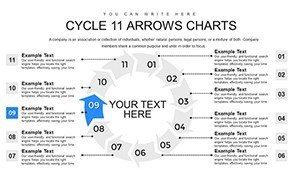
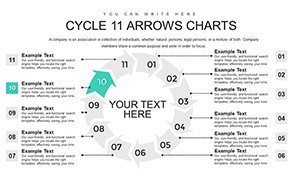
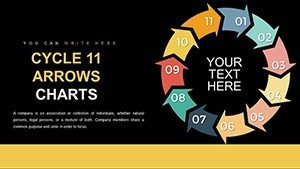
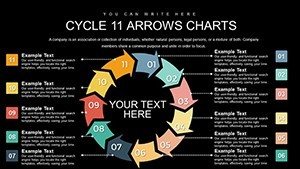
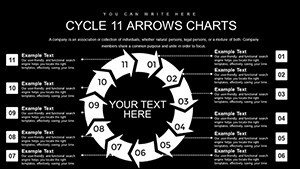
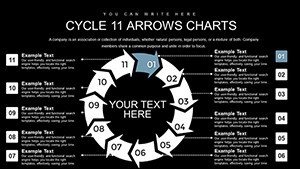
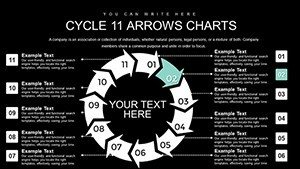
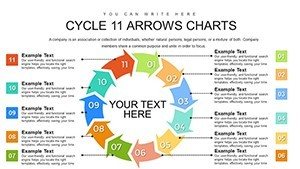
Picture a tool that unravels the most elaborate processes, making them accessible and engaging for any audience. The 11-Step Cycle Arrows PowerPoint Template provides 28 editable slides, centered on an expansive 11-arrow design ideal for in-depth analyses. Suited for consultants dissecting strategies or executives reviewing growth, it facilitates clear communication of interconnected ideas.
Overcoming the hurdles of information overload, this template structures content logically, such as in architectural project lifecycles per AIA guidelines. Its infographic-rich design and PowerPoint integration make customization a breeze, yielding professional results.
Case in point: Marketers at brands like Nike use similar cycles for campaign timelines, enhancing team alignment and outcomes.
Core Features for Comprehensive Storytelling
With 11 stages, the template accommodates nuanced narratives, supported by features that amplify clarity.
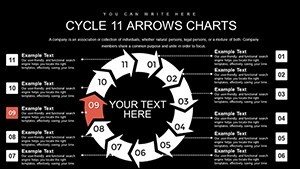
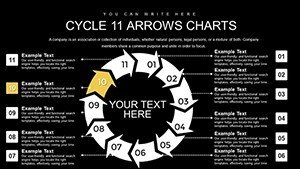
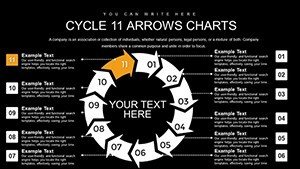
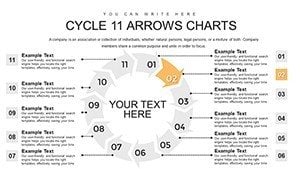
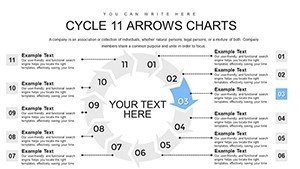
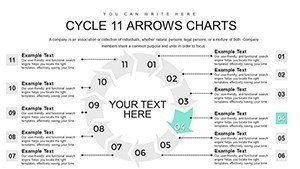
- Interconnected Stages: Illustrate dependencies with fluid arrow connections.
- Extensive Customization: Fine-tune every aspect for bespoke presentations.
- Infographic Elements: Icons and diagrams for visual enhancement.
- Logical Flow Tools: Guides audience through content seamlessly.
- Data Integration: Embed charts for evidence-based cycles.
Inspired by design authorities, it embodies principles from Don Norman's user-centered approach.
Targeted Applications and Insights
For business executives, detail market trends with arrows representing phases, backed by McKinsey studies. Educators engage with consumer journey maps, fostering interactive learning.
Superior to basic options, it offers depth without complexity, ensuring trustworthy visuals.
Step-by-Step Usage Guide
- Download and open the .pptx file.
- Map your 11 steps to the arrows.
- Customize layouts and add visuals.
- Refine flow with transitions.
- Present with confidence.
Sync with project tools like Asana for holistic management.
Advanced Techniques
Build layers for depth, referencing sources like the Journal of Marketing for authenticity.
Elevate your expertise - secure this 11-Step template and redefine your presentations.
Frequently Asked Questions
- Why 11 steps specifically?
- It handles detailed processes that shorter cycles can't.
- Are infographics editable?
- Yes, fully adjustable for your data.
- How to ensure audience retention?
- Use clear flows and visuals to aid memory.
- Compatible with older PowerPoint?
- Works with recent versions; test for best results.
- Can I add external links?
- Yes, hyperlink for interactive elements.
- What if I need more slides?
- Duplicate and adapt as required.