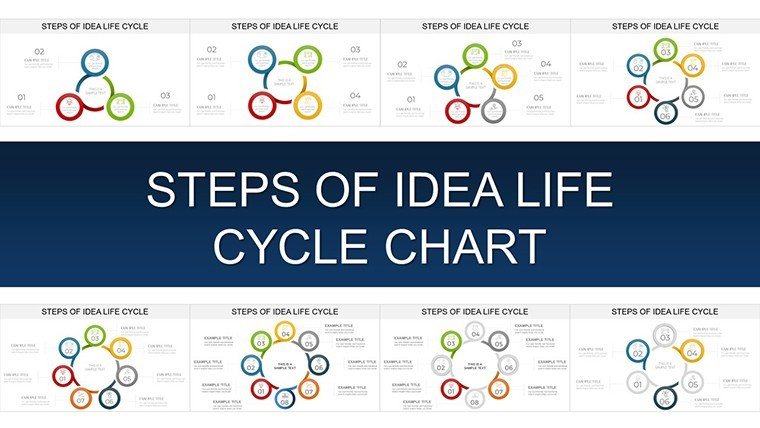
Presenting the Idea Life Cycle: Step-by-Step PowerPoint Charts for Innovation


Type: PowerPoint Charts template
Category: Cycle
Sources Available: .pptx
Product ID: PC00906
Template incl.: 31 editable slides
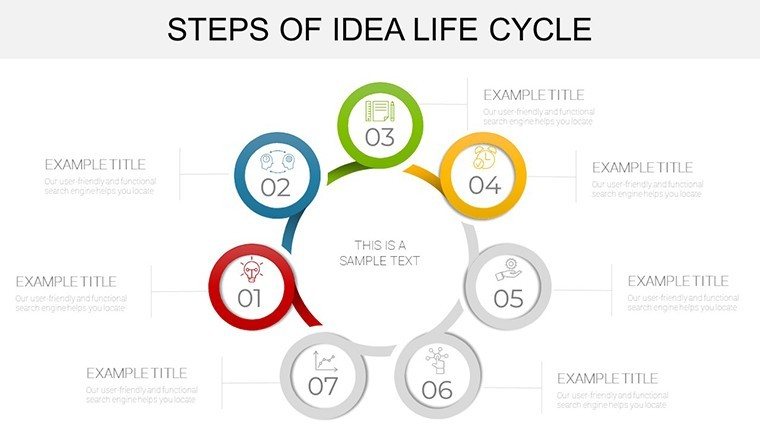
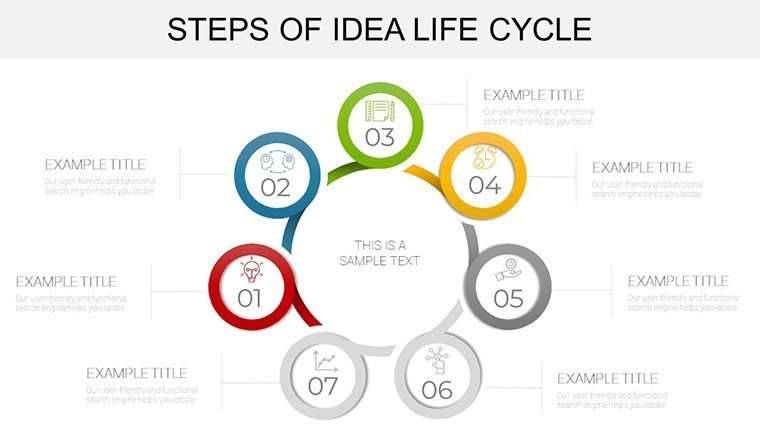
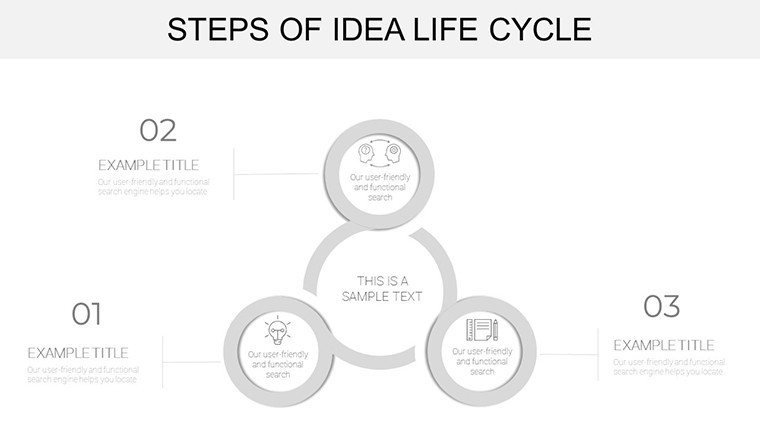
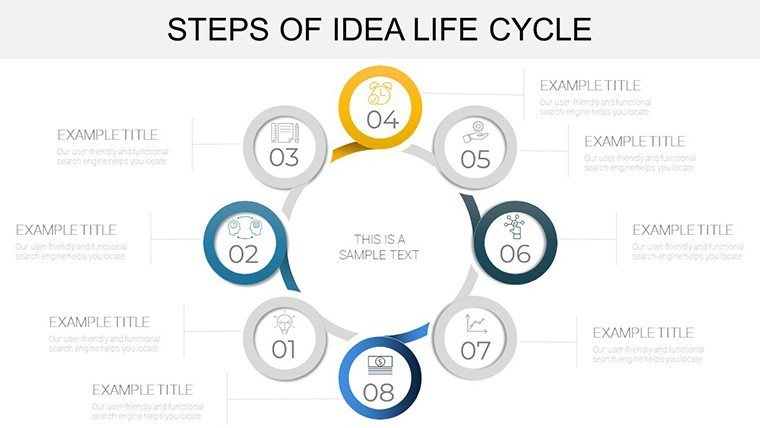
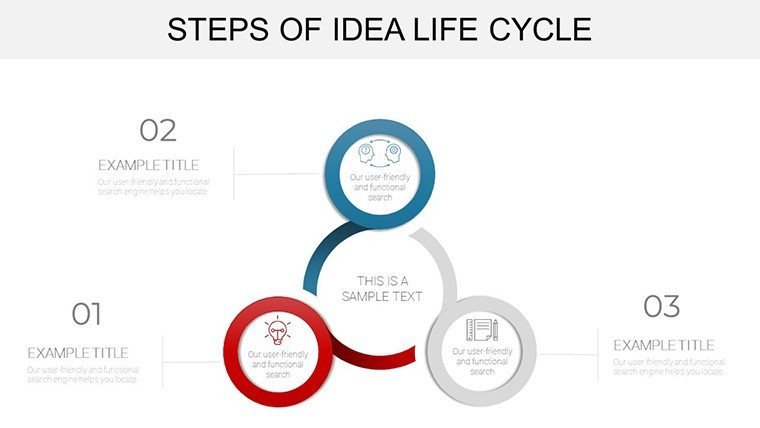
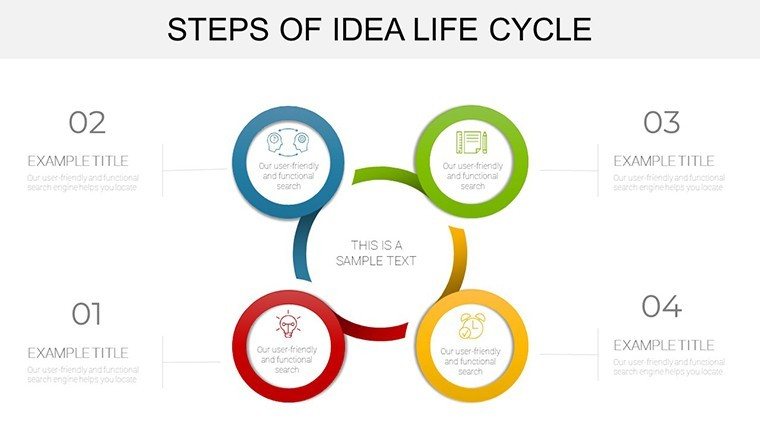
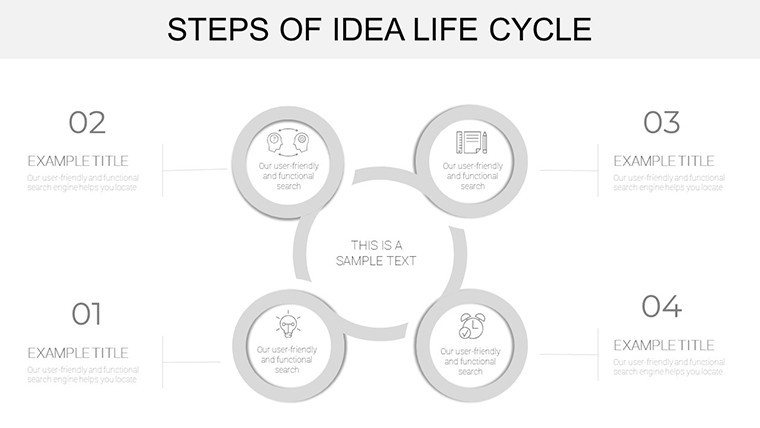
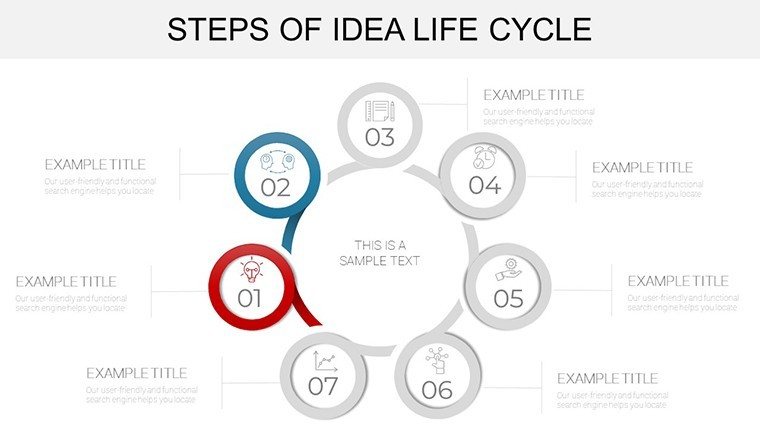
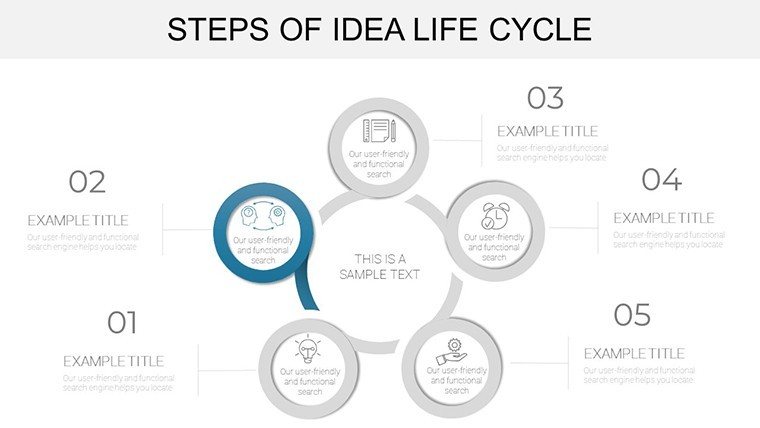
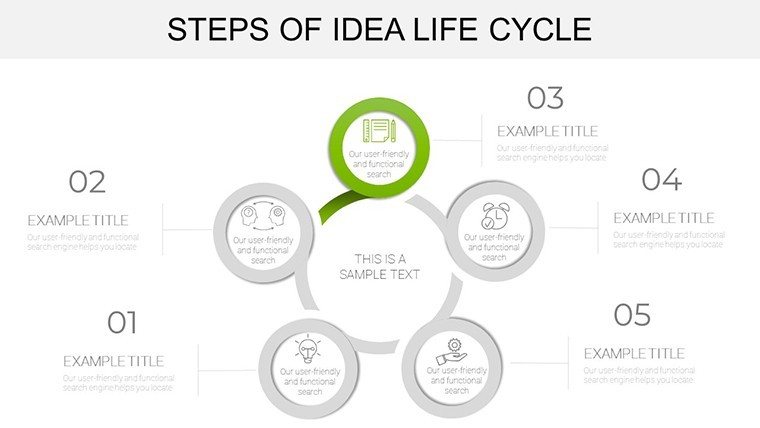
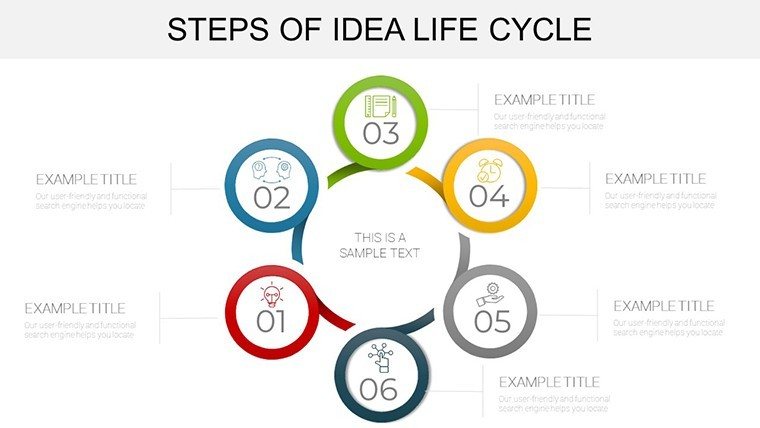
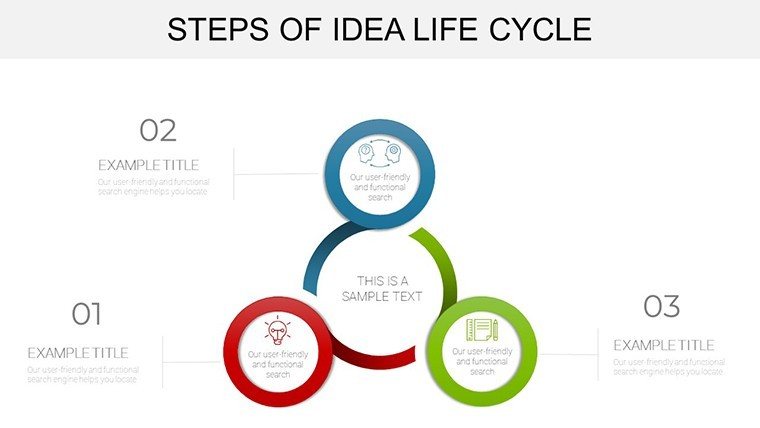
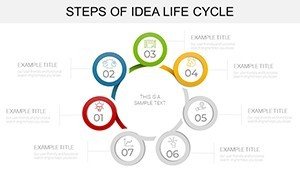
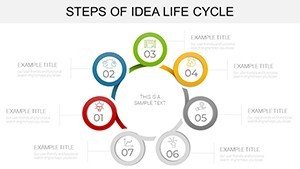
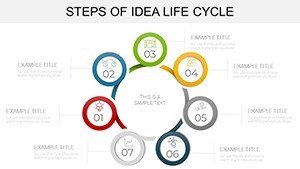
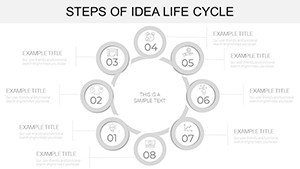
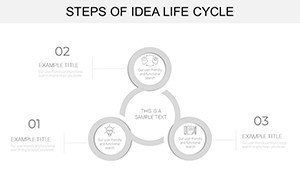
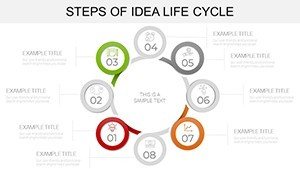
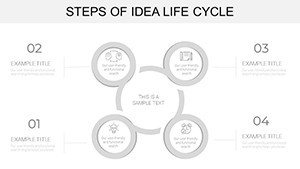
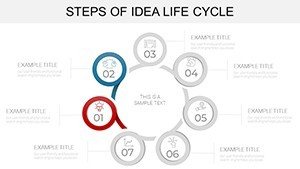
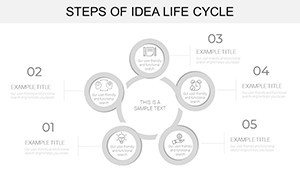
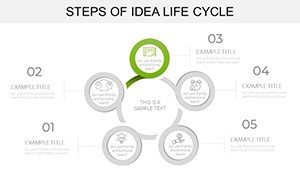
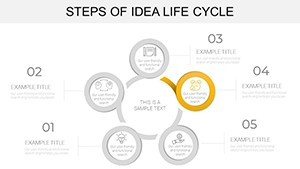
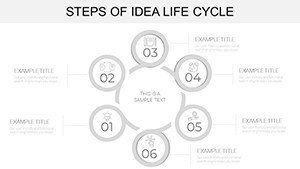
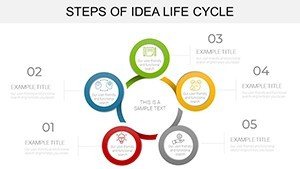
Every great innovation starts as a spark - nurture it through our Idea Life Cycle PowerPoint Charts Template. Featuring 31 editable slides, this resource guides you from ideation to maintenance, using clear visuals to demystify the process. Perfect for product managers, entrepreneurs, and R&D teams, it draws on frameworks like Design Thinking from IDEO, ensuring your presentations are both strategic and inspiring.
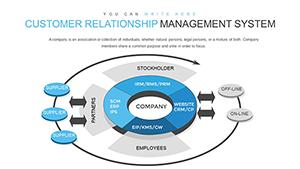
Whether launching a startup pitch or refining corporate strategies, this cycle-themed template helps articulate journeys with flowcharts and columns, fostering collaboration and buy-in. Compatible with PowerPoint and Google Slides, it's built for real impact, echoing successes like how Airbnb visualized their growth cycles to secure funding.
Core Features Driving Creative Flows
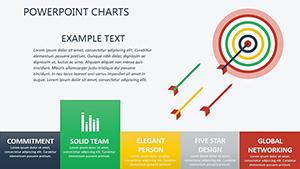
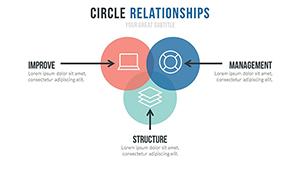
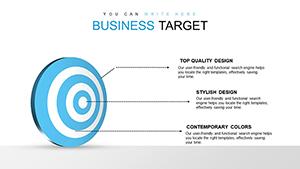
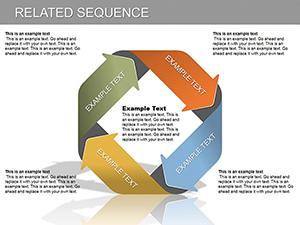
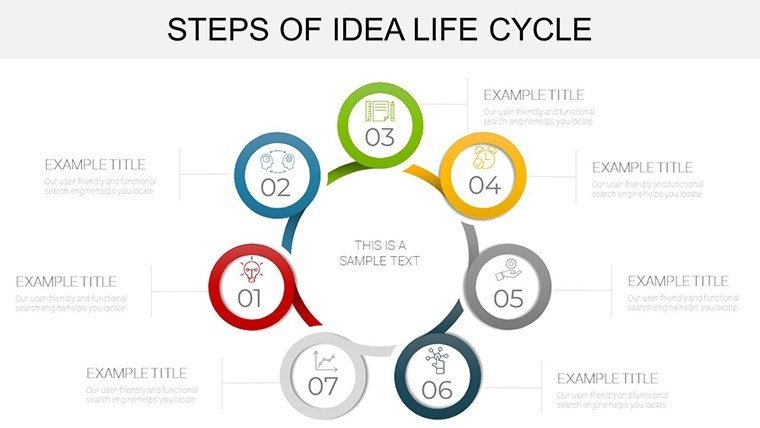
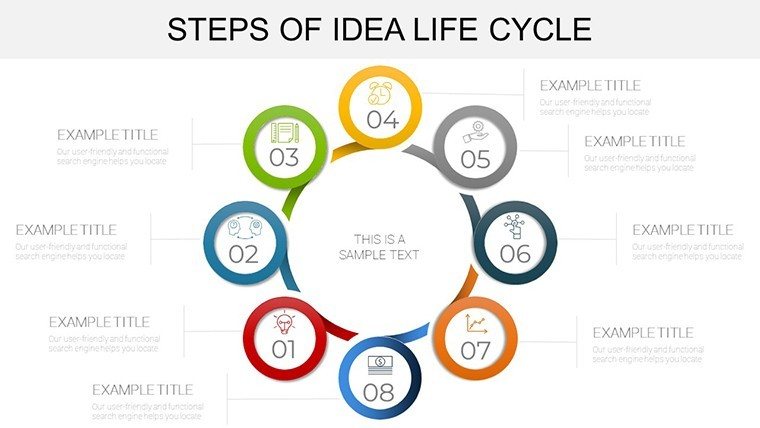
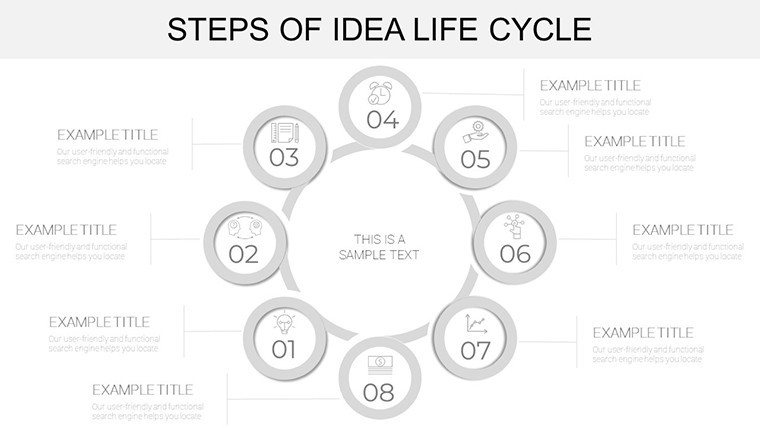
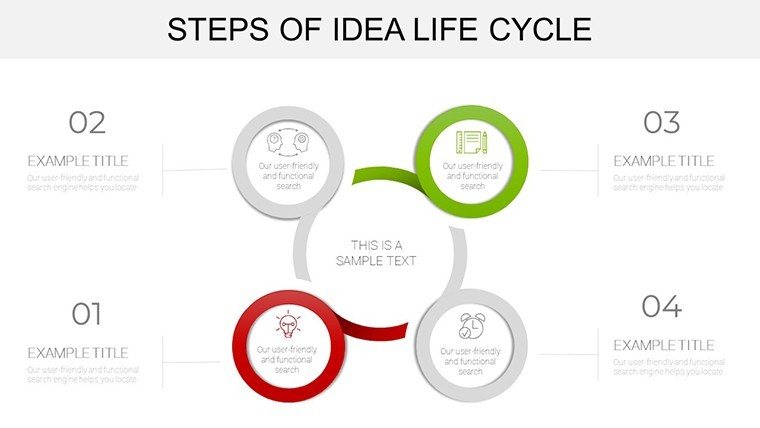
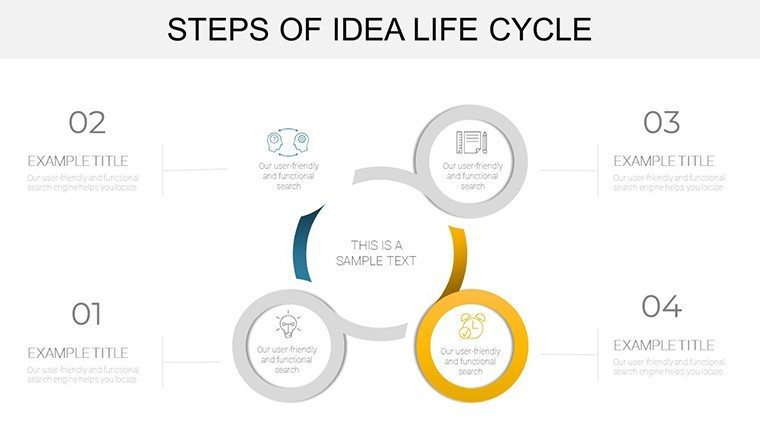
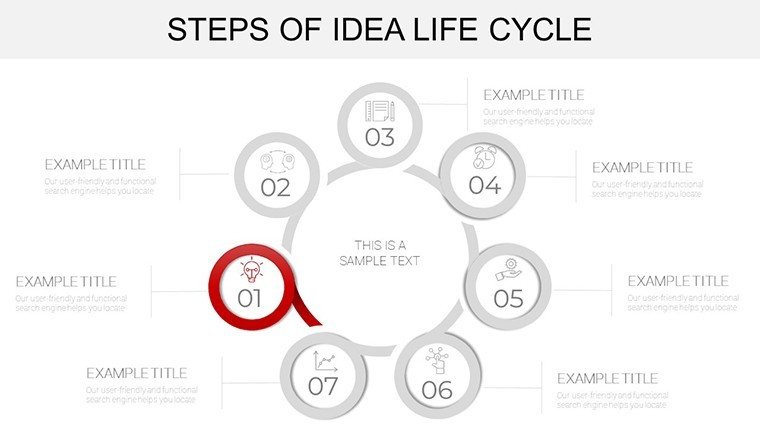
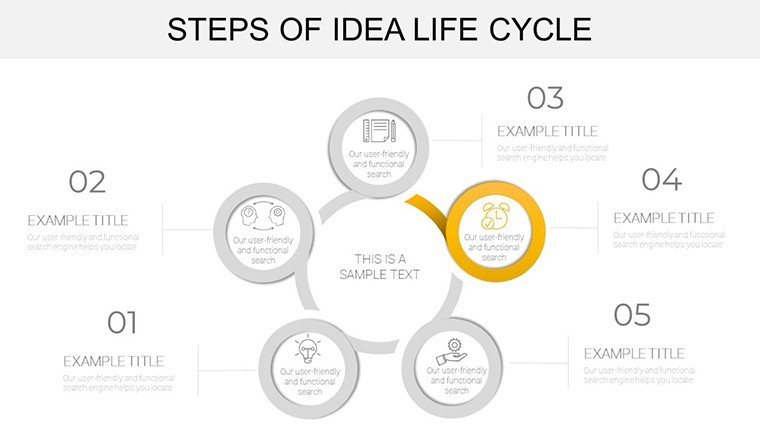
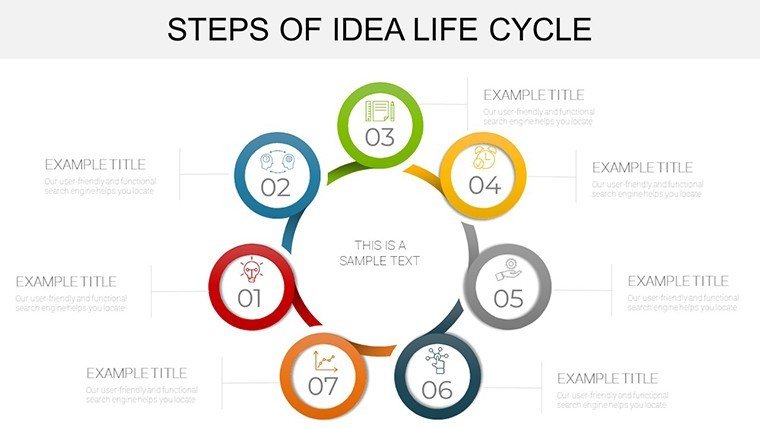
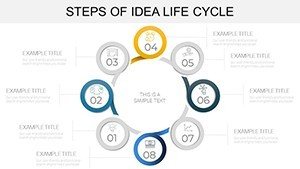
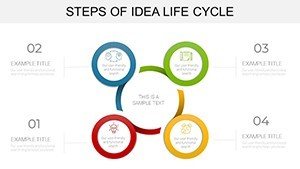
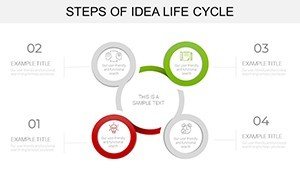
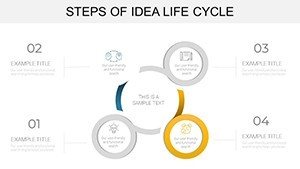
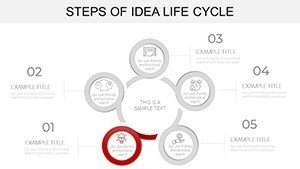
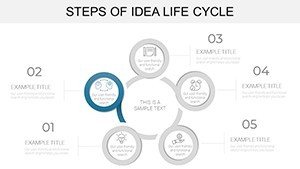
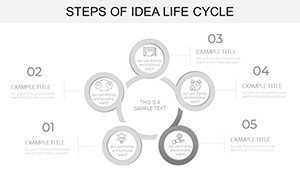
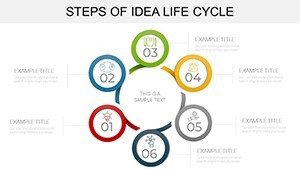
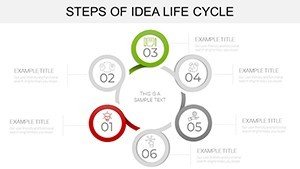
Harness column charts for stage breakdowns or flowcharts for seamless transitions, all customizable with brand-consistent colors and fonts. Symbols like arrows enhance navigation, making complex cycles accessible.
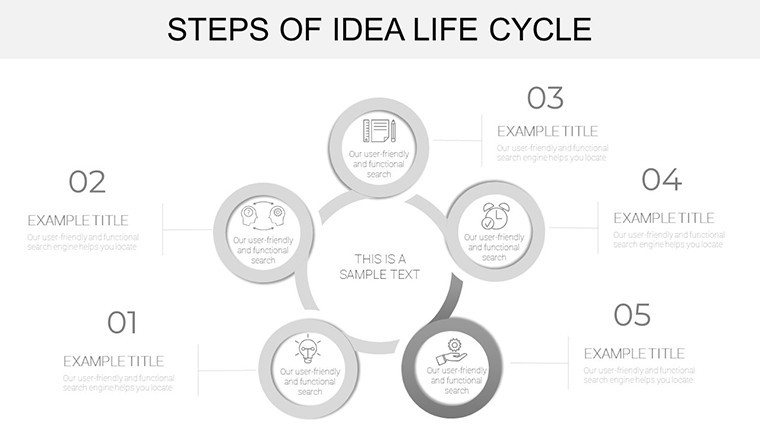
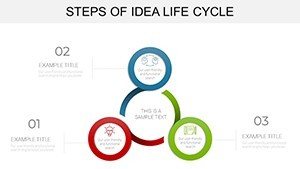
- Stage-Specific Charts: Dedicated visuals for ideation, validation, etc.
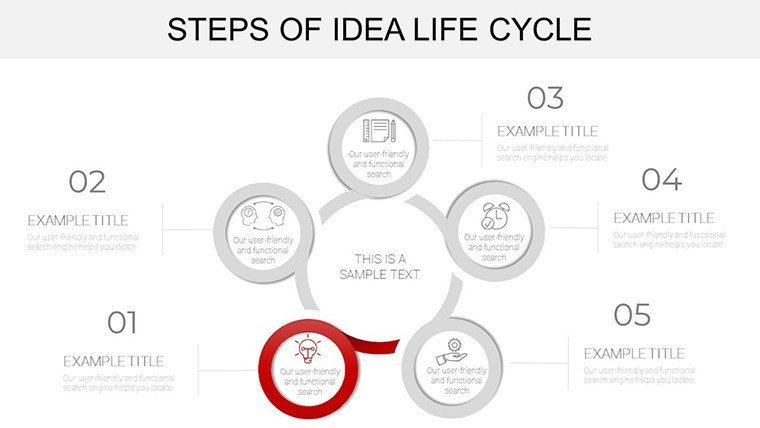
- Visual Enhancements: Arrows, checks for progress tracking.
- Text Integration: Boxes for timelines, resources.
- Editable Elements: Adapt to your unique idea paths.
This setup promotes concise, bullet-point clarity for quick comprehension.
Slide-by-Slide Insights
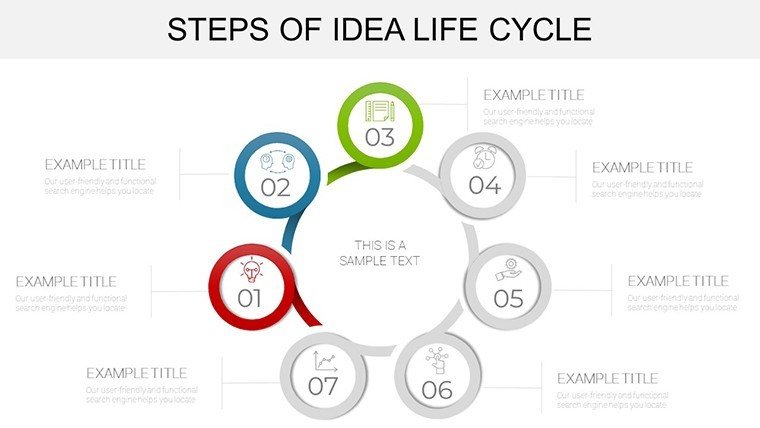
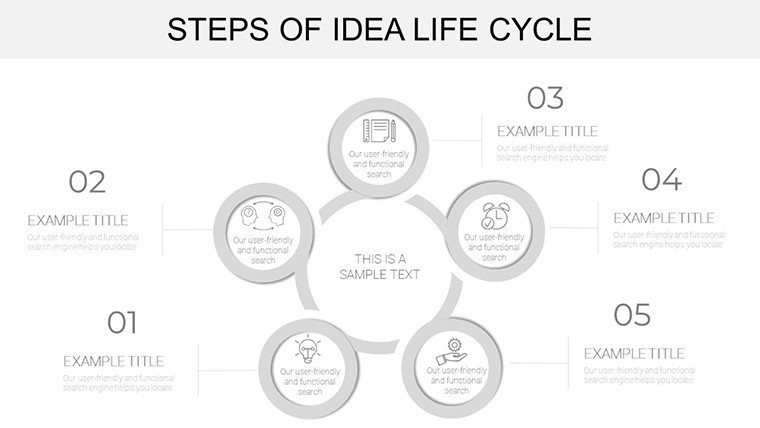
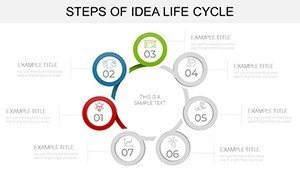
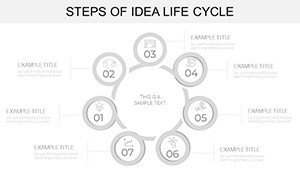
31 slides unfold the cycle: Early ones brainstorm with mind maps, middles validate with data charts, later ones launch with Gantt views. Align with standards like PMI for project management authority.
Targeted Use Cases for Growth
A strategist maps product development, using stages to align teams. Or an innovator pitches to VCs with visualized milestones, boosting persuasion.
- Innovation Workshops: Guide groups through cycles interactively.
- Strategy Sessions: Outline R&D phases with metrics.
- Pitch Decks: Showcase idea evolution compellingly.
- Review Meetings: Assess maintenance with loop diagrams.
Inspired by cases like Google's 20% time policy visualizations, setup is easy: Choose chart, populate stages, add details, present.
Tips from Innovation Experts
Use consistent symbols for familiarity, per cognitive load theory. Embed stakeholder notes for depth, ensuring trustworthiness.
Surpasses basics with cycle-specific tools for iterative processes.
Unlock Potential in Your Ideas
507 ratings confirm its value at $18 - invest in clarity today.
Bring your ideas to life - download and chart your path to success.
Frequently Asked Questions
- How detailed are the stage customizations?
- Fully flexible for any cycle variation.
- Works with Google Slides?
- Yes, for collaborative editing.
- Suited for what fields?
- Innovation, business, product dev.
- Integrate external data?
- Easily via text boxes.
- Enhances idea presentations how?
- Through visual flow and structure.
- Guides included?
- Intuitive, with site support.