Tree PowerPoint Charts
These tree diagram PowerPoint templates contain ready-made hierarchies, decision trees, and org charts in PPTX format. They serve consultants, HR leads, and product managers who need to show relationships instead of listing bullets.
Formerly known as chart templates - this collection now covers tree diagrams, hierarchies, and decision trees.
A product manager at a SaaS company faced a 48-hour deadline to explain feature prioritization to the executive team. Starting from scratch meant hours spent aligning every branch length and matching label fonts to brand guidelines. Once the file opened, the structure already existed; swapping data took minutes and the slide read as a clear recommendation.
Download the layout that matches your data volume and skip the alignment work.
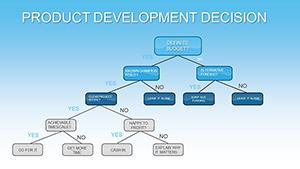 (912)
(912) Product Development Decision Charts - Fully Editable PPTX | ImagineLayoutID: #PC00836$12.00
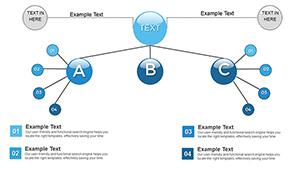 (659)
(659) Organizations Work PowerPoint Charts TemplateID: #PC00820$15.00
 (747)
Org Tree Animated PowerPoint Charts - Ready to Present | ImagineLayoutID: #PC00819$16.00
(747)
Org Tree Animated PowerPoint Charts - Ready to Present | ImagineLayoutID: #PC00819$16.00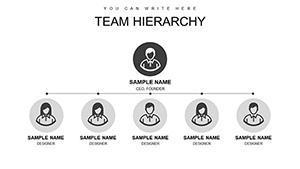 (591)
(591) Professional Column Chart PowerPoint Template - Fully Editable & Instant DownloadID: #PC00741$15.00
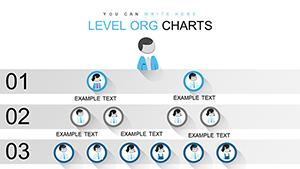 (858)
Free Level Org PowerPoint Charts TemplateID: #PC00635free
(858)
Free Level Org PowerPoint Charts TemplateID: #PC00635free (662)
(662) Interrelationships Between Factors PowerPoint Charts Template: Map Connections EffortlesslyID: #PC00596$16.00
 (1064)
Animations Components PowerPoint Chart PresentationID: #PC00481$16.00
(1064)
Animations Components PowerPoint Chart PresentationID: #PC00481$16.00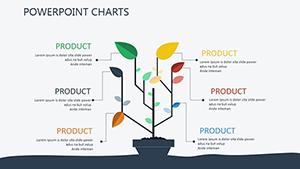 (1192)
Technical Analysis PowerPoint Charts Template - Fully Editable & Instant DownloadID: #PC00386$18.00
(1192)
Technical Analysis PowerPoint Charts Template - Fully Editable & Instant DownloadID: #PC00386$18.00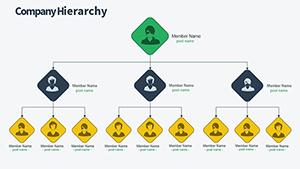 (790)
Organization Structure PowerPoint Charts Template: Build Hierarchies with ClarityID: #PC00338$17.00
(790)
Organization Structure PowerPoint Charts Template: Build Hierarchies with ClarityID: #PC00338$17.00
What Tree Diagrams Reveal That Bullet Points Hide
When you map reporting lines or decision paths, the visual branches carry the argument. A single slide can replace three pages of text because the eye follows the flow from root to leaf without extra explanation.
Four Real Moments These Layouts Changed the Outcome
The HR director at a 300-person manufacturing firm needed to present the new reporting structure to department heads before the all-hands. With the template the nodes were already sized and connected; she only updated names and titles. The meeting ended 20 minutes early because questions focused on roles instead of slide legibility.
A strategy consultant prepared a go-to-market decision tree for a retail client`s leadership offsite. Manual creation would have meant rebuilding alignment every time a branch changed. The pre-set layout let her test three scenarios in one afternoon and the client chose the path with clearest risk visualization.
The operations lead at a logistics company mapped vendor interdependencies for the quarterly risk review. The template`s consistent node style kept every level readable even when printed as handouts. Stakeholders spotted the bottleneck slide immediately and approved the mitigation plan on the spot.
A finance analyst updated the capital allocation tree for the CFO board pack. Instead of adjusting column widths across 15 slides, the master layout handled spacing automatically. The board discussion moved straight to numbers because the structure needed no clarification.
Why Starting From Scratch Costs More Than Alignment Time
You lose the slide master setup, the consistent color palette across every node level, and the fixed text box proportions that keep labels from overlapping when data grows. Those decisions compound across 20 slides and eat the thinking time you actually need for the story.
How Recurring Decks Stay Consistent Across Departments
For quarterly OKR reviews or annual planning cycles the same tree layout becomes the department standard. Copy the slide, update the data, and every version carries the same visual language without re-checking font stacks or branch angles.
One Non-Obvious Trick for Branch Alignment in the Slide Master
Group the entire tree object on the master slide before distributing copies. Any change to node style or branch width propagates automatically to every instance without breaking connections on child slides.
Technical Note on Aspect Ratio and PDF Export
All files use 16:9 by default. When you export to PDF for board packets, keep the slide master locked so embedded fonts do not substitute on recipient machines. Test one slide first if your audience still runs older PowerPoint versions.
What Sets These Tree Diagrams Apart for Corporate Work
Every layout prioritizes data storytelling over decoration. Nodes stay fully editable shapes, not flattened images, so you can scale branches or recolor levels without starting over. The collection skips the clip-art extras that force extra cleanup in real executive decks.
Choosing the Right Category for Your Next Deck
If your story needs geographic context instead of hierarchies, head to the Australia PowerPoint Maps templates. Teams working with clinical data often move from here to the medicine and pharma PowerPoint templates. For Keynote users presenting regional overviews, the Central America Keynote Maps templates offer the matching platform.
Grab the tree layout you need now and keep the focus on the message.
FAQ
Are these tree diagram PowerPoint templates compatible with Google Slides?
Yes. Upload any PPTX file directly to Google Drive and open in Slides. Text, shapes, and connections remain editable. Watch for minor spacing shifts on very wide trees because Slides handles auto-layout differently; adjust node sizes once after import. PDF export from Slides preserves the hierarchy for sharing with audiences who do not use PowerPoint.
What PowerPoint versions support full editing of the nodes and branches?
Files open and edit completely in PowerPoint 2016 and newer, including Microsoft 365. In versions before 2016 some SmartArt-style branches may convert to grouped shapes; the core vectors and text boxes stay fully editable. After opening, update the slide master once to lock your company colors and font stack across all copies.
Can multiple team members use the same purchased template file?
The license allows editing and sharing of finished presentations inside your organization. The source PPTX itself stays with the original buyer unless you purchase additional seats. Teams commonly duplicate the file to a shared drive and each user works on their own copy while keeping the master layout untouched.
Do the templates include embedded fonts or require installation?
No extra fonts are embedded; all text uses standard system fonts that travel with the file. If your brand requires a custom typeface, replace the text boxes on the master slide once and the change applies everywhere. PDF export then renders exactly as seen on screen regardless of recipient software.
Is there a limit on how many slides I can create from one template?
None. Duplicate the tree slide as many times as needed inside your deck. Each copy keeps the original master layout so alignment and styling stay consistent even in a 60-slide quarterly report. The only limit is your own license for the source file.