Business Models PowerPoint Charts
Transform your ideas into powerful presentations with our Business Models PowerPoint Charts Templates. Featuring over 50 customizable slides- including SWOT, Gantt, and Business Model - these designs help startups, executives, and analysts create professional, engaging visuals fast. Updated trends, they're perfect for pitching investors, reporting finances, or mapping strategies. Ready to stand out? Explore our top-tier collection now!
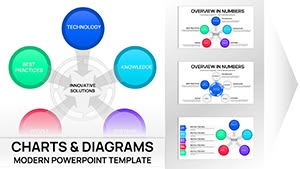 (12)
(12) Innovative Solutions PowerPoint Charts Template | 41 Editable Slides - Business Models ReadyID: #PC01114$18.00
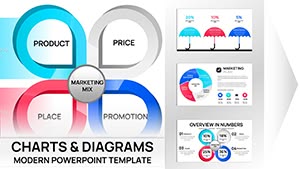 (11)
(11) Marketing Mix PowerPoint Charts - 47 Editable Slides for Strategy Presentations | Download NowID: #PC01108$20.00
 (11)
Marketing Mix PowerPoint Charts - 31 Editable Slides for Board Meetings | Instant DownloadID: #PC01090$15.00
(11)
Marketing Mix PowerPoint Charts - 31 Editable Slides for Board Meetings | Instant DownloadID: #PC01090$15.00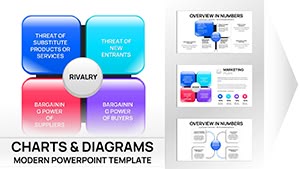 (14)
Porter's Diamond Charts PPT Template - 38 editable slidesID: #PC01089$15.00
(14)
Porter's Diamond Charts PPT Template - 38 editable slidesID: #PC01089$15.00 (17)
Bowman's Strategy Clock Charts Template for PowerPoint - 40 editable slidesID: #PC01088$16.00
(17)
Bowman's Strategy Clock Charts Template for PowerPoint - 40 editable slidesID: #PC01088$16.00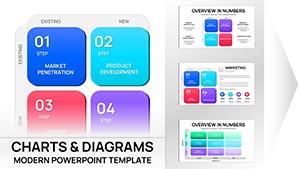 (17)
Ansoff Matrix Charts PPT Template for PowerPointID: #PC01082$20.00
(17)
Ansoff Matrix Charts PPT Template for PowerPointID: #PC01082$20.00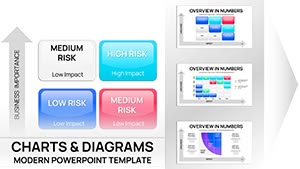 (12)
Risk Matrix Charts Template for PowerPointID: #PC01080$18.00
(12)
Risk Matrix Charts Template for PowerPointID: #PC01080$18.00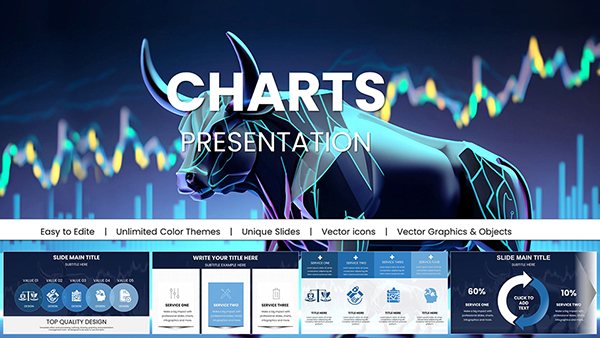 (694)
(694) Market Trend PowerPoint Charts: Navigate Business LandscapesID: #PC01063$25.00
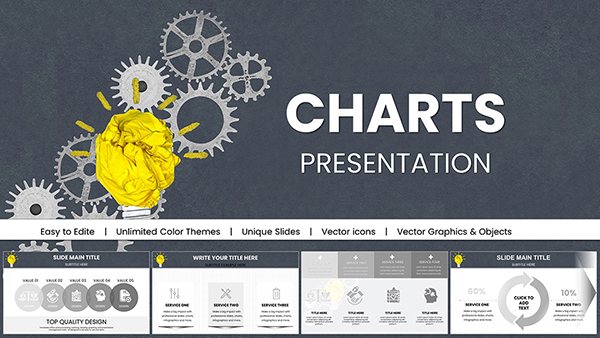 (118)
Marketing PowerPoint Charts: Fueling Strategic StorytellingID: #PC01038$20.00
(118)
Marketing PowerPoint Charts: Fueling Strategic StorytellingID: #PC01038$20.00 (3)
Comprehensive Marketing Strategies PowerPoint Charts: Data-Driven MasteryID: #PC01026$22.00
(3)
Comprehensive Marketing Strategies PowerPoint Charts: Data-Driven MasteryID: #PC01026$22.00 (837)
Top Marketing Ideas: PowerPoint Charts for Strategic WinsID: #PC01022$15.00
(837)
Top Marketing Ideas: PowerPoint Charts for Strategic WinsID: #PC01022$15.00 (585)
Business Correspondence PowerPoint Charts: Pro PPTXID: #PC00957$20.00
(585)
Business Correspondence PowerPoint Charts: Pro PPTXID: #PC00957$20.00 (530)
Business Analysis Solution PowerPoint ChartsID: #PC00941$25.00
(530)
Business Analysis Solution PowerPoint ChartsID: #PC00941$25.00 (483)
Best Choice PowerPoint Charts: Professional Templates for Decision-MakingID: #PC00939$25.00
(483)
Best Choice PowerPoint Charts: Professional Templates for Decision-MakingID: #PC00939$25.00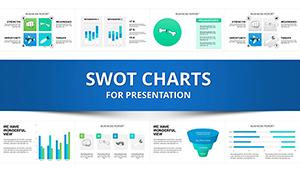 (383)
SWOT Analysis PowerPoint Charts Template DownloadID: #PC00296$20.00
(383)
SWOT Analysis PowerPoint Charts Template DownloadID: #PC00296$20.00 (1055)
 Business Analyst PowerPoint Charts Template for Impactful PresentationsID: #PC00292$25.00
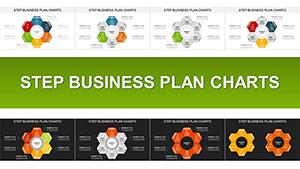 (212)
Step Business Plan PowerPoint Charts Template for Compelling PitchesID: #PC00916$23.00
(212)
Step Business Plan PowerPoint Charts Template for Compelling PitchesID: #PC00916$23.00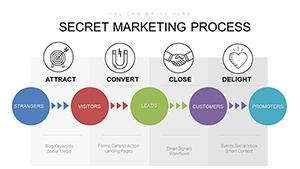 (19)
Inbound Marketing PowerPoint Chart Template: Attract, Engage, DelightID: #PC00890$18.00
(19)
Inbound Marketing PowerPoint Chart Template: Attract, Engage, DelightID: #PC00890$18.00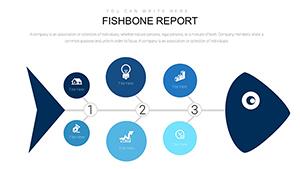 (272)
Fishbone PowerPoint Chart Template: Master Root Cause Analysis EffortlesslyID: #PC00889$16.00
(272)
Fishbone PowerPoint Chart Template: Master Root Cause Analysis EffortlesslyID: #PC00889$16.00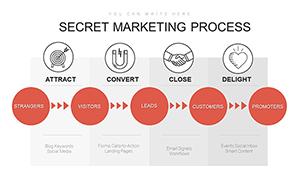 (768)
Inbound Marketing Strategies PowerPoint Charts Template: Fuel Your GrowthID: #PC00884$18.00
(768)
Inbound Marketing Strategies PowerPoint Charts Template: Fuel Your GrowthID: #PC00884$18.00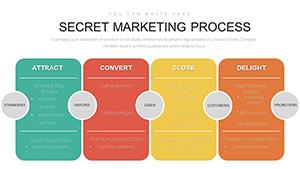 (97)
Inbound Marketing Process PowerPoint Charts Template: Streamline Your StrategyID: #PC00882$15.00
(97)
Inbound Marketing Process PowerPoint Charts Template: Streamline Your StrategyID: #PC00882$15.00 (1015)
Slideshow Presentation PowerPoint Charts TemplateID: #PC00875$20.00
(1015)
Slideshow Presentation PowerPoint Charts TemplateID: #PC00875$20.00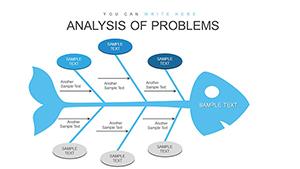 (28)
Analysis of Problems PowerPoint Charts Template: Drive Solutions ForwardID: #PC00861$18.00
(28)
Analysis of Problems PowerPoint Charts Template: Drive Solutions ForwardID: #PC00861$18.00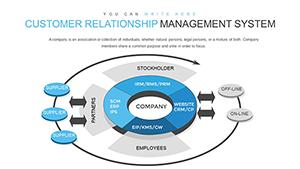 (369)
CRM System PowerPoint Charts Template - Elevate Your Data StorytellingID: #PC00860$18.00
(369)
CRM System PowerPoint Charts Template - Elevate Your Data StorytellingID: #PC00860$18.00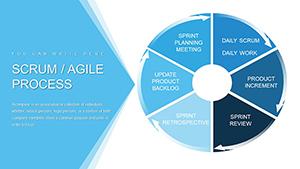 (949)
Scrum Agile Development Process PowerPoint Charts TemplateID: #PC00856$18.00
(949)
Scrum Agile Development Process PowerPoint Charts TemplateID: #PC00856$18.00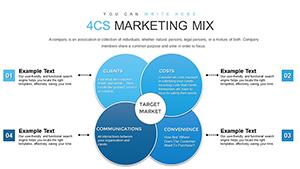 (652)
4CS and 7PS Marketing Mix PowerPoint Charts TemplateID: #PC00833$15.00
(652)
4CS and 7PS Marketing Mix PowerPoint Charts TemplateID: #PC00833$15.00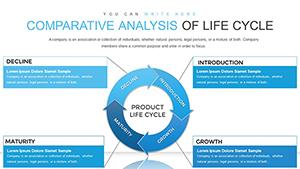 (244)
Comparative Analysis of Life Cycle PowerPoint Charts TemplateID: #PC00832$15.00
(244)
Comparative Analysis of Life Cycle PowerPoint Charts TemplateID: #PC00832$15.00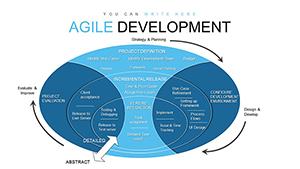 (188)
Agile Methodology PowerPoint Charts TemplateID: #PC00831$13.00
(188)
Agile Methodology PowerPoint Charts TemplateID: #PC00831$13.00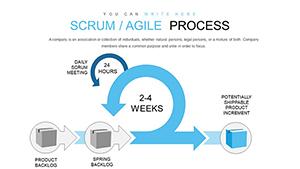 (232)
Agile Scrum Process PowerPoint Template - Fully Editable & Instant DownloadID: #PC00830$15.00
(232)
Agile Scrum Process PowerPoint Template - Fully Editable & Instant DownloadID: #PC00830$15.00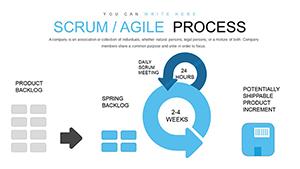 (722)
Agile Scrum Methodology Process Flow PowerPoint ChartsID: #PC00829$18.00
(722)
Agile Scrum Methodology Process Flow PowerPoint ChartsID: #PC00829$18.00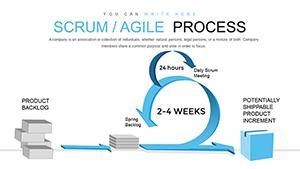 (1126)
Scrum Agile Process PowerPoint Charts Template for PresentationID: #PC00828$18.00
(1126)
Scrum Agile Process PowerPoint Charts Template for PresentationID: #PC00828$18.00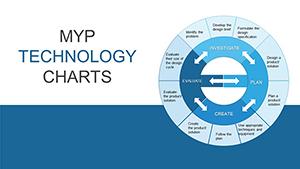 (1169)
MYP Technology Pie Chart PowerPoint TemplateID: #PC00813$20.00
(1169)
MYP Technology Pie Chart PowerPoint TemplateID: #PC00813$20.00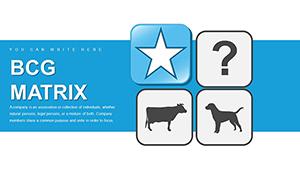 (1123)
BCG Matrix PowerPoint Charts Template for StrategyID: #PC00807$18.00
(1123)
BCG Matrix PowerPoint Charts Template for StrategyID: #PC00807$18.00
Why Choose Our Business Models PowerPoint Templates?
In today`s fast-paced business world, clear and impactful presentations are essential. Our Business Models PowerPoint Charts Templates simplify complex strategies and deliver stunning visuals that captivate your audience. Designed by experts with over 10 years of experience, these templates save you hours while ensuring your message shines - whether you`re pitching to investors or briefing your team.
How These Charts Boost Your Business Strategy
Our Business Models PowerPoint Charts Templates offer a professional edge with a complete toolkit for compelling presentations. Showcase key elements like customer segments, value propositions, revenue streams, and cost structures with ease. Ideal for startups, entrepreneurs, and businesses of all sizes, these templates help you impress stakeholders and win over clients. Download now and turn complexity into clarity!
Advantages of Using Business Models PowerPoint Chart Templates
- Enhanced Clarity: Break down intricate business concepts into stunning, easy-to-understand visuals that resonate with your audience.
- Time Savings: Skip the design process with pre-built templates - customize over 50 slides to fit your needs in minutes.
- Professionalism: Maintain a polished, consistent look across all your presentations with expert-crafted designs.
- Improved Engagement: Capture attention with dynamic charts like SWOT and Gantt, proven to boost audience understanding.
- Error Reduction: Rely on standardized layouts to ensure every detail is included and presented accurately.
Top Templates for Startups, Analysts & Executives
- Flowcharts: Map out workflows and processes - like Agile Scrum or Inbound Marketing - with clear, actionable visuals.
- Pie Charts: Highlight market share, financial splits, or customer demographics with vibrant, proportional designs.
- Bar Graphs: Compare sales, revenue, or performance metrics across categories with sleek, modern layouts.
- Gantt Charts: Track project timelines, tasks, and milestones - perfect for project managers and teams.
- Organizational Charts: Illustrate team structures or corporate hierarchies for mergers, expansions, or updates.
- SWOT Analysis Templates: Assess strengths, weaknesses, opportunities, and threats with strategic precision.
Examples of Using Business Models PowerPoint Chart Templates
- Business Strategy Presentations: Use flowcharts and SWOT templates to outline your vision and win stakeholder buy-in.
- Financial Reports: Leverage pie charts and bar graphs to present revenue, costs, and profits with clarity.
- Project Management: Visualize timelines and dependencies with Gantt charts to keep projects on track.
- Market Research: Display trends, demographics, and competitor insights using pie charts and bar graphs.
- Organizational Changes: Showcase team restructures or expansions with detailed organizational charts.
Who Needs Business Models PowerPoint Chart Templates?
- Business Executives & Managers: Perfect for strategic planning, financial reviews, and boardroom presentations.
- Project Managers: Communicate timelines, progress, and plans to stakeholders effortlessly.
- Marketing Professionals: Present research, strategies, and campaigns with eye-catching visuals.
- Consultants: Deliver strategic insights to clients with polished, customizable slides.
- Educators & Trainers: Teach business concepts with clear, engaging diagrams.
- Entrepreneurs & Startups: Pitch innovative ideas to investors with professional-grade templates.
User Reviews of Business Models PowerPoint Charts Templates
- John D., Marketing Manager: "These templates revolutionized our strategy pitches. Clients now grasp complex ideas instantly thanks to the clear, professional visuals."
- Sara L., Project Manager: "The Gantt chart templates are a game-changer - tracking milestones has never been easier or faster."
- Michael R., Financial Analyst: "Financial charts make our reports pop. They`re engaging, clear, and save us hours of work."
- Emma K., Consultant: "I rely on these adaptable templates for client decks. They convey strategic insights with impact every time."
Ready to elevate your presentations? Our Business Models PowerPoint Charts Templates streamline communication and enhance decision-making. Whether you`re planning strategies, reporting data, or pitching ideas, these tools deliver clarity, consistency, and visual appeal. Browse our full collection today!
FAQs
- What Are Business Models PowerPoint Charts Templates?
Pre-designed slides with over 50 chart types - like SWOT, Gantt, and Business Model - to illustrate strategies and structures clearly and effectively. - Why Should I Use These Templates?
Save time, boost consistency, and captivate your audience with professional visuals - perfect for pitches, reports, and more. - What Charts Are Included?
Expect business model canvases, SWOT analyses, revenue models, Gantt charts, and financial projections - all customizable for your needs. - Can I Customize These Templates?
Absolutely! Adjust colors, fonts, text, and layouts to match your brand and content - compatible with PowerPoint 365 and beyond. - How Do I Use These for Pitch Decks?
Combine flowcharts, pie charts, and SWOT slides to showcase your business model, market fit, and financials to investors.