Inbound Marketing Process PowerPoint Charts Template: Streamline Your Strategy


Type: PowerPoint Charts template
Category: Business Models, Tables
Sources Available: .pptx
Product ID: PC00882
Template incl.: 15 editable slides
Navigating the dynamic landscape of digital marketing requires tools that not only visualize but also simplify complex processes. Our Inbound Marketing Process PowerPoint Charts Template does just that, offering a robust set of 15 editable slides tailored for marketers, consultants, and entrepreneurs. Drawing from methodologies endorsed by hubs like HubSpot's Inbound Certification, this template breaks down the attract, engage, and delight phases into actionable visuals, helping you craft customer-centric campaigns that drive real results.
Envision presenting to a room of stakeholders where your flowcharts illuminate how social media attracts leads, or funnel models demonstrate conversion paths - all with a professional edge that commands attention. Compatible with PowerPoint and hinting at Keynote usability, it's designed for seamless integration into your workflow. Marketing analysts report that well-structured visuals can increase comprehension by 40%, per insights from the Content Marketing Institute, making this template a game-changer for turning strategies into successes.
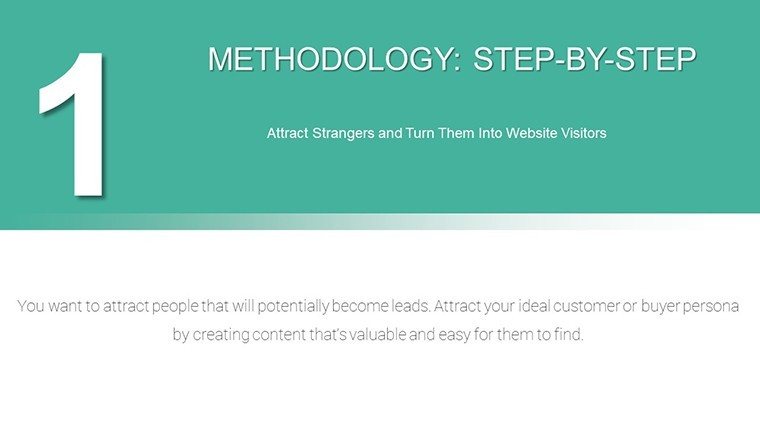
Master the Inbound Phases with Dynamic Visuals
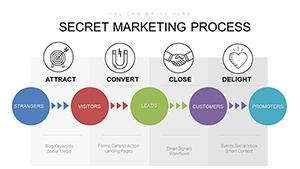
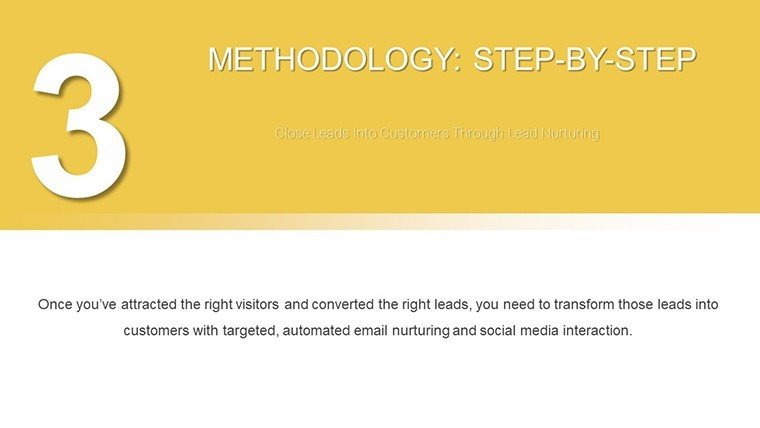
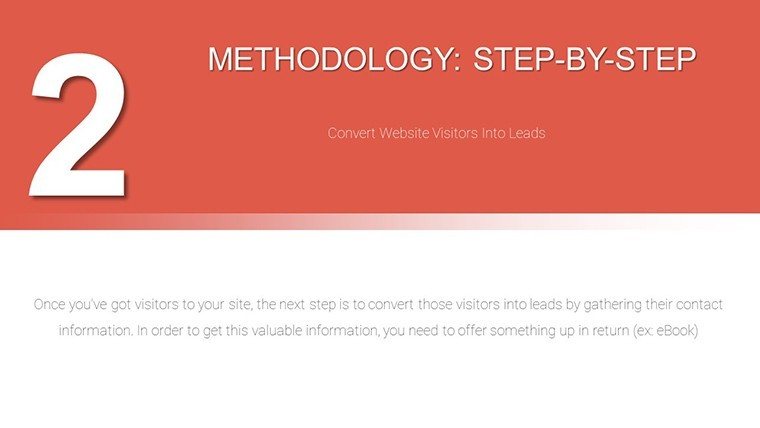
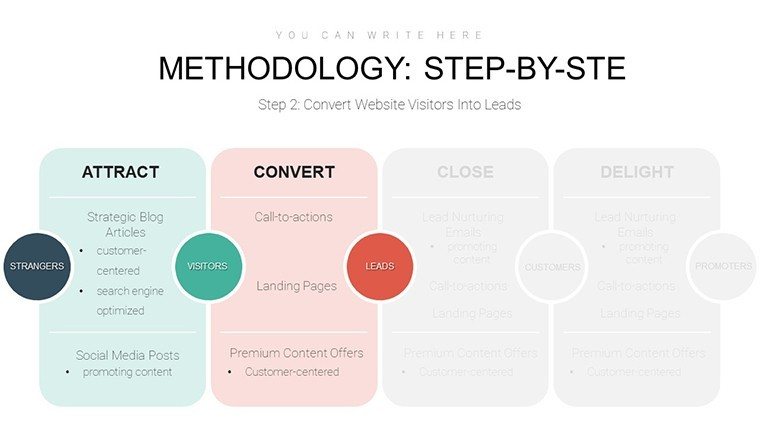
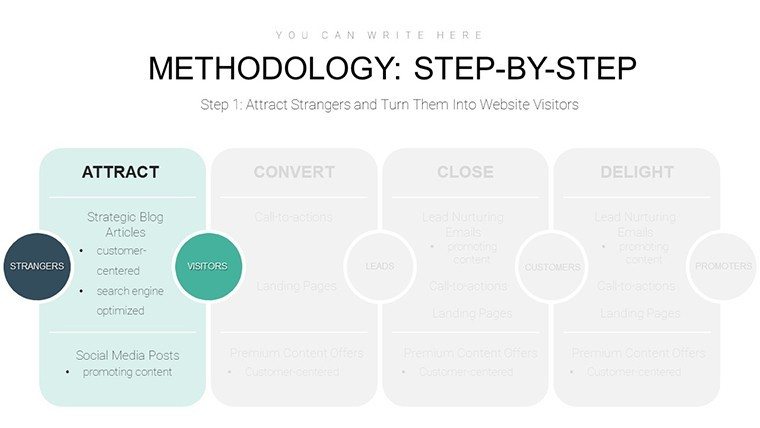
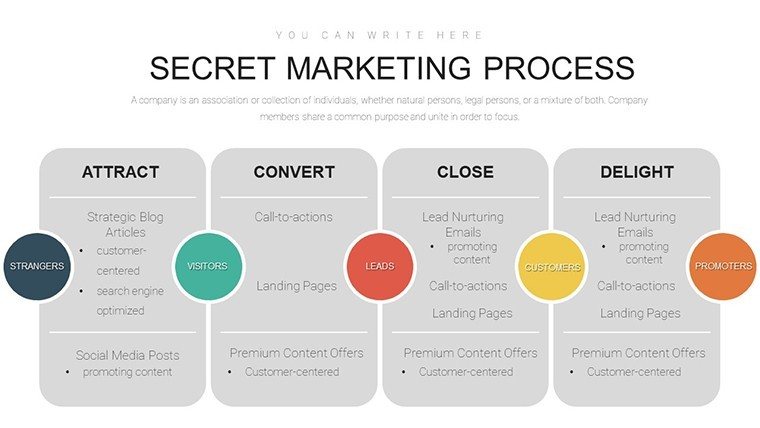
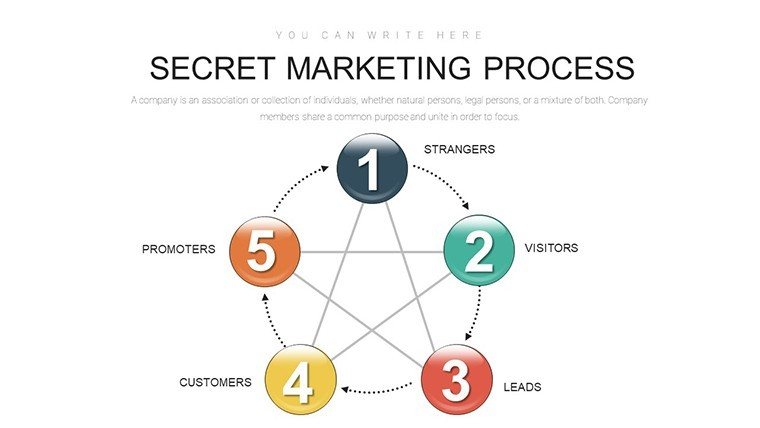
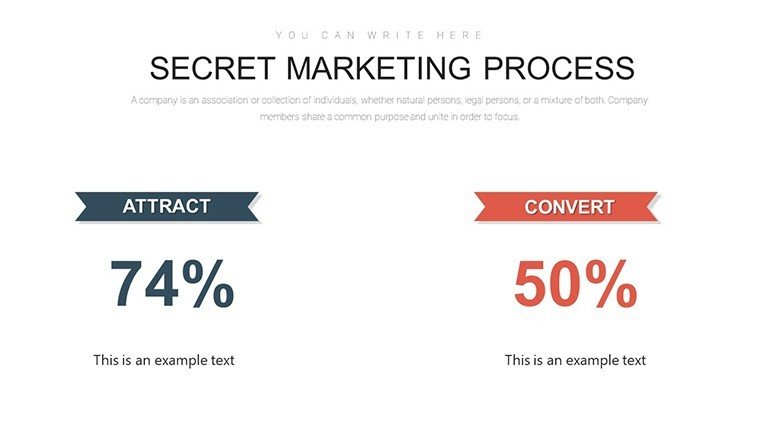
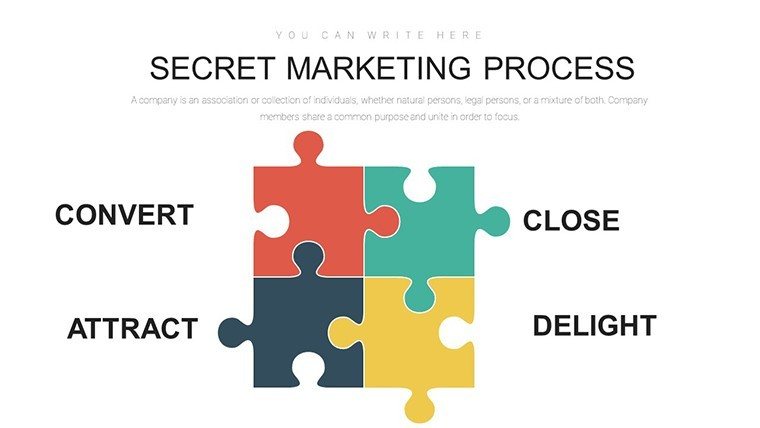
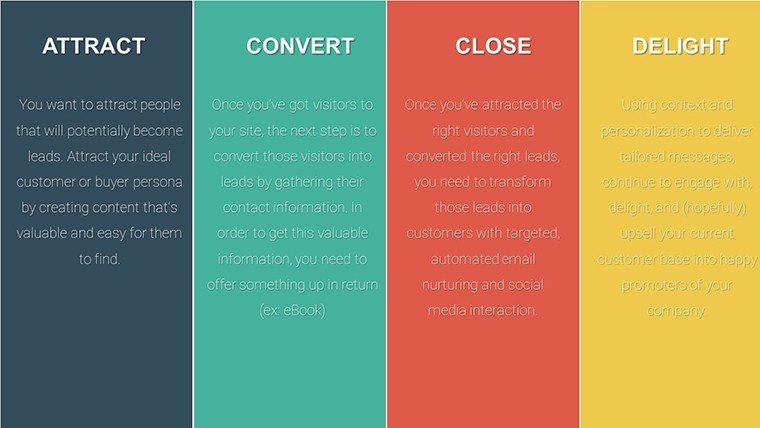
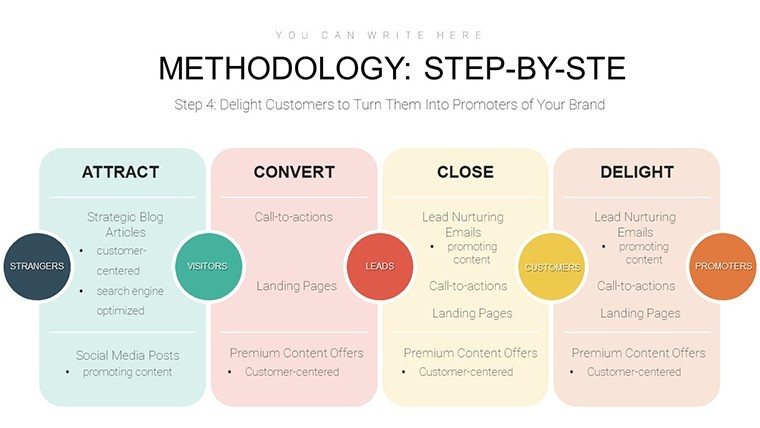
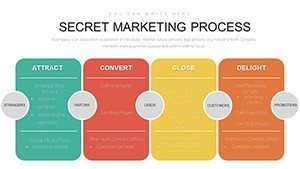
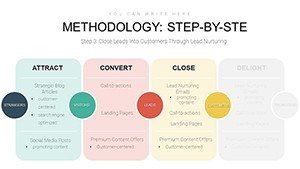
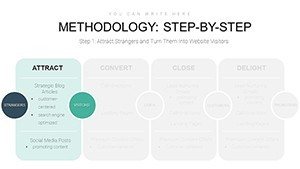
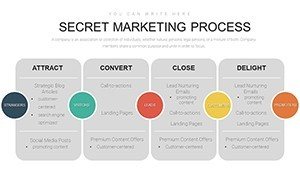
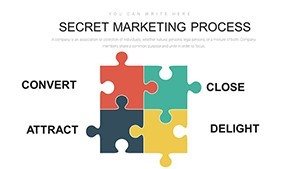
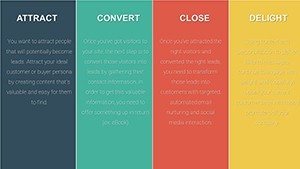
At its heart, the template revolves around the inbound methodology's core: attracting prospects through valuable content, engaging them with personalized interactions, and delighting them post-purchase for loyalty. Begin with attract-phase slides featuring process diagrams that map content distribution across channels like blogs and SEO-optimized posts.
A practical example? A digital agency used analogous charts to pitch a client on revamping their lead gen, resulting in a 25% uplift in qualified leads, as shared in case studies from MarketingProfs. Our template enhances this with table integrations for KPI tracking, fitting its Business Models and Tables categories.
Standout Features for Marketing Mastery
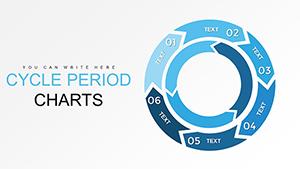
- Flowcharts and Process Diagrams: Clearly depict workflow from awareness to advocacy.
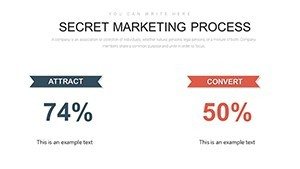
- Funnel Models: Visualize customer journeys with data-driven narrowing for conversions.
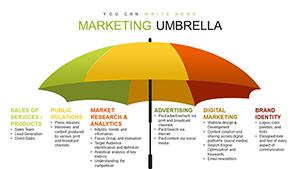
- Customizable Elements: Edit colors, texts, and shapes to align with your brand identity.
- 15 Versatile Slides: Cover goals, tactics, and metrics without overwhelming.
- Professional Polish: High-res graphics that maintain quality on any screen.
These aren't generic; they're optimized for inbound's nuances, incorporating LSI like "lead nurturing" and "customer retention strategies."
Tailored Use Cases: From Pitches to Reports
For consultants, deploy the template in client meetings to outline tailored inbound plans, using diagrams to highlight pain points and solutions. Entrepreneurs can leverage it for investor decks, showcasing how inbound scales growth cost-effectively.
In team settings, facilitate discussions on KPIs with interactive tables - imagine a sales huddle where engage-phase charts spark ideas for email automation. Educational webinars benefit too, with simplified visuals teaching inbound basics to novices.
Implementing the Template: A Practical Workflow
- Acquire and Setup: Download the .pptx and open in PowerPoint or Keynote.
- Brand Alignment: Adjust themes to match your palette and fonts.
- Data Integration: Populate funnels with your metrics, like conversion rates.
- Enhance Narratives: Add notes or animations for engaging delivery.
- Review and Refine: Test with a small group for feedback loops.
- Deploy: Use in presentations to measure immediate impact.
This approach meshes with tools like CRM software for data syncing.
Superior to Standard Tools: Why It Wins
Basic PowerPoint lacks the specialized inbound focus - our template's pre-built models save design effort, unlike starting from scratch. It outshines free alternatives with depth, like delight-phase loyalty loops not found in generics.
Users note enhanced clarity in reports, leading to better stakeholder buy-in. Weave in CTAs like "Ignite your inbound engine" to motivate action organically.
Expert Tips to Amplify Your Presentations
- Layer data stories: Build suspense by revealing phases step-by-step.
- Integrate real metrics: Pull from Google Analytics for authenticity.
- Adapt for audiences: Simplify for execs, detail for teams.
- Combine with video: Embed clips of customer testimonials.
- Track post-use ROI: Survey attendees on strategy adoption.
Inspired by sessions at Inbound conferences, these elevate your game.
Ultimately, this Inbound Marketing Process PowerPoint Charts Template empowers you to not just present, but persuade. In a market where attention is currency, invest in visuals that convert. Ready to revolutionize your approach? Secure your copy now and lead the charge.
Frequently Asked Questions
What phases does this template cover?
It details attract, engage, and delight with dedicated charts for each.
Is it compatible with Keynote?
Yes, the .pptx format works well with Keynote for Mac users.
How many slides are there?
15 fully editable slides focused on inbound processes.
Can I add my own branding?
Absolutely - customize everything from colors to logos effortlessly.
What's the best use for funnel models?
Ideal for visualizing conversion paths in client reports or pitches.