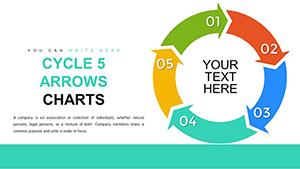
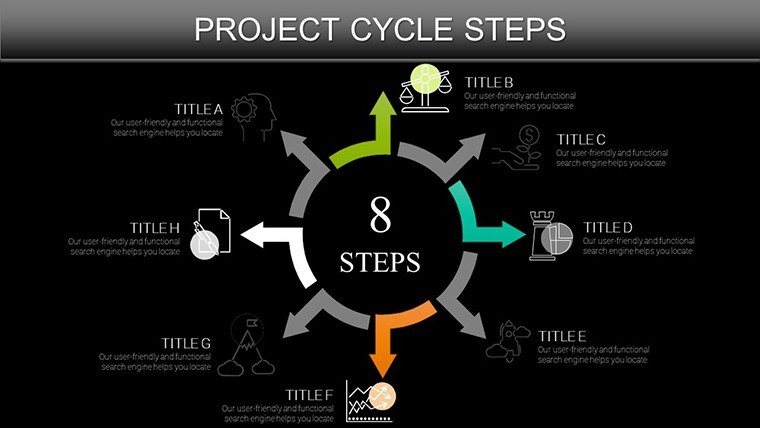
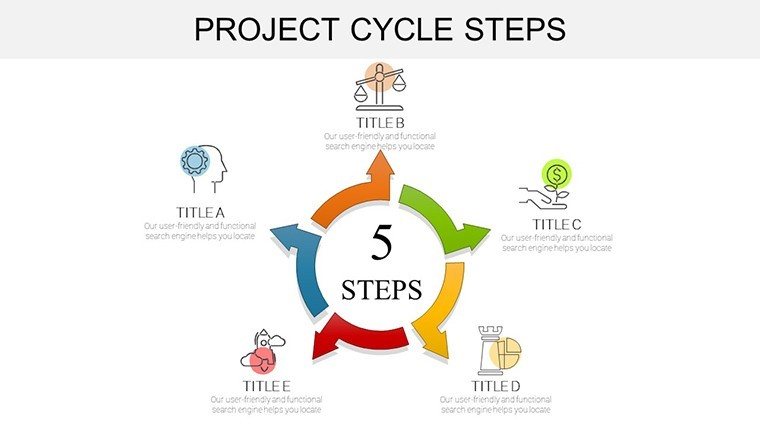
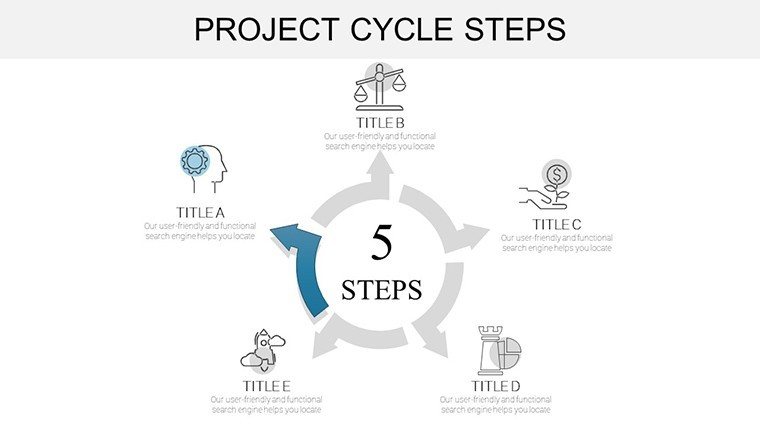
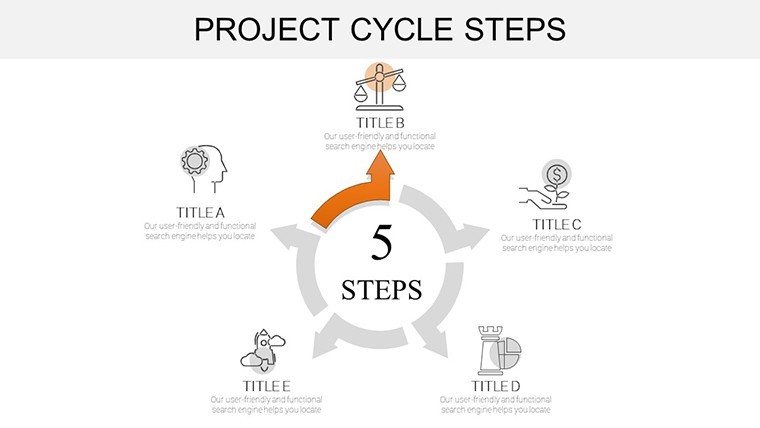
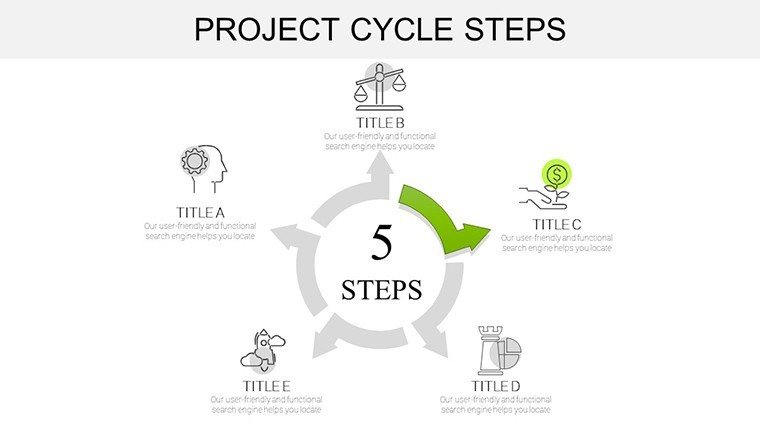
Project Cycle Steps PowerPoint Charts: Mastering Architecture Management
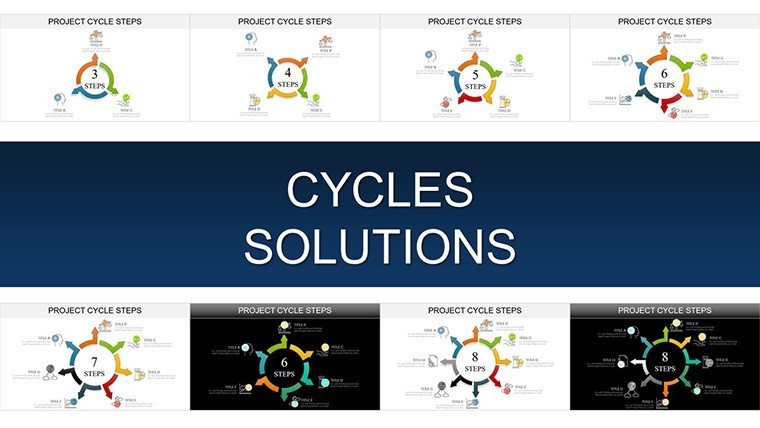


In the high-stakes world of architecture, where timelines clash with creative visions and budgets teeter on the edge of site surprises, effective project management isn't optional - it's the foundation of iconic builds. Enter our Project Cycle Steps PowerPoint Charts template, a 37-slide powerhouse engineered to guide you through every phase of the architectural lifecycle. From the spark of initiation to the triumphant closure of a skyline-defining tower, this template equips design professionals with visuals that clarify chaos and accelerate success.
Tailored for architects, PMs, and multidisciplinary teams, it transforms the standard PMBOK-inspired cycle into a bespoke narrative for the built environment. Envision slides that dissect planning with Gantt-infused cycles, execution via resource allocation radars, and monitoring through KPI dashboards - all infused with architectural flair like layered elevations and phased blueprints. Compatible with PowerPoint and Google Slides, it's your shortcut to presentations that don't just inform but mobilize, whether you're rallying contractors for a heritage renovation or pitching eco-friendly expansions to city councils.
What sets this apart? It's not rote project tracking; it's storytelling with structure. In an industry where 30% of projects overrun due to poor communication, these charts bridge gaps, fostering alignment and reducing revisions by visualizing milestones upfront.
Core Features: Engineering Efficiency into Every Slide
This template's 37 slides are a symphony of smart design, blending PM precision with aesthetic appeal.
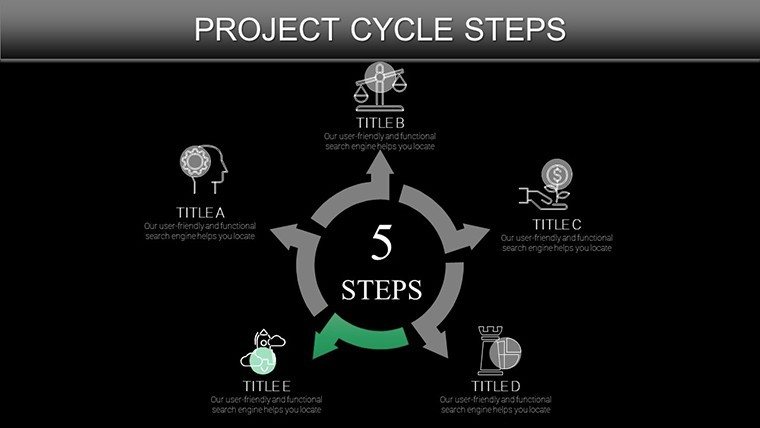
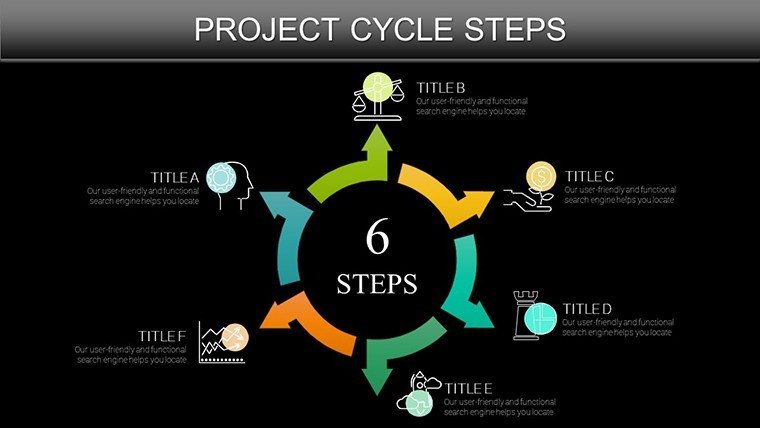
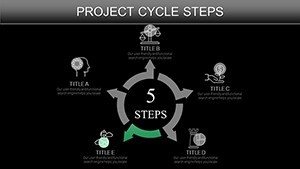
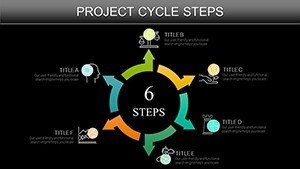
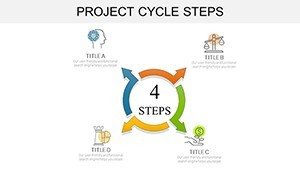
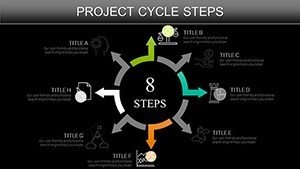
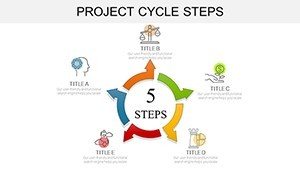
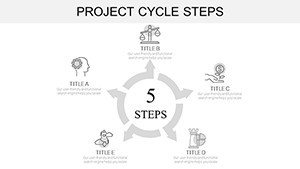
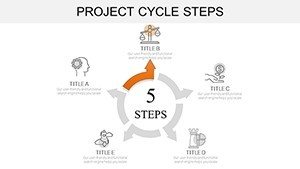
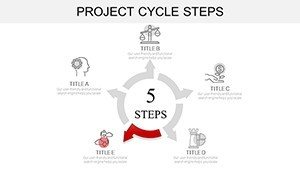
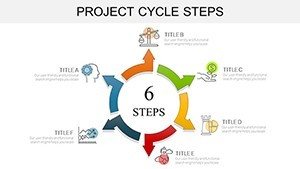
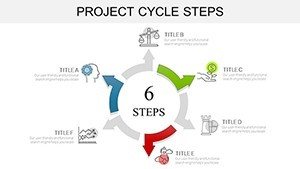
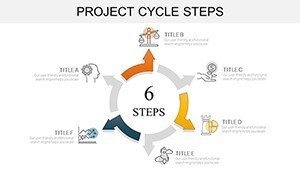
- Phase-Specific Cycles: Dedicated sections for Initiation (stakeholder maps), Planning (risk radars), Execution (workflow wheels), Monitoring (variance Venns), and Closure (lessons loops).
- Branded Visuals: 100+ customizable elements, from steel-beam icons to zoning overlays, ensuring your firm's identity shines.
- Dynamic Data Tools: Embedded formulas for auto-updating timelines, budgets, and progress bars - pull from MS Project or Excel effortlessly.
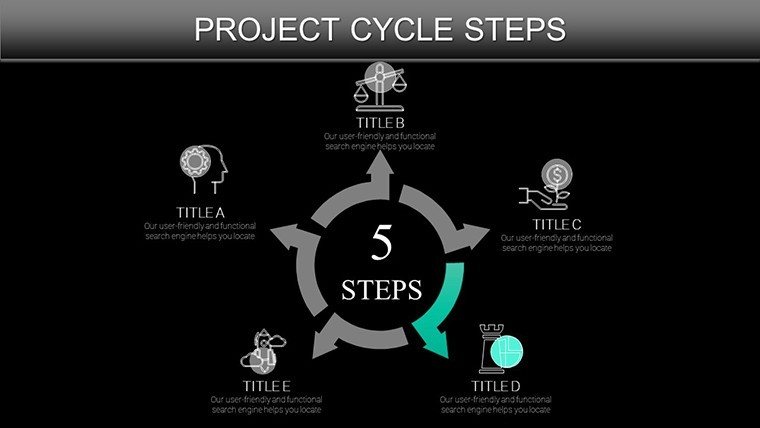
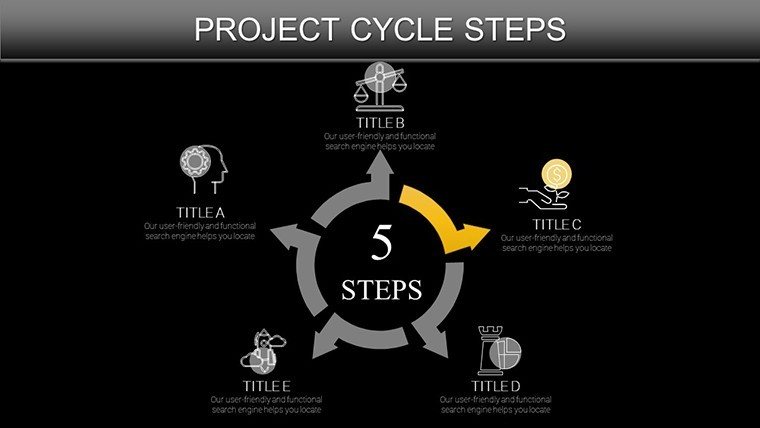
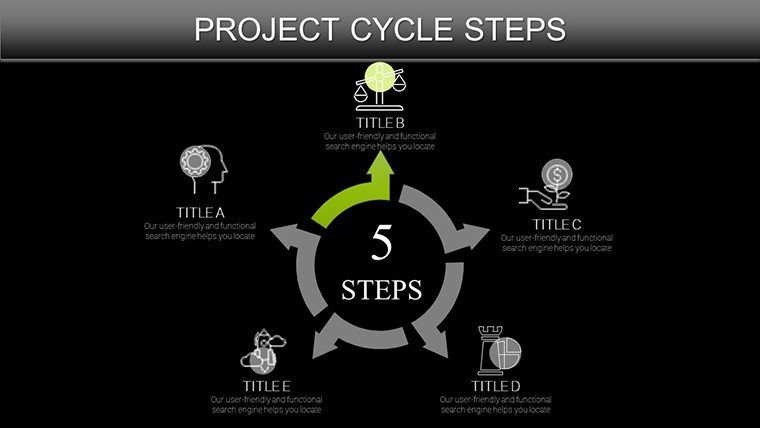
- Responsive Layouts: Scalable vectors that adapt to widescreen or standard formats, with subtle gradients evoking blueprint elegance.
Versus vanilla PowerPoint cycles, which scatter focus, this integrates seamlessly, offering drag-and-drop modularity for on-the-fly tweaks during heated reviews.
Navigating the Slides: A Phase-by-Phase Guide
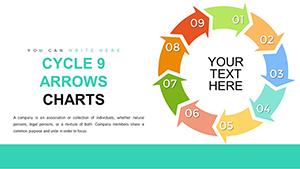
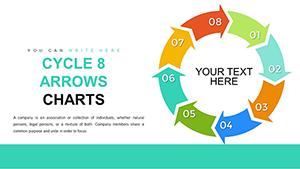
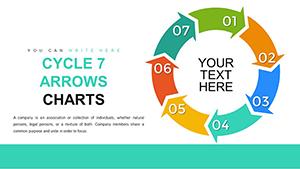
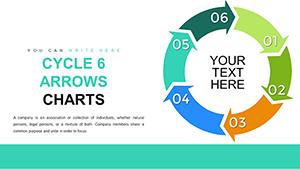
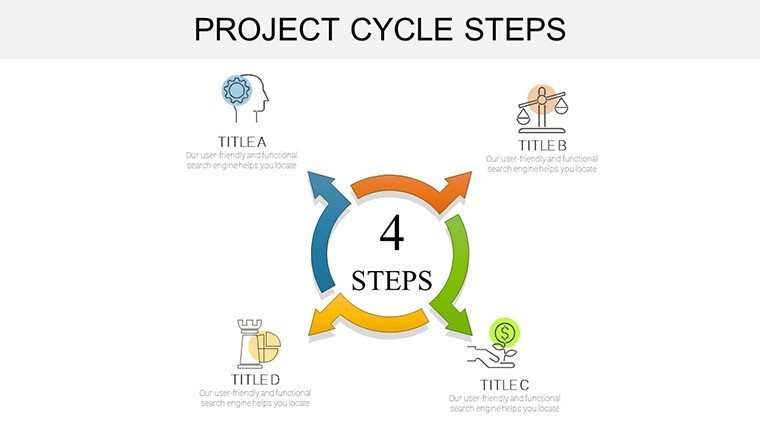
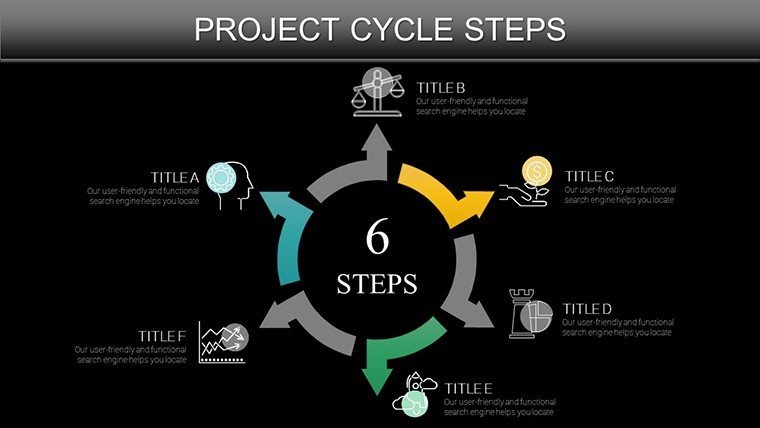
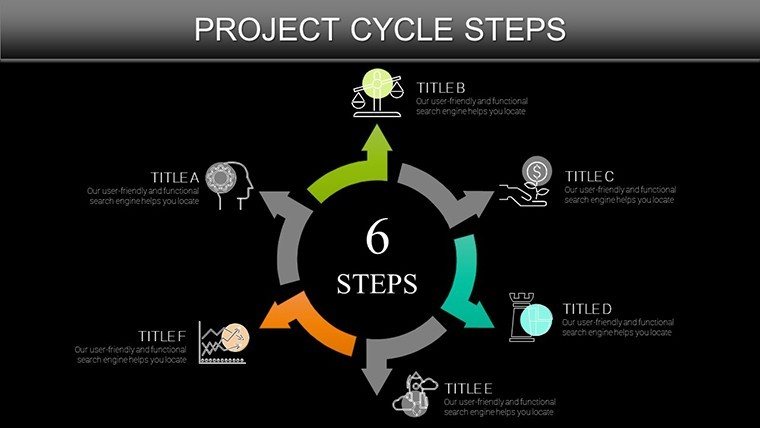
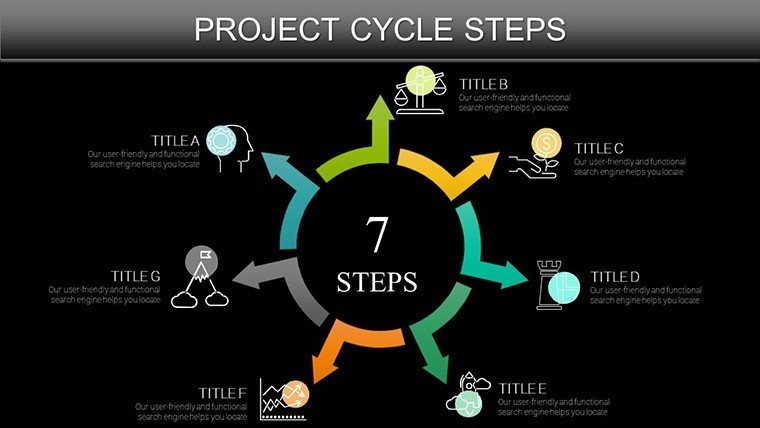
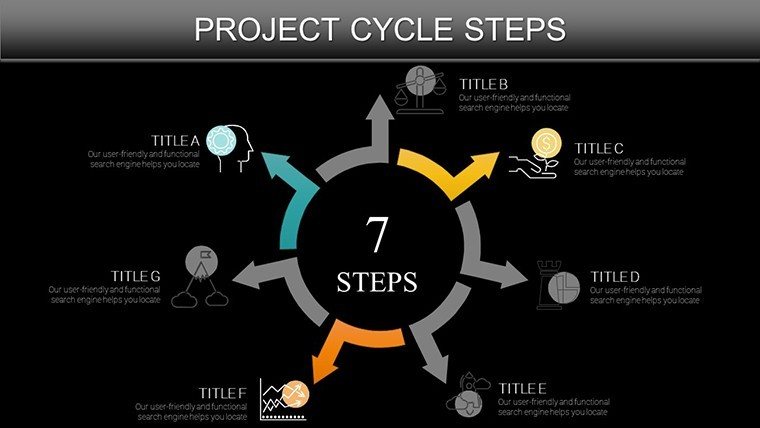
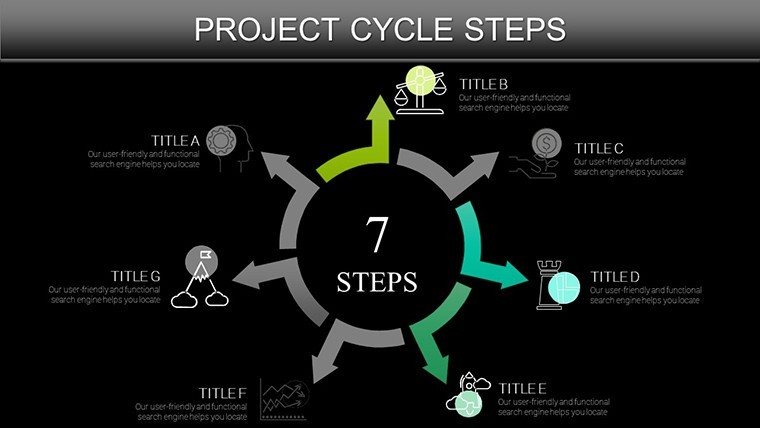
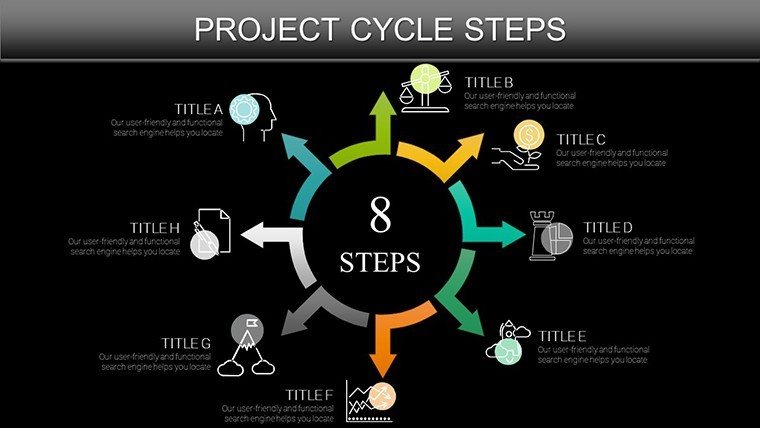
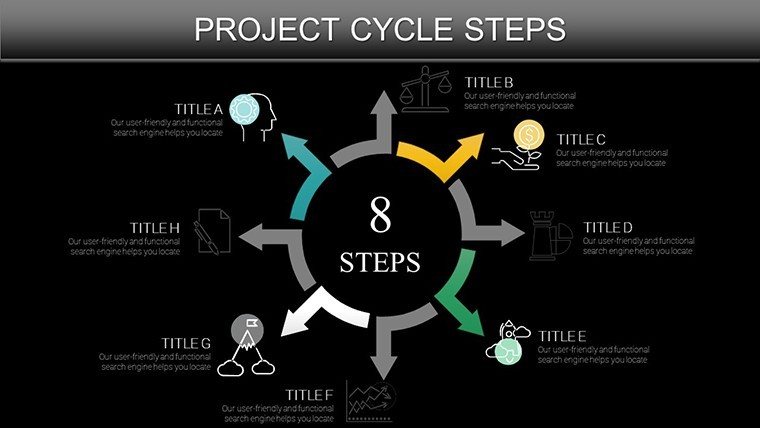
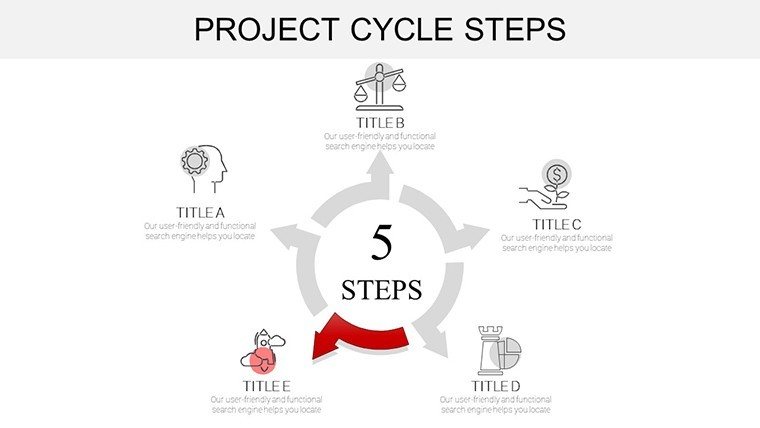
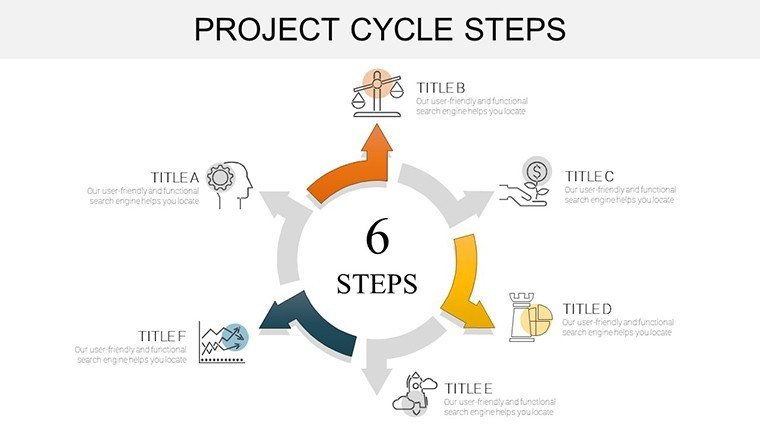
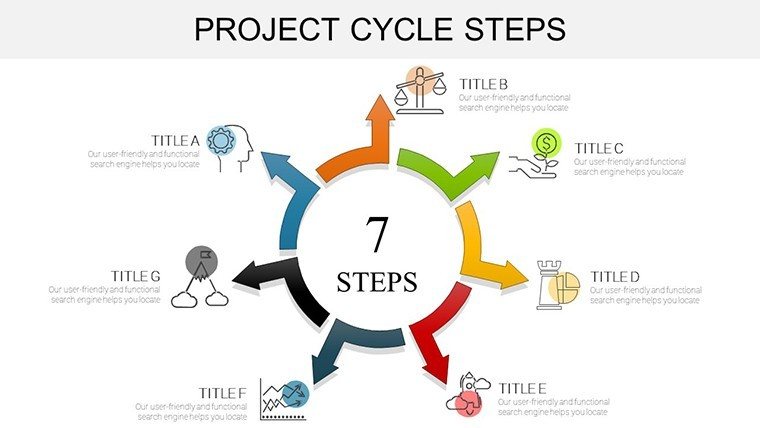
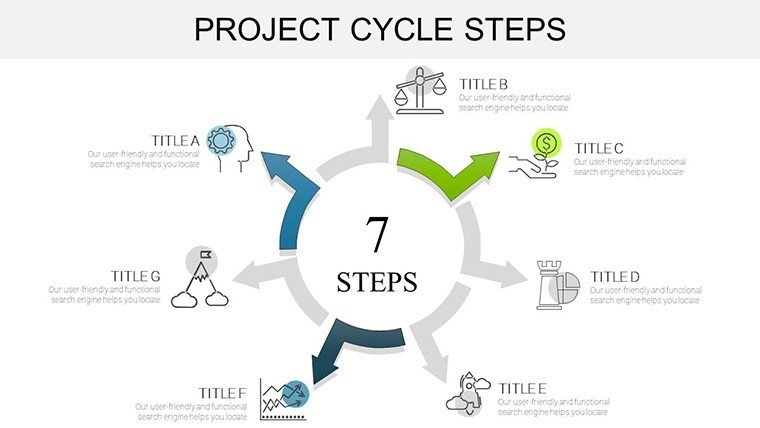
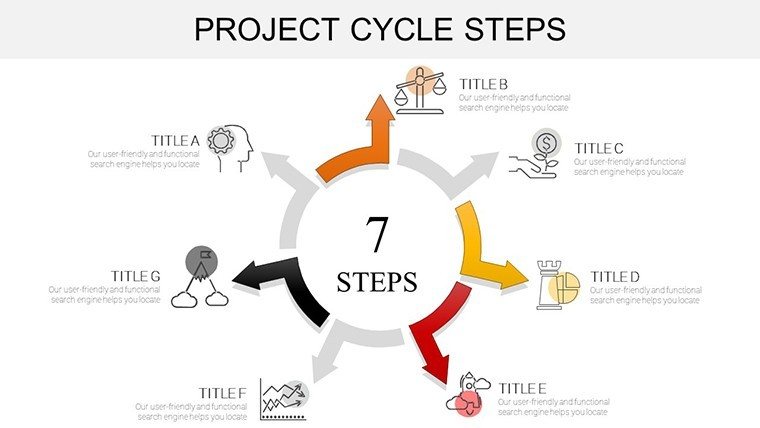
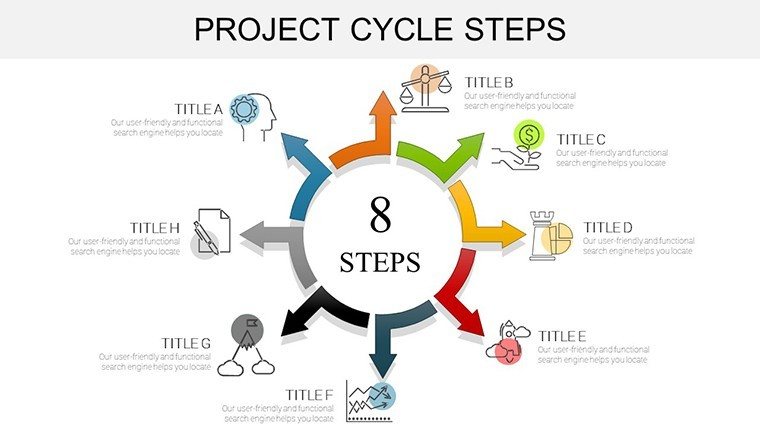
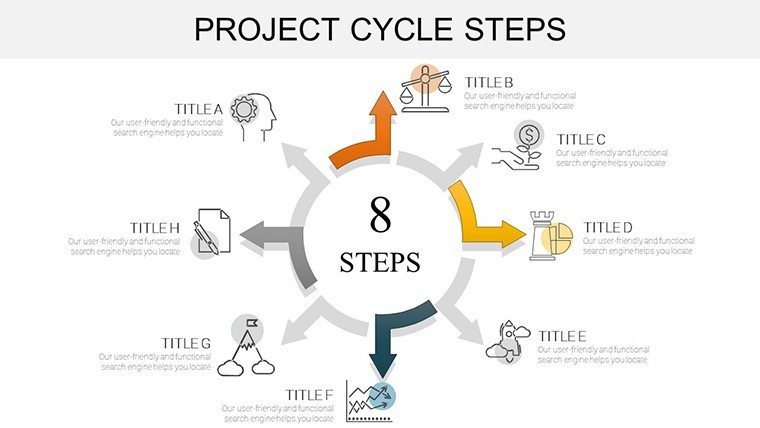
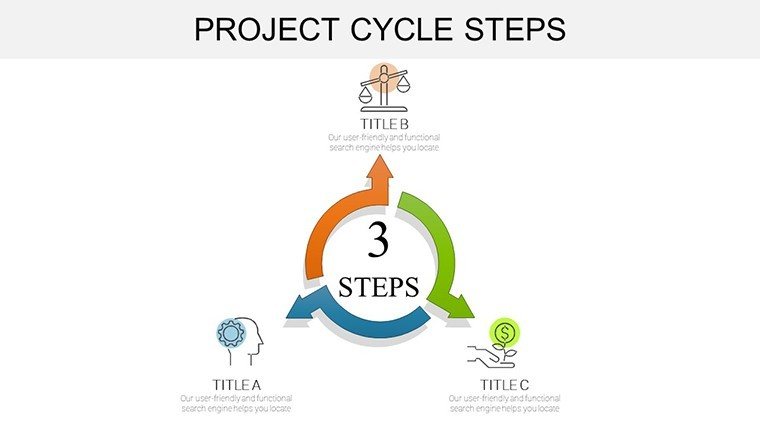
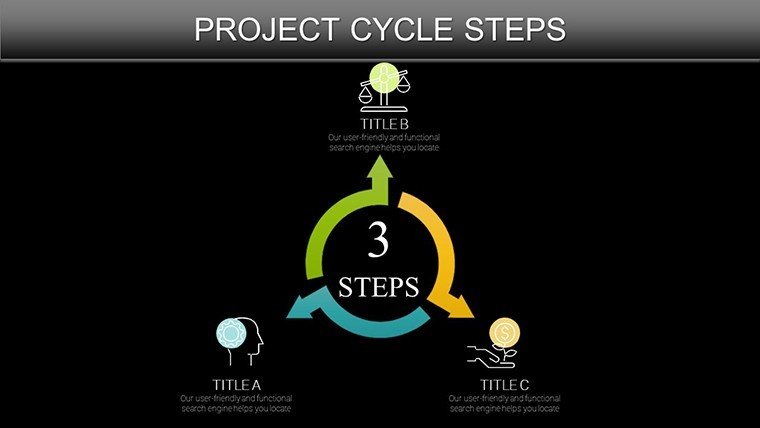
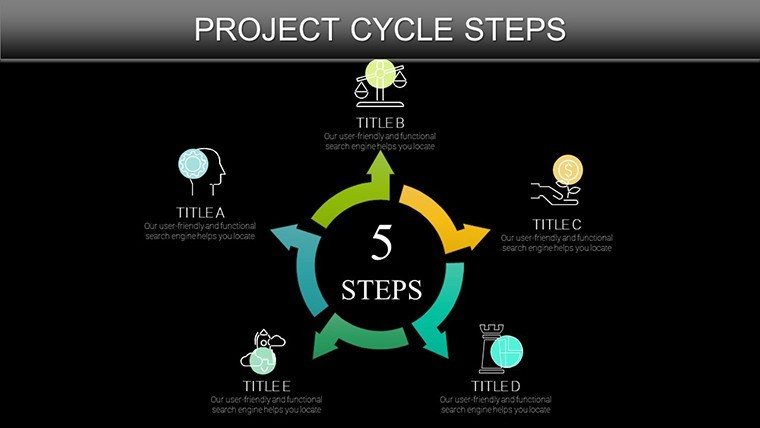
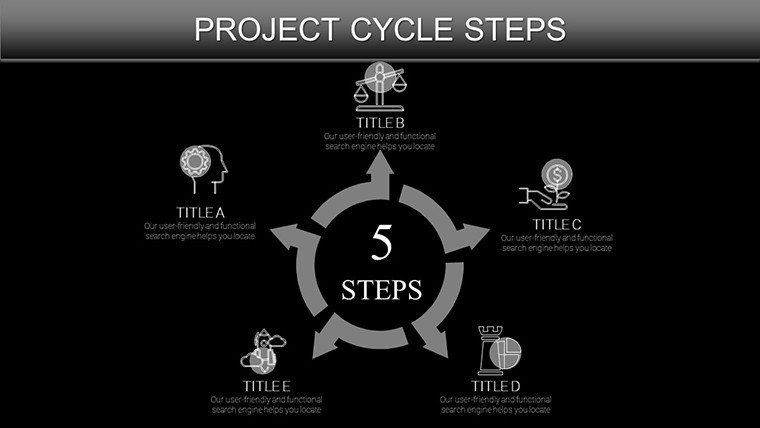
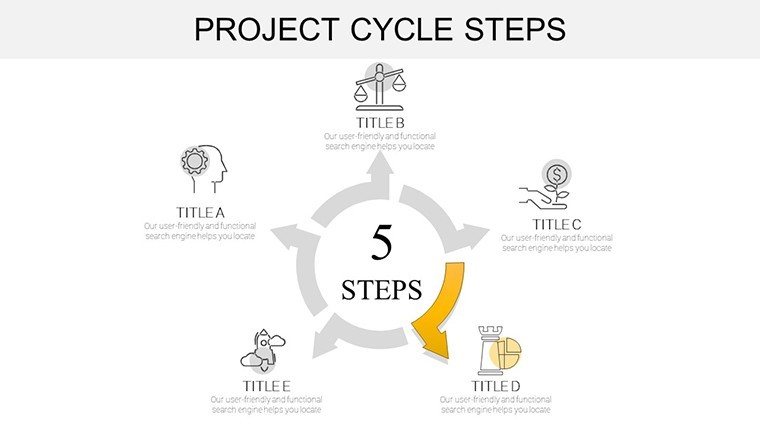
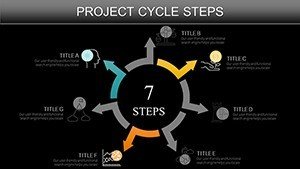
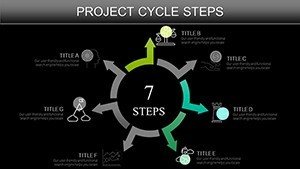
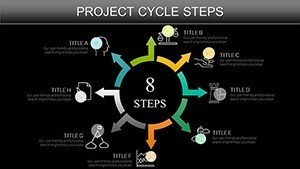
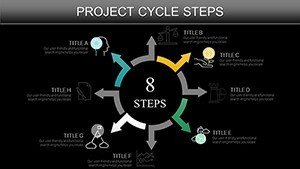
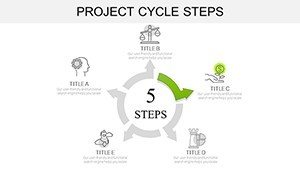
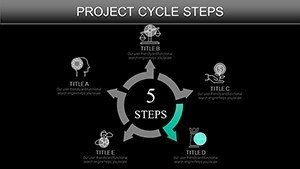
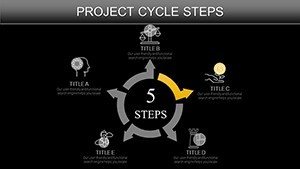
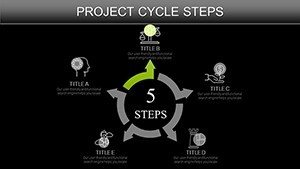
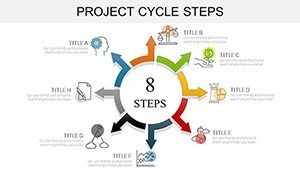
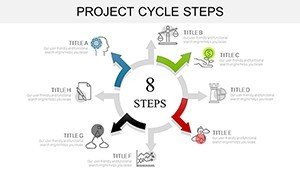
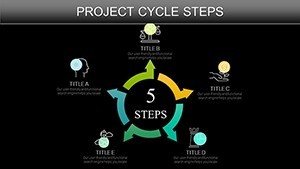
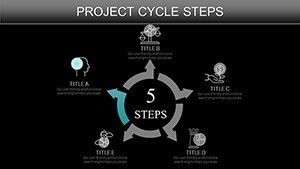
Slide 1 launches with a holistic project cycle overview, a circular flowchart encapsulating the five PM phases tailored to architecture - think arrows curving like structural arches. By Slide 15, you're deep in execution, with bar-stack charts tracking subcontractor syncs. Slide 30 wraps monitoring with heat-map cycles highlighting delay hotspots, culminating in a closure slide for post-mortem pie charts that distill wins and wisdoms.
Transformative Use Cases: Architecture in Action
Picture a boutique firm tackling a LEED-certified office retrofit. Facing fragmented stakeholder input, they leveraged our template's initiation slides to map expectations, slashing misalignments early. The result? A project delivered 15% under budget, with visuals that wowed the board.
Versatile Scenarios:
- Stakeholder Updates: Quarterly cycles to track variances, keeping investors looped in without jargon overload.
- Risk Workshops: Planning slides for brainstorming mitigation cycles, turning threats into fortified strategies.
- Bid Proposals: Closure previews to forecast ROI, sealing deals with data-driven confidence.
Workflow hack: Sync with BIM software for live feeds into monitoring charts, creating a digital twin of your project's pulse.
Expert Tips: Polishing Your PM Presentations
Pro move: Incorporate AIA guidelines into planning slides for instant credibility. Animate phase transitions to mimic build progression, adding narrative depth. For humor in tense meetings, quip, "This cycle's tighter than a deadline!" Always preview on client hardware to nail the reveal.
Seize control of your projects - secure this template today and cycle toward architectural excellence.
Frequently Asked Questions
Q1: Is this template aligned with standard project management frameworks?A: Yes, inspired by PMBOK but customized for architecture, covering all key phases.
Q2: Can I add my own branding elements?A: Effortlessly - swap colors, fonts, and logos across all 37 slides.
Q3: Does it support collaboration in Google Slides?A: Fully; real-time edits make team reviews a breeze.
Q4: Are there built-in templates for risk assessment?A: Included in planning sections, with editable matrices.
Q5: How to handle large datasets?A: Link external sources for automatic scaling and refresh.
Q6: What's the file size for quick sharing?A: Optimized under 10MB, zips nicely for email.