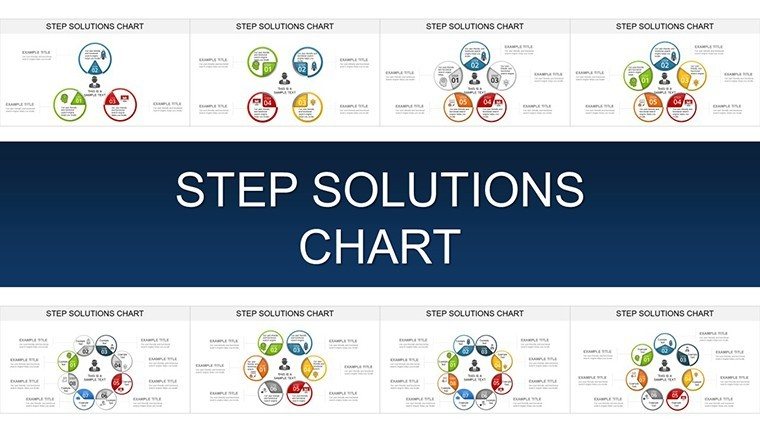
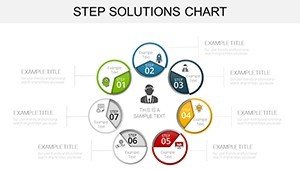
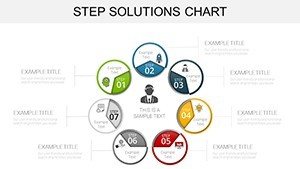
Step Solutions PowerPoint Charts: Master Problem-Solving Presentations


Type: PowerPoint Charts template
Category: Cycle
Sources Available: .pptx
Product ID: PC00905
Template incl.: 29 editable slides
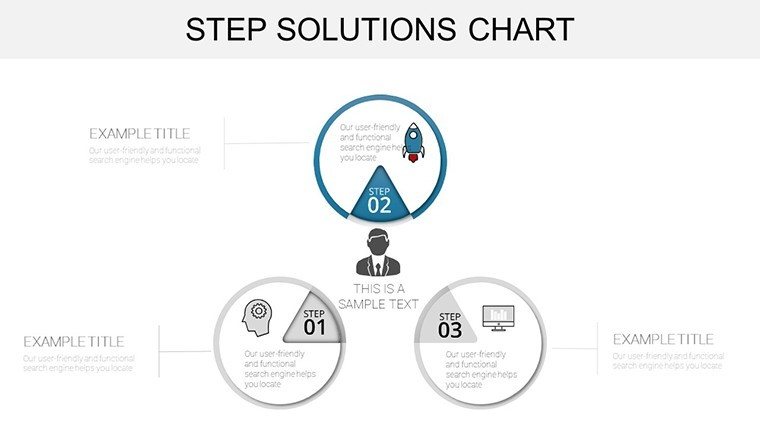
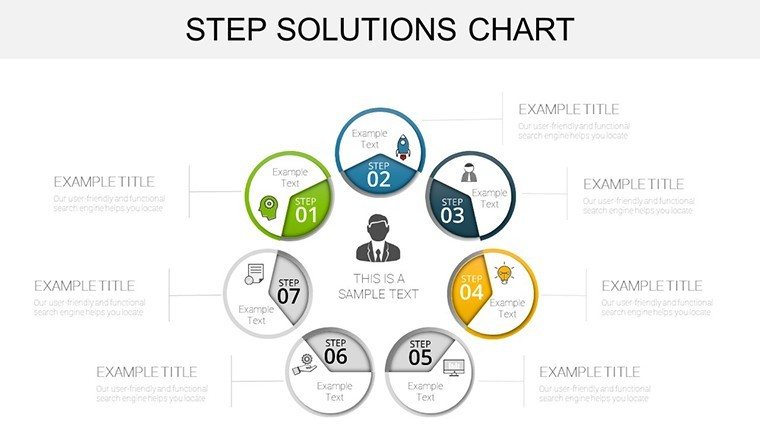
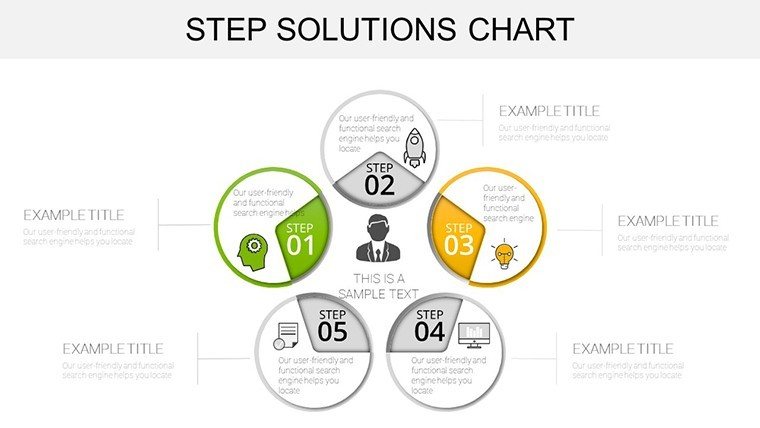
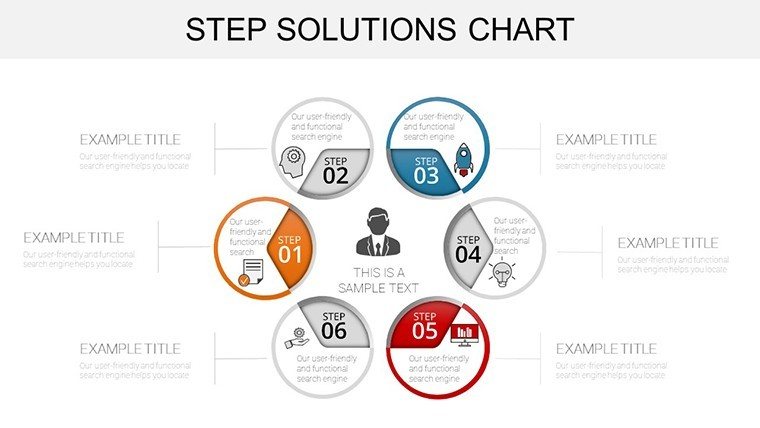
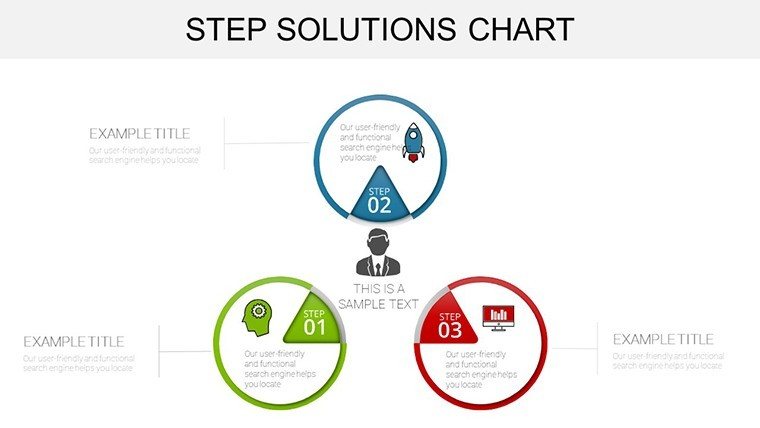
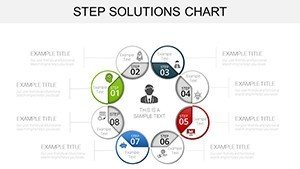
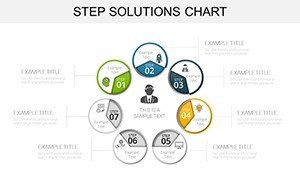
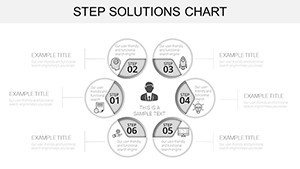
Navigating complex problems requires more than words; it demands visuals that guide and inspire. Our Step Solutions PowerPoint Charts Template delivers exactly that, with 29 editable slides crafted to illuminate pathways from challenge to resolution. Suited for business leaders tackling operational hurdles or teachers breaking down concepts, this template transforms ideas into actionable steps, fostering understanding and action.
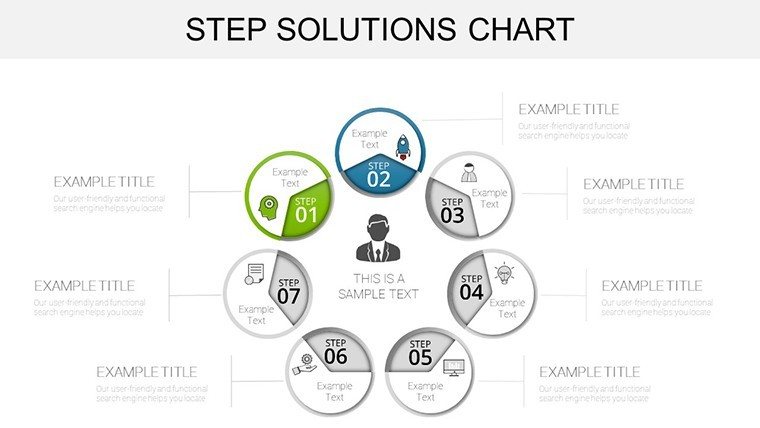
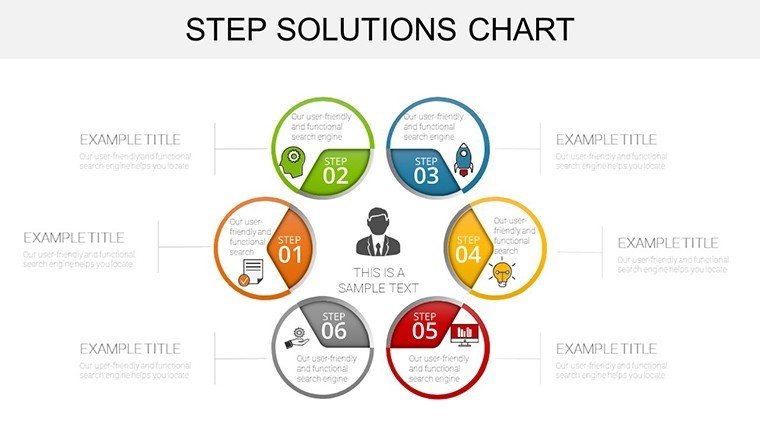
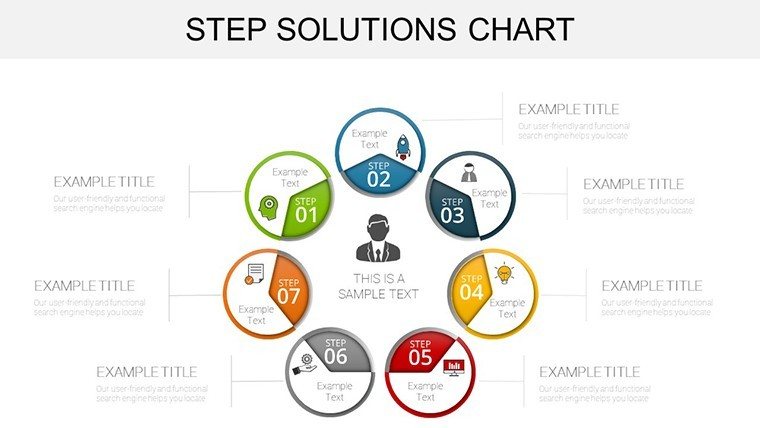
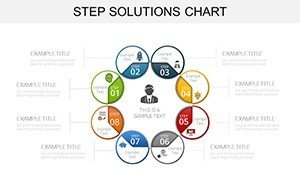
Rooted in proven methodologies like Six Sigma's DMAIC framework, it helps you present solutions with authority, much like how consultants at McKinsey use structured visuals to drive client transformations. The cycle category placement ensures fluid, looping narratives for ongoing processes, making it versatile across sectors. Download and adapt it to PowerPoint or Google Slides for presentations that not only inform but motivate.
Essential Features for Effective Communication
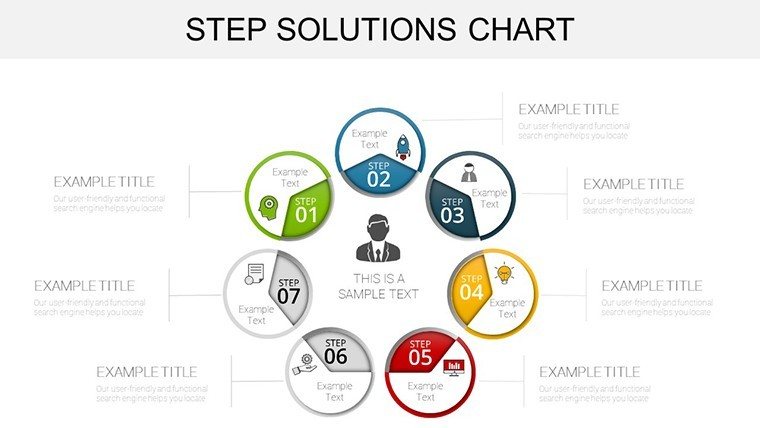
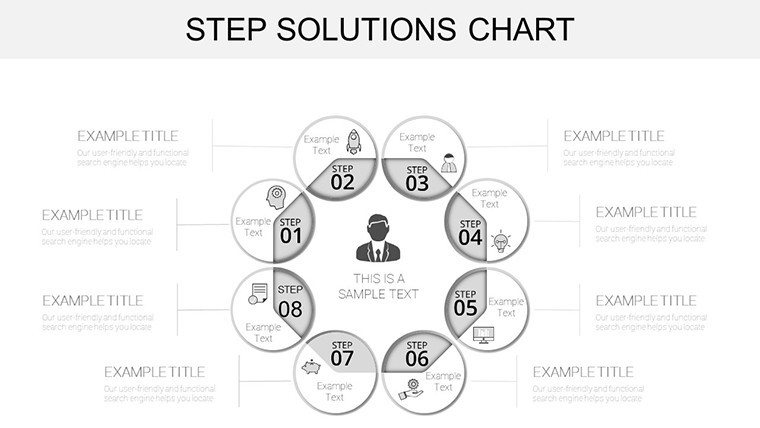
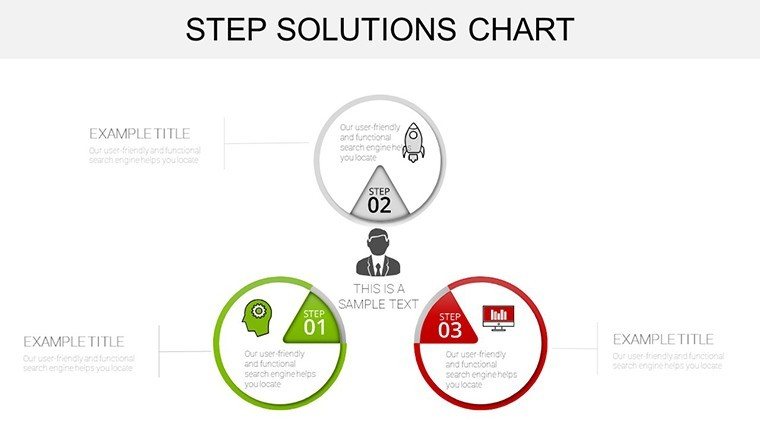
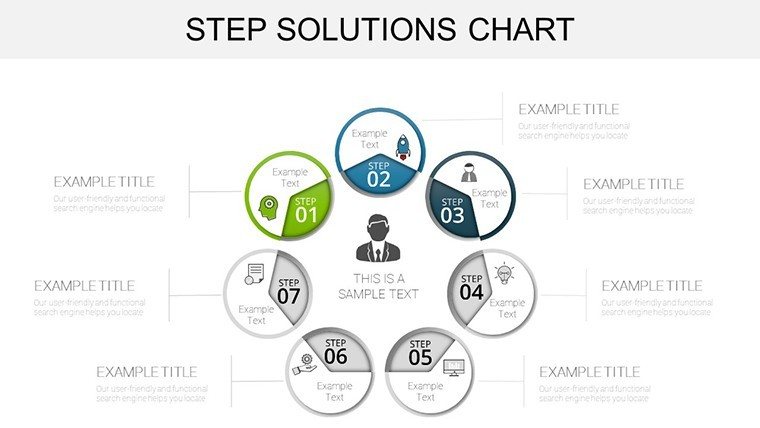
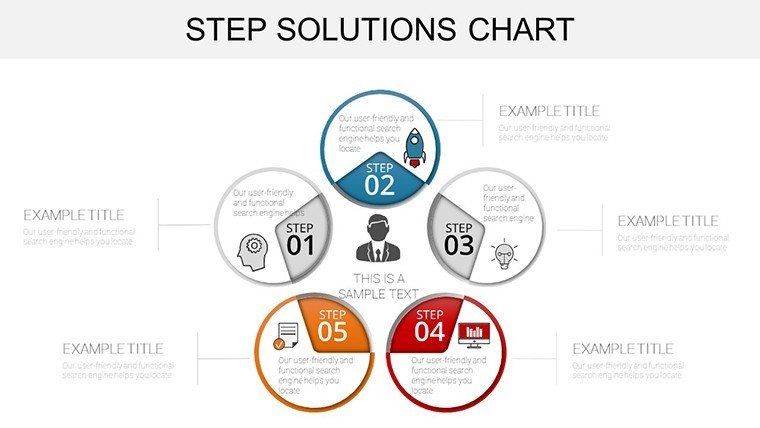
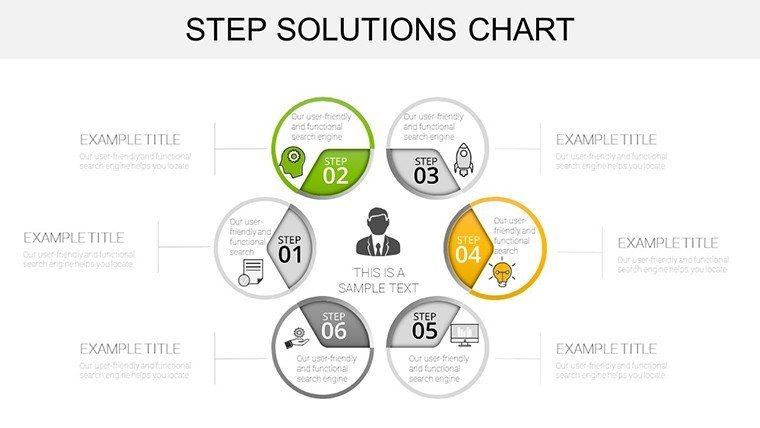
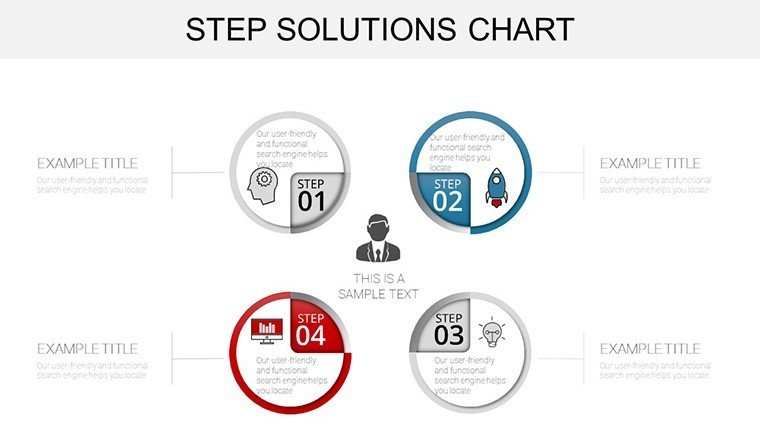
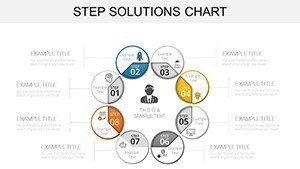
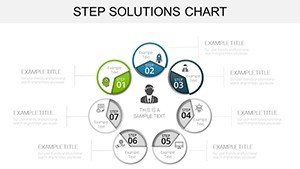
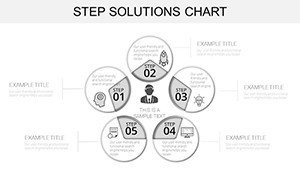
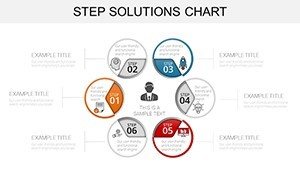
At its core, this template shines with multiple step-by-step layouts, allowing you to map out processes with precision. Colorful graphics draw the eye, while easy edits let you personalize without hassle, ensuring your message aligns with audience needs.
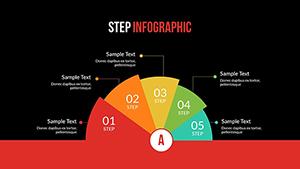
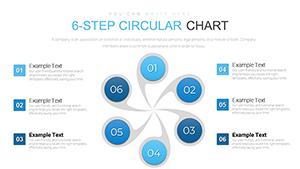
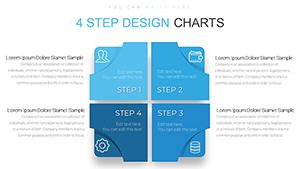
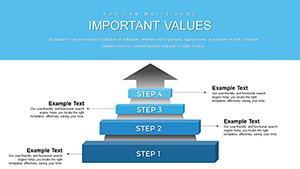
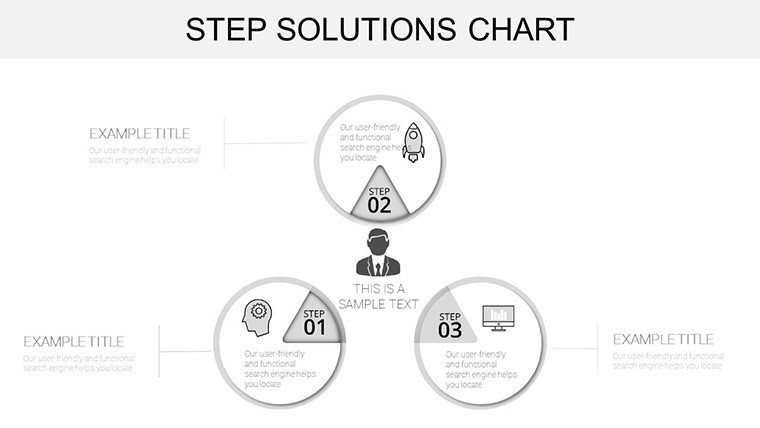
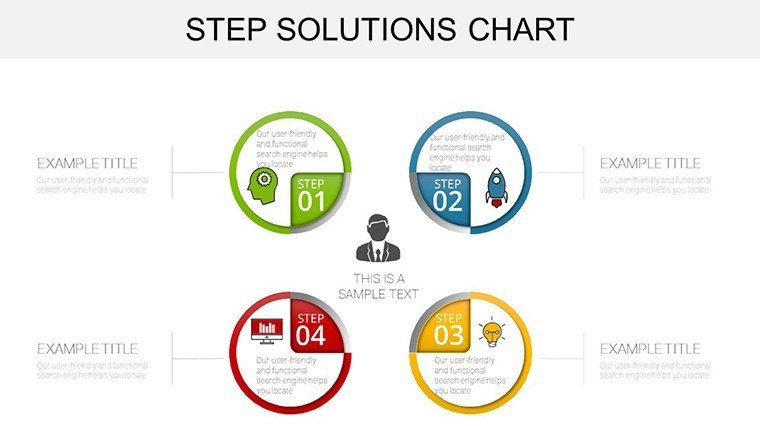
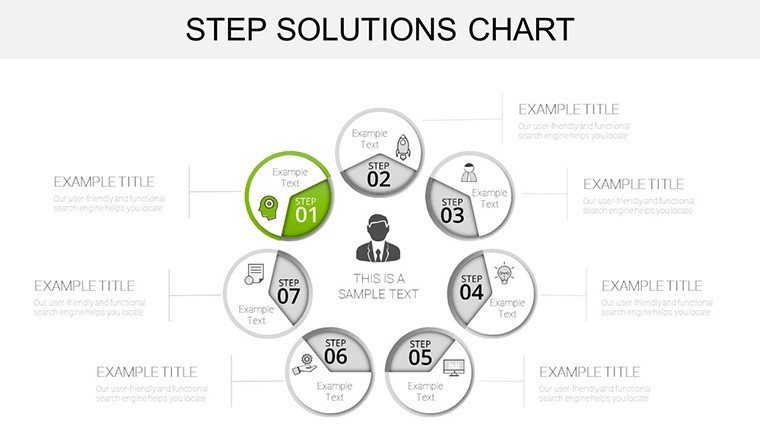
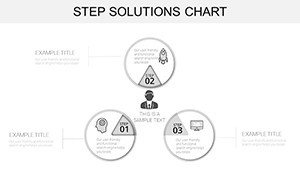
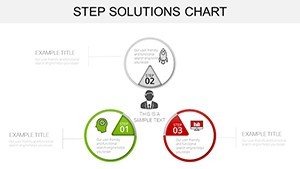
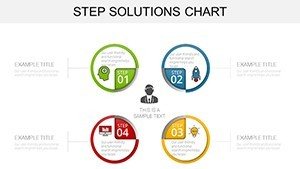
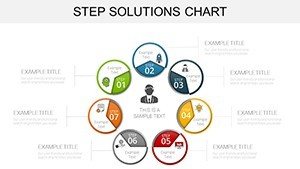
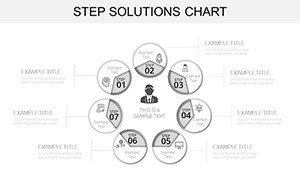
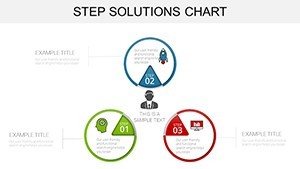
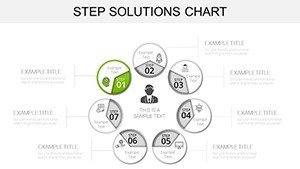
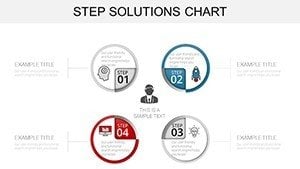
- Step-by-Step Layouts: Sequential designs for workflows, from ideation to execution.
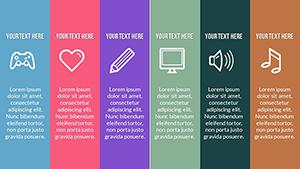
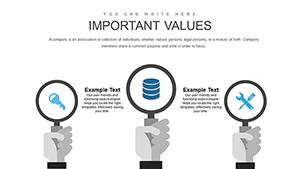
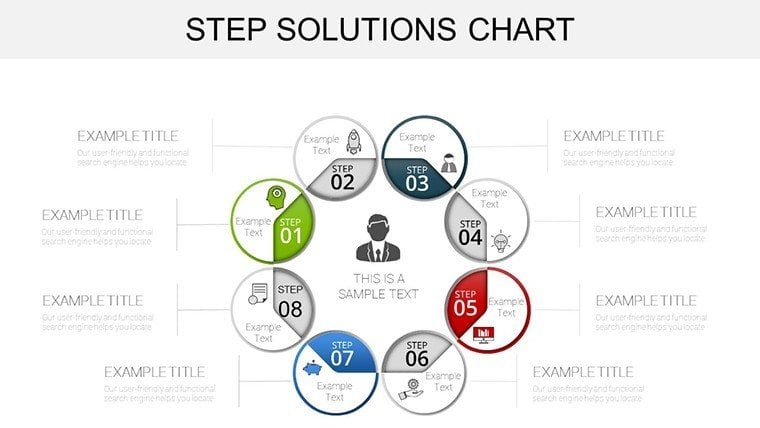
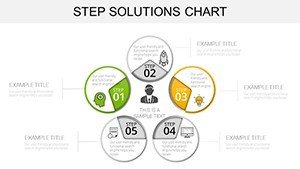
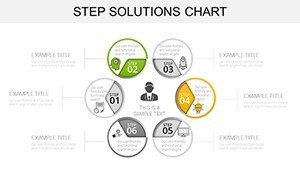
- Vibrant Graphics: Eye-catching elements that enhance retention and engagement.
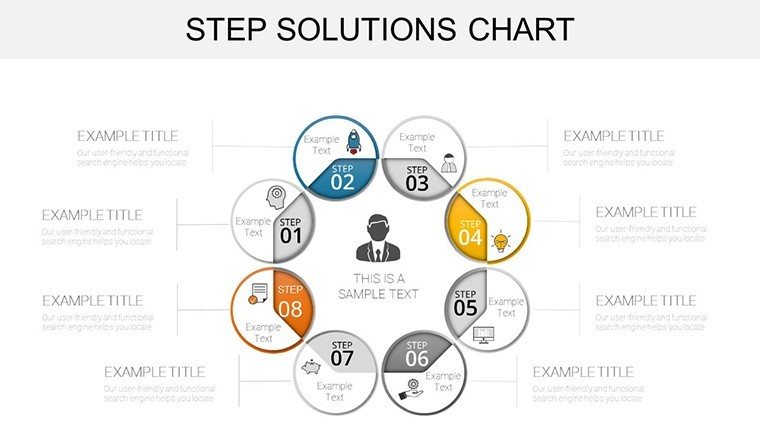
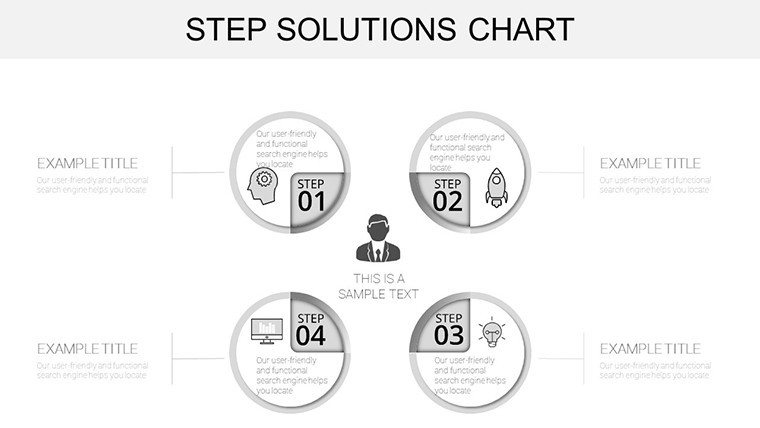
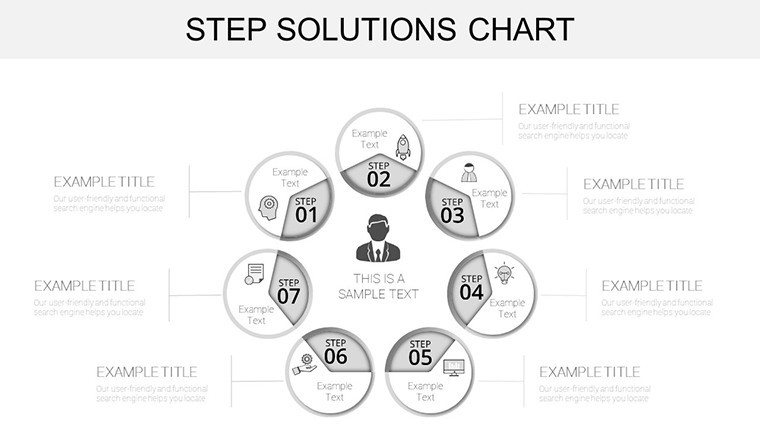
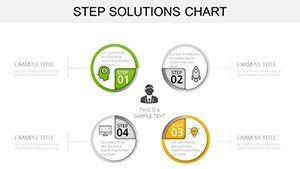
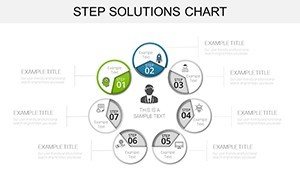
- Customization Tools: Adjust shapes, texts, and colors to fit your brand seamlessly.
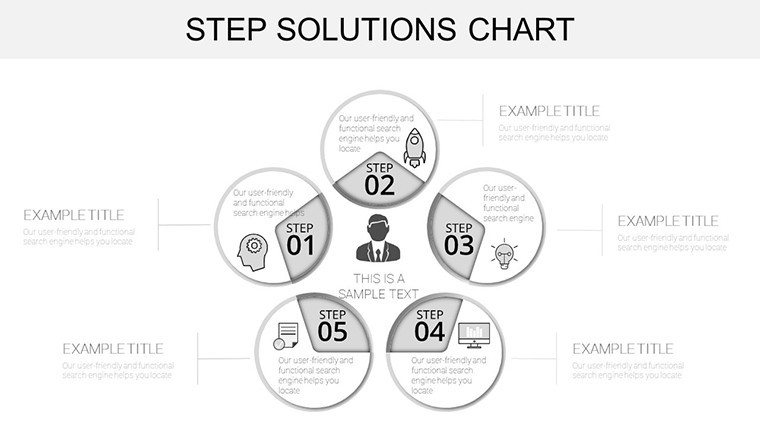
- Flexible Options: Adapt slides for topics like project management or sales funnels.
These features culminate in a professional polish, elevating your slides beyond basic defaults.
Comprehensive Slide Exploration
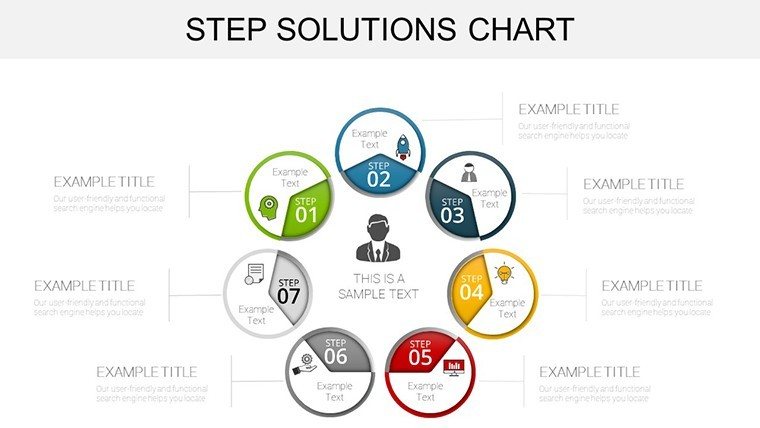
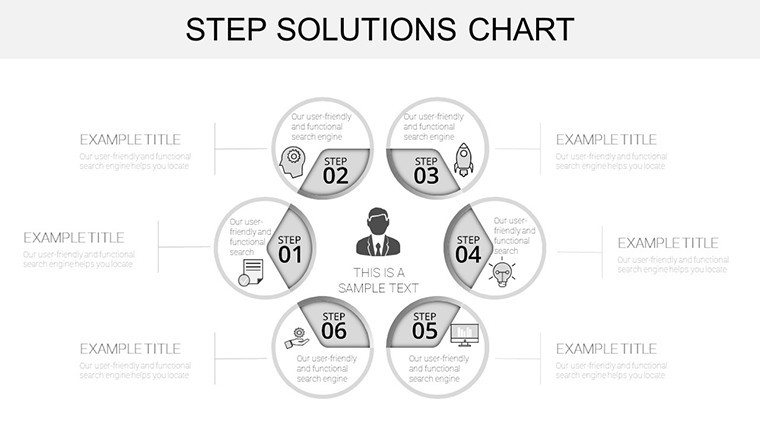
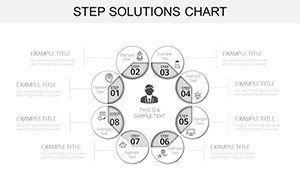
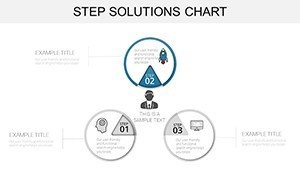
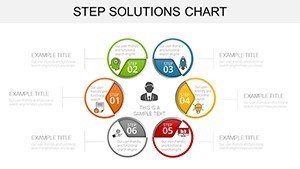
The 29 slides cover a spectrum: Introductory overviews set problems, mid-slides detail steps with diagrams, and finales summarize outcomes. Incorporate icons for quick scans, aligned with usability standards from the Interaction Design Foundation.
Diverse Applications in Professional Settings
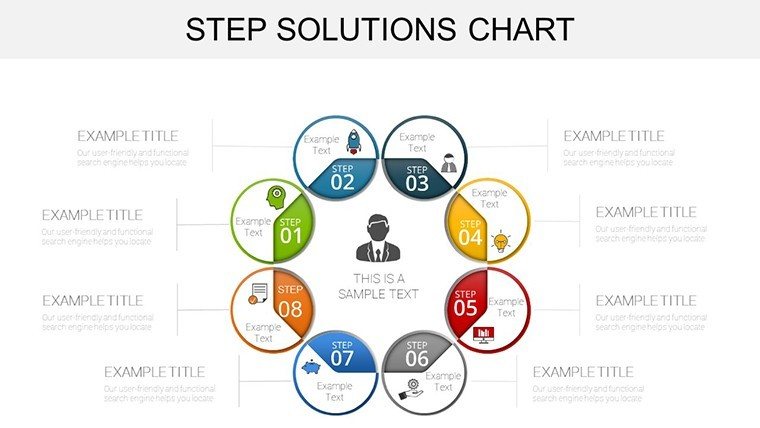
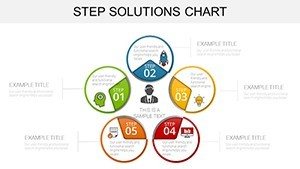
Imagine a marketer outlining campaign steps to boost conversions, using phased charts to show progression. Or a researcher presenting findings with cyclical diagrams, clarifying iterations. In education, simplify lessons on scientific methods through visual steps.
- Executive Meetings: Detail strategy rollouts with milestone markers.
- Consulting Sessions: Illustrate client solutions with tailored pathways.
- Academic Lectures: Teach processes like historical events in sequence.
- Team Workshops: Facilitate brainstorming with interactive step maps.
Drawn from case studies, such as how similar tools aided agile teams in reducing project timelines, integration is simple: Select a layout, input data, refine, and deliver.
Insider Tips for Stellar Results
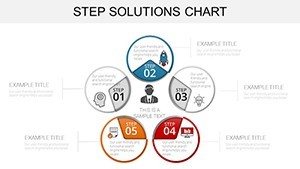
Optimize by using contrasting colors for steps, per color theory insights. Add animations to reveal phases gradually, keeping pace with your narration. For trust, embed data from sources like Harvard Business Review on problem-solving efficacy.
This template outshines generics with its cycle-focused designs, ideal for recursive processes like continuous improvement.
Your Advantage in Dynamic Environments
With 453 ratings endorsing its utility, at $20 it's a smart choice for impactful visuals that stand out.
Empower your next presentation - grab this template and turn steps into successes.
Frequently Asked Questions
- How many customization options are there?
- Endless - edit every element to match your needs.
- Compatible with what software?
- PowerPoint and Google Slides for broad use.
- Best for which audiences?
- Professionals in business, education, and research.
- Can I add my own graphics?
- Yes, integrate seamlessly.
- Improves what aspect of presentations?
- Clarity and engagement through structured visuals.
- Tutorials available?
- Site resources guide you.