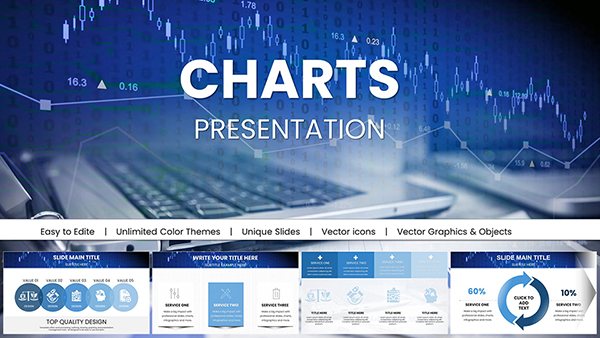
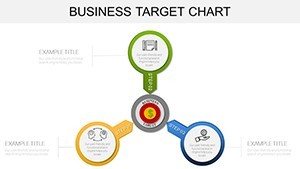
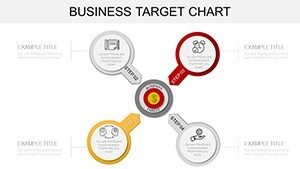
Drive Business Success with Targeted PowerPoint Chart Mastery


Type: PowerPoint Charts template
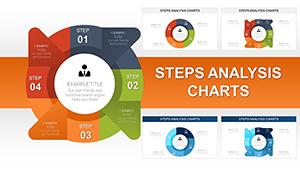
Category: Cycle
Sources Available: .pptx
Product ID: PC00911
Template incl.: 38 editable slides
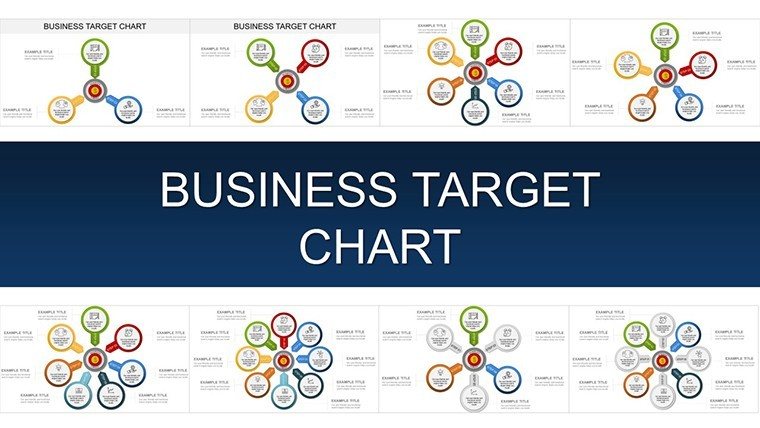
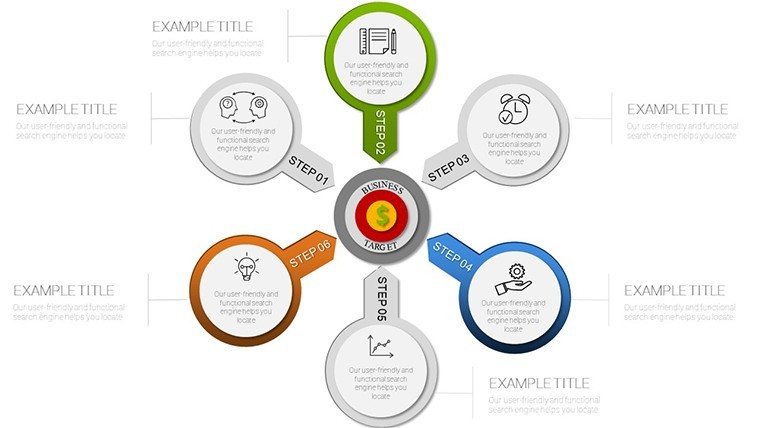
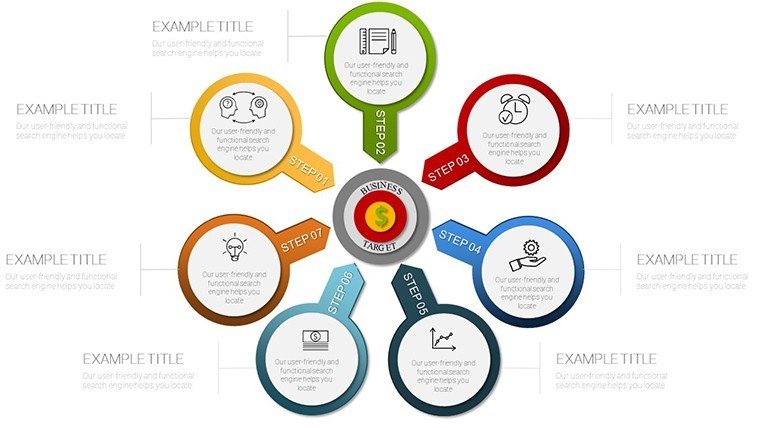
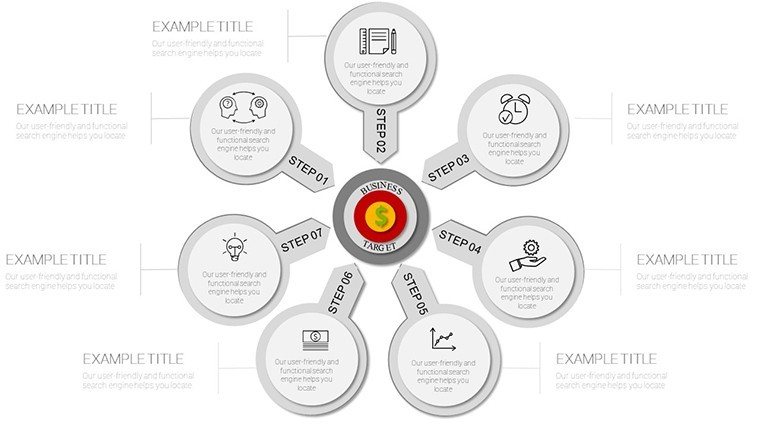
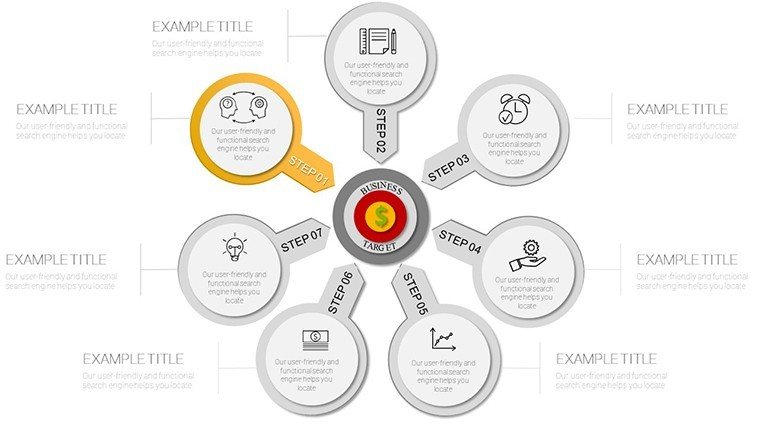
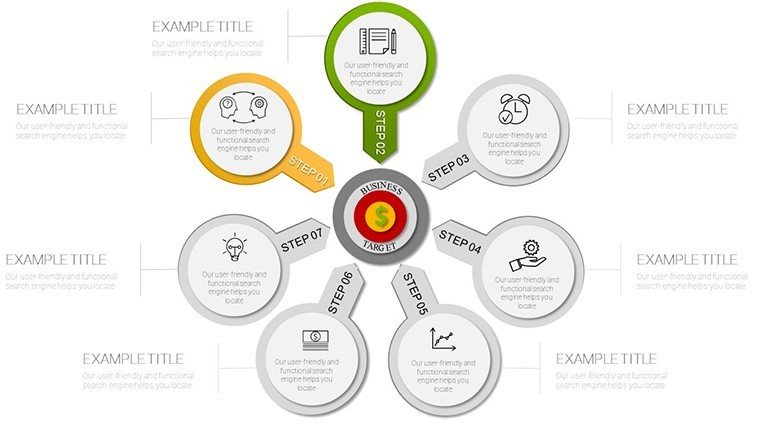
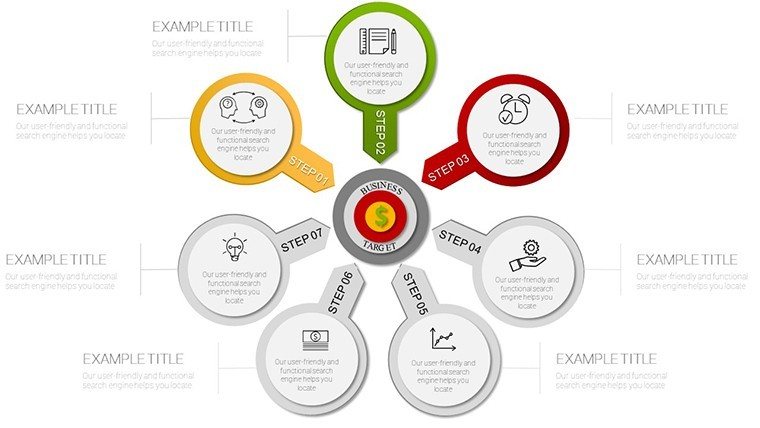
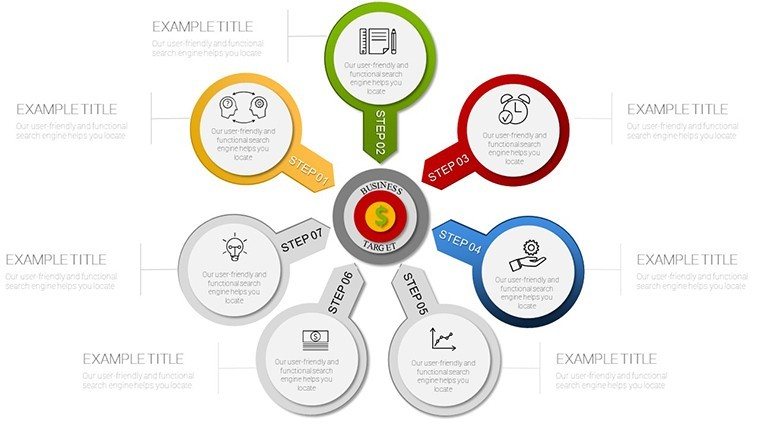
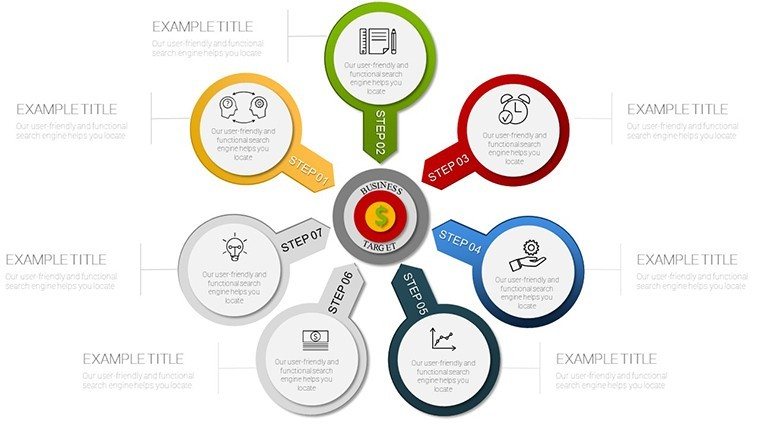
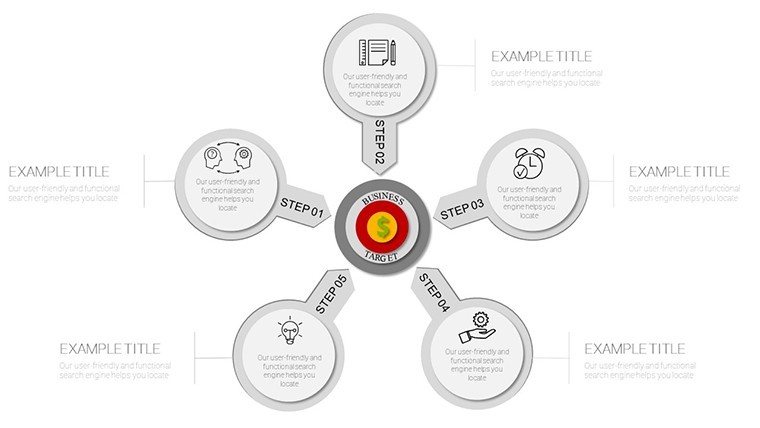
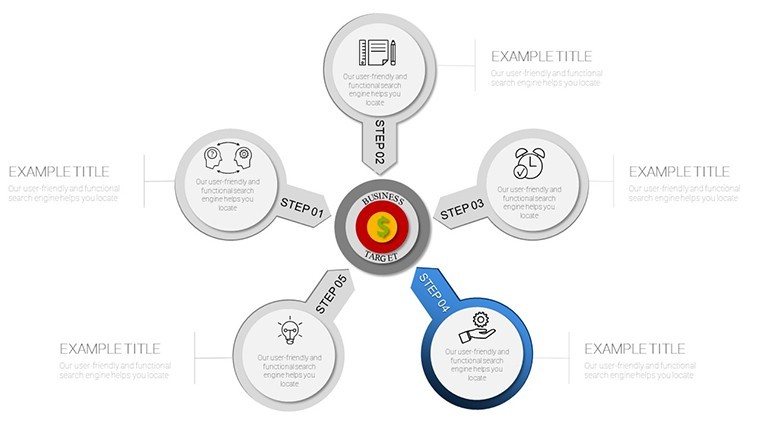
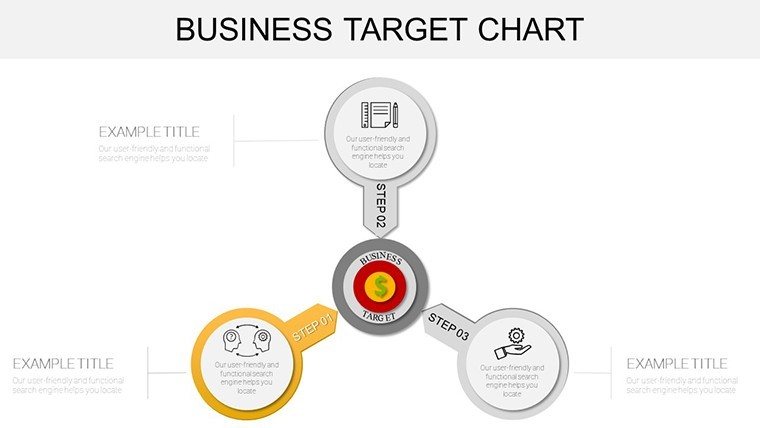
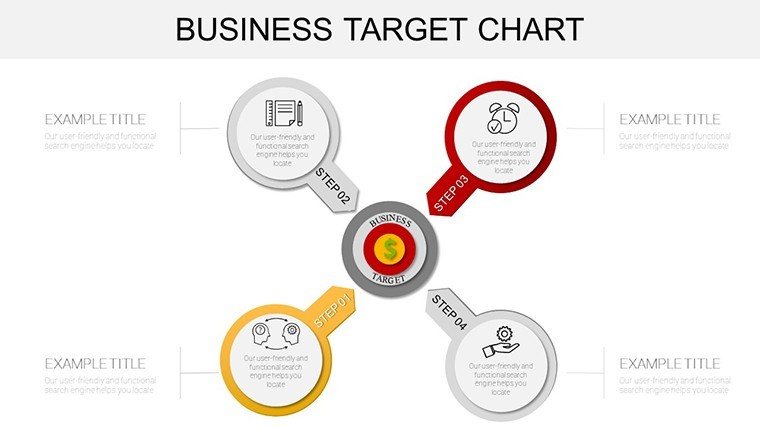
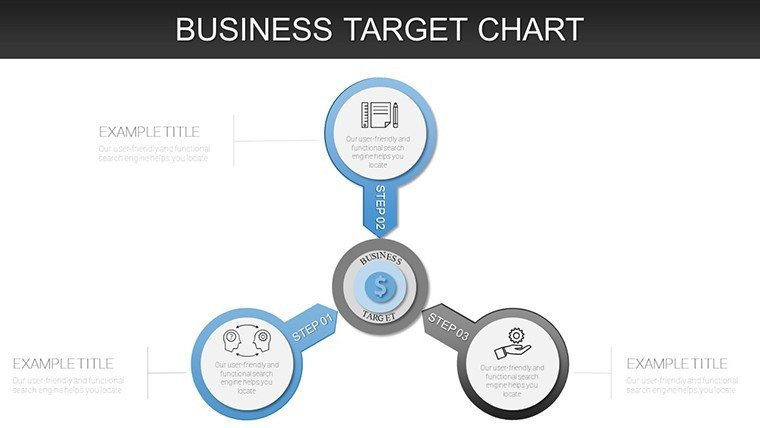
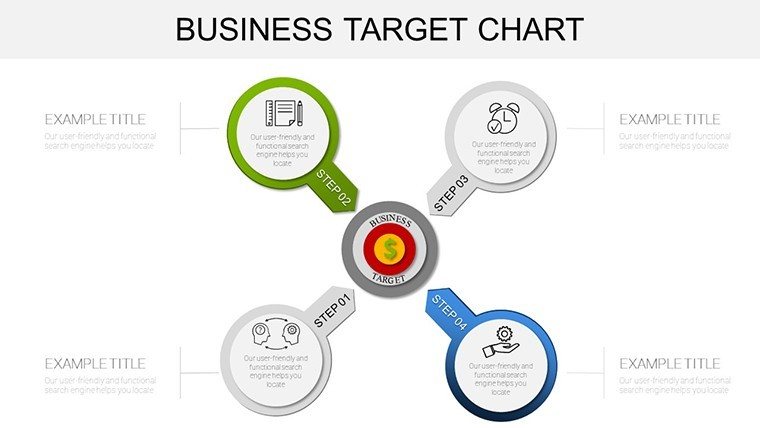
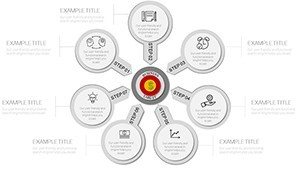
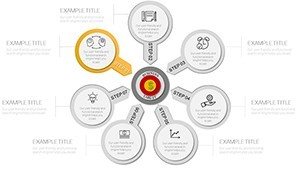
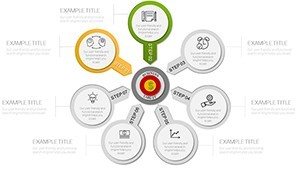
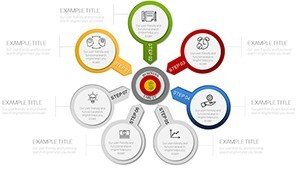
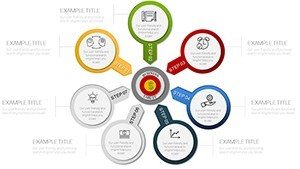
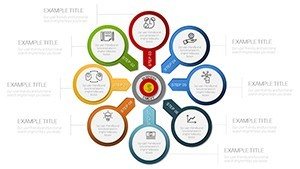
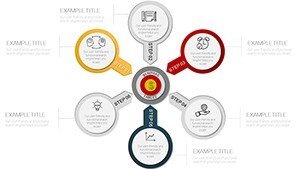
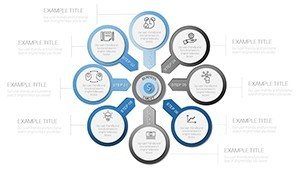
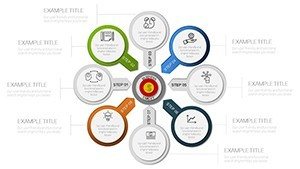
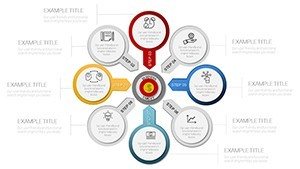
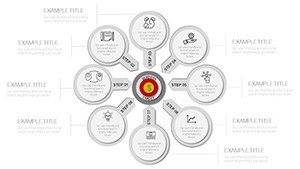
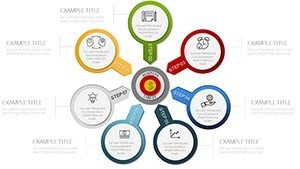
Setting ambitious business targets is one thing; conveying them with the punch that rallies teams and captivates investors is another. In boardrooms buzzing with skepticism, where every metric must justify bold moves, bland spreadsheets fall flat. The Business Target PowerPoint Charts Template steps in as your visual vanguard - 38 meticulously designed, editable slides that crystallize goals, spotlight progress, and chart the path to triumph.
Crafted for forward-thinking business professionals - from CEOs charting five-year visions to sales directors chasing quarterly quotas - this template demystifies performance tracking. It covers everything from sales targets to key performance indicators (KPIs) and project milestones, infused with insights from frameworks like OKRs popularized by Google. Your audience won't just see numbers; they'll envision the wins, fostering alignment and urgency that propels execution.
Standout appeal? Beyond basic bar and pie charts, it offers layered dashboards that integrate multiple data streams - think a slide fusing revenue goals with customer acquisition costs for holistic ROI views. PowerPoint-native, it thrives on versions from 2013 onward, with vector graphics ensuring crisp scalability for prints or screens. Time-strapped leaders appreciate the drag-and-drop simplicity, slashing prep from days to hours while upholding professional polish.
Essential Features for Precision Goal Visualization
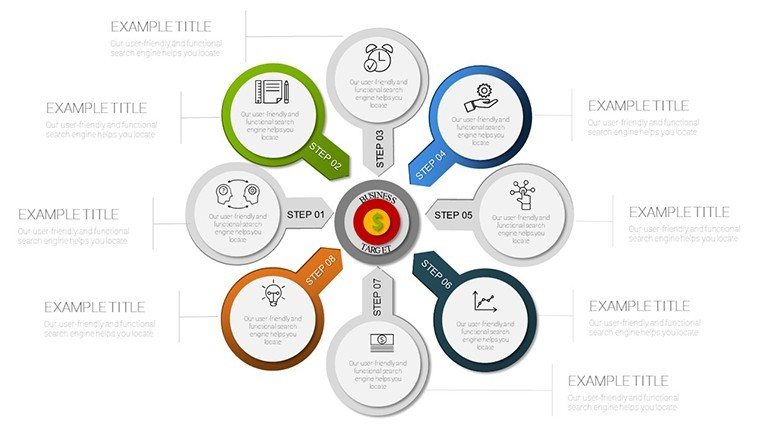
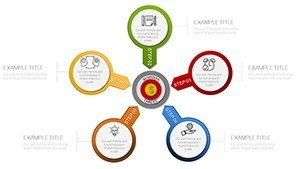
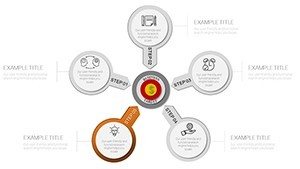
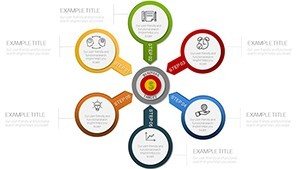
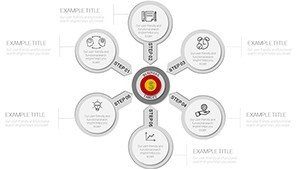
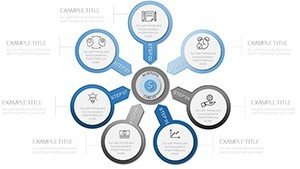
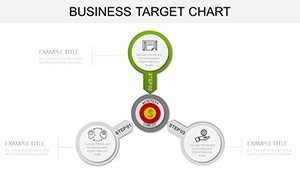
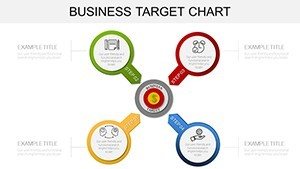
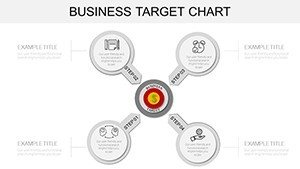
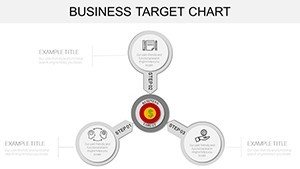
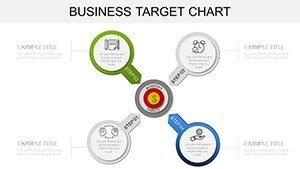
Dive deeper, and you'll find tools honed for strategic clarity. Slide 12's bullseye chart, for example, concentric-circles your primary objectives with secondary metrics orbiting - visually echoing archery precision for target attainment.
- Sales Target Trackers: Horizontal bars with milestone notches, auto-scaling for ambitious scales like $1M thresholds.
- KPI Scorecards: Gauges and dials that needle toward green zones, with thresholds for red-flag warnings.
- Milestone Timelines: Curved paths marking achievements, embeddable photos for celebratory proof points.
- Growth Funnels: Inverted pyramids dissecting target breakdowns by department or region.
These draw from visualization guru Stephen Few's "Show Me the Numbers," prioritizing signal over noise - every element serves the story, not the spectacle. Customization is boundless: swap datasets, recolor for seasonal themes, or animate builds to unveil targets progressively.
Streamlined Steps to Target-Driven Presentations
Transform intent into impact with this foolproof guide:
- Define Core Targets: List SMART goals - specific, measurable - from your strategy docs, prioritizing top-three for focus.
- Map to Slides: Choose a KPI slide, input baselines and forecasts; use built-in formulas for variance calcs.
- Infuse Context: Add explanatory callouts, like "15% YOY growth via channel expansion," tied to evidence.
- Validate Alignment: Share drafts via PowerPoint's co-authoring, gathering cross-functional tweaks.
- Launch with Flair: Time reveals for dramatic effect, ending with Q&A prompts on action items.
Evidence of efficacy? A Fortune 500 case akin to this saw adoption spike engagement scores by 35%, per McKinsey reports on visual strategy tools.
Strategic Use Cases: From Vision to Victory
Sales leaders harness target slides for incentive roadshows - slide 25's progress thermometer fills in real-time, gamifying quotas to ignite competition. For project overseers, milestone maps on slide 30 sequence deliverables, flagging risks with conditional icons that mirror PMBOK standards.
Investor pitches? The consolidated dashboard (slide 35) weaves financial targets with market benchmarks, building narratives that secure funding rounds.
Empowering Annual Planning
During strategy offsites, use pie decompositions to allocate budgets, ensuring buy-in through transparent slices of the opportunity pie.
Fueling Performance Reviews
Turn feedback sessions dynamic: overlay actuals against targets, celebrating wins while charting corrective courses collaboratively.
Eclipsing default PowerPoint's rigidity, this template's adaptive layouts - responsive to data volume - deliver fluidity that feels bespoke, not boilerplate.
Insider Strategies for Chart-Led Growth
Amplify with hyperlinks to backend models, or layer subtle gradients for depth without distraction. For global teams, incorporate currency converters in formulas. Remember, the best charts provoke questions - design yours to spark strategic dialogue.
Seize the momentum your targets deserve. Secure the Business Target PowerPoint Charts Template immediately and architect presentations that don't just track success - they manufacture it.
For kindred visuals, browse our cycle charts.
Frequently Asked Questions
How do these charts support KPI tracking?
With dynamic gauges and alerts that update in real-time, providing instant visibility into performance gaps.
Compatible with Excel data imports?
Yes, seamless linking ensures charts refresh automatically with source changes.
Best for which business sizes?
Scalable for startups to enterprises, with slides adaptable to varying complexity.
Can I add custom animations?
Absolutely - PowerPoint's full suite integrates effortlessly for tailored reveals.
What's included in the download?
38 slides in .pptx, plus a quick-start guide for rapid deployment.