Africa PowerPoint Maps
These templates contain layered country and regional maps of Africa for Microsoft PowerPoint that let you add data labels and color fills without redrawing borders. A strategy consultant mapping expansion plans for a client in Nairobi can drop in sales figures and move to the recommendation slide.
The slide master structure keeps labels readable at 16:9 and locks the color palette to brand standards. Use these when the board meeting agenda includes geographic performance and the clock is tight.
Download the map file that covers your target countries and open it in PowerPoint.
 (703)
(703) Editable Algeria Map PowerPoint Template: Professional Slides for Impactful PresentationsID: #PM00224$38.00
 (344)
(344) Botswana PowerPoint Maps Template: Delta into Diamond DynamicsID: #PM00223$38.00
 (738)
(738) Egypt PowerPoint Maps Template: Chart the Nile's Eternal FlowID: #PM00222$42.00
 (715)
Kenya PowerPoint Maps: Ignite Your East African NarrativesID: #PM00221$37.00
(715)
Kenya PowerPoint Maps: Ignite Your East African NarrativesID: #PM00221$37.00 (145)
Libya Maps PowerPoint Template: Echoes of EmpiresID: #PM00220$40.00
(145)
Libya Maps PowerPoint Template: Echoes of EmpiresID: #PM00220$40.00 (402)
Morocco PowerPoint Maps: Weave Tales from the AtlasID: #PM00219$38.00
(402)
Morocco PowerPoint Maps: Weave Tales from the AtlasID: #PM00219$38.00 (1022)
Zimbabwe Maps PPT Template: Chart the Land of LegendsID: #PM00218$38.00
(1022)
Zimbabwe Maps PPT Template: Chart the Land of LegendsID: #PM00218$38.00 (768)
Tanzania Maps PowerPoint Template: Visualize the Safari SpiritID: #PM00217$38.00
(768)
Tanzania Maps PowerPoint Template: Visualize the Safari SpiritID: #PM00217$38.00 (939)
Somalia PowerPoint Maps Presentation Template: Download PPTID: #PM00216$35.00
(939)
Somalia PowerPoint Maps Presentation Template: Download PPTID: #PM00216$35.00 (508)
Namibia PowerPoint Maps Template: Sculpting Stories from SandID: #PM00215$56.00
(508)
Namibia PowerPoint Maps Template: Sculpting Stories from SandID: #PM00215$56.00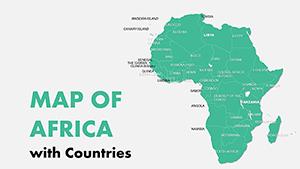 (342)
Editable Africa Countries PowerPoint Maps: Download PPTID: #PM00158$16.00
(342)
Editable Africa Countries PowerPoint Maps: Download PPTID: #PM00158$16.00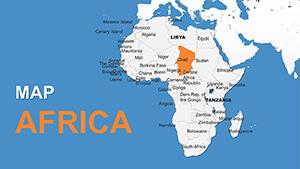 (896)
Africa with Countries PowerPoint Maps Template: Download PPTID: #PM00157$16.00
(896)
Africa with Countries PowerPoint Maps Template: Download PPTID: #PM00157$16.00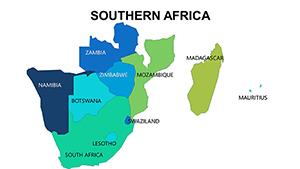 (495)
Southern Africa PowerPoint Maps Template: Spotlight the Southern StarsID: #PM00076$24.00
(495)
Southern Africa PowerPoint Maps Template: Spotlight the Southern StarsID: #PM00076$24.00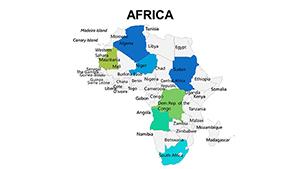 (1031)
 Africa PowerPoint Maps Template: Safari Through StoriesID: #PM00075$25.00
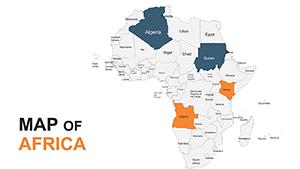 (520)
Africa PowerPoint Maps Template: Customizable & ProID: #PM00053$45.00
(520)
Africa PowerPoint Maps Template: Customizable & ProID: #PM00053$45.00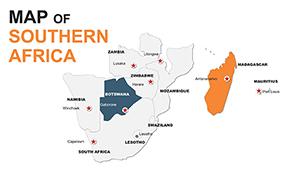 (1020)
Editable Southern Africa Maps PowerPoint TemplateID: #PM00052$50.00
(1020)
Editable Southern Africa Maps PowerPoint TemplateID: #PM00052$50.00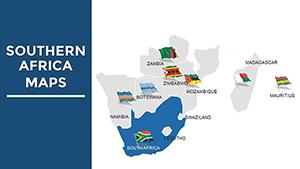 (759)
South Africa PowerPoint Maps: Capturing the Rainbow Nation's DiversityID: #PM00009$40.00
(759)
South Africa PowerPoint Maps: Capturing the Rainbow Nation's DiversityID: #PM00009$40.00 (458)
Africa Countries PowerPoint Maps: Continental CanvasID: #PM00008$45.00
(458)
Africa Countries PowerPoint Maps: Continental CanvasID: #PM00008$45.00
How do PowerPoint map templates support geographic storytelling without extra design work?
Each map uses vector shapes grouped on the slide master so color fills and data callouts stay aligned when you update numbers. The hierarchy places the country name first, the metric second, and the implication third.
What hesitation disappears once you open the file?
You no longer worry whether the borders will distort when you scale the slide or whether the legend will overlap the map at presentation size.
Real business moments where these maps change the conversation
A supply chain director presenting logistics routes to the operations committee colors the key African ports. The pre-layered map shows travel times instantly, shifting the discussion from data accuracy to cost-saving decisions.
An NGO coordinator reporting donor fund allocation across East Africa uses the regional overlay. Labels remain visible in the large conference room and the color key matches the annual report.
A market researcher showing mobile penetration by country for a telecom investor loads the detailed map. The slide master ensures font sizes are consistent when the deck is printed for the board pack.
A government affairs lead preparing the regulatory landscape overview colors countries by risk level. The action takeaway box is already positioned so the executive team focuses on next steps.
Why building maps manually costs the project more than time
You spend hours tracing borders, aligning labels, and creating a legend that matches the rest of the deck. Those steps break consistency across the 30-slide report and force last-minute fixes before the PDF export.
Non-obvious tip that saves hours on map edits
Ungroup the country shapes once, apply your data-driven color fills, then regroup and link the fill to an Excel table. Future quarterly updates then refresh with one click.
Technical detail specific to PowerPoint maps
When you embed the map as a picture instead of editable shapes the file size drops but you lose the ability to recolor on the slide master. Keep shapes editable and test PDF export with the target projector settings to avoid line weight changes.
What sets this collection apart for corporate geography work
The maps prioritize data overlay and readability over artistic detail. Every element is fully editable yet structured for recurring quarterly reporting across departments.
If your presentation also needs data charts, combine these with PowerPoint chart templates. For North American markets see North America PowerPoint maps templates. Teams that present both geography and contact details often add construction business cards templates for the final client handout.
Choose the map that covers your operating countries and download it now.
Are these PowerPoint maps compatible with Microsoft 365 and older versions?
Yes, the files open in PowerPoint 2016 and all Microsoft 365 versions. Vector shapes remain editable and slide master styles carry over. On older versions without SVG support the maps fall back to grouped objects - ungroup once and regroup after any color change to restore full control.
Can I use these maps in client deliverables and printed reports?
Yes, the license allows editing and inclusion in commercial presentations and PDF reports. Keep the source file internal and deliver only the finished deck or printout. The maps export cleanly to high-resolution PDF for board books.
Do the templates support 4:3 aspect ratio for older projectors?
All default to 16:9. Duplicate the deck, go to Design → Slide Size → Custom, enter 4:3, and the vector map objects scale proportionally. Re-check label positions after the change and adjust any overlapping callouts.
Is team sharing and editing permitted under the license?
Yes, internal team members and client-facing colleagues may edit the same file. Use OneDrive or SharePoint for version control. The license does not allow redistribution of the blank template itself.