Master virtual data displays with our Keynote charts templates, engineered for online precision. Featuring scalable vectors, hover effects, and theme harmony, they`re suited for finance recaps, marketing metrics, or project updates in remote settings.
These tools turn raw numbers into narratives, with pre-built axes and legends that adapt to your dataset. No more wrestling with misaligned bars - drag, drop, and present with poise.
Spanning pie charts to timelines, our online-focused designs ensure legibility on shared screens. Enhance engagement by embedding tooltips for deeper dives without cluttering slides.
Visualize victory - dive into these Keynote charts templates and chart your course.
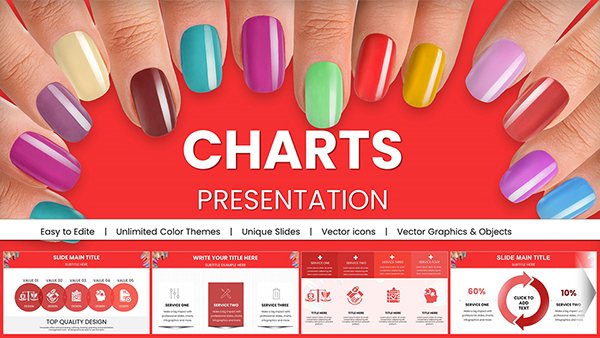
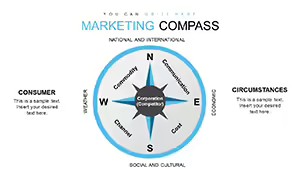
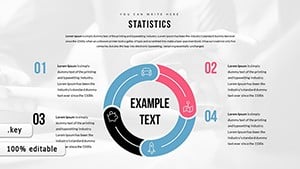
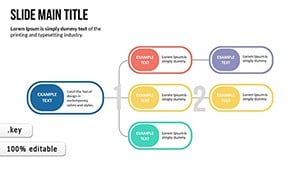
Analysis Slide Show Keynote Charts: Illuminate Data Relationships
ID: #KC00523
$19.00
(915)
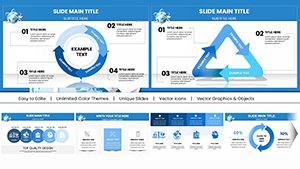
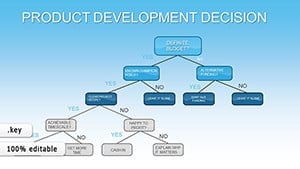
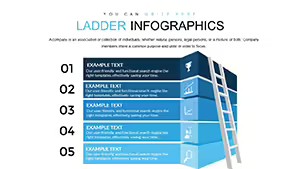
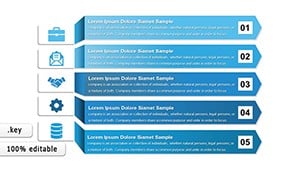
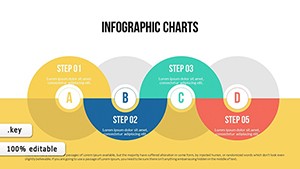
Process Keynote Charts Template: Streamline Your Workflows Visually
ID: #KC00517
$20.00
(559)
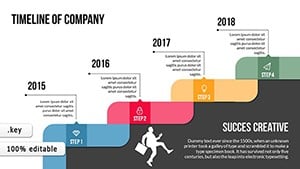
Company Timeline Keynote Charts - Instant Download | ImagineLayout
ID: #KC00498
$20.00
Why Our Charts Excel Online
Vector-based for infinite scaling without blur, these include color-blind modes and exportable SVGs - leaps beyond pixelated defaults. Real-time update links pull live data, keeping virtual dashboards fresh.
Hosts gain from concise load times, vital for international calls, boosting comprehension over static images.
Data-Driven Scenarios
Analytics Reviews: Funnel charts with drill-downs for cohort insights.
Project Tracking: Gantt variants with milestone hovers.
Sales Forecasts: Line graphs with confidence intervals.
Survey Results: Radial bars for demographic breakdowns.
They surpass basics with conditional formatting, auto-adjusting hues for outliers automatically.
Charting Best Practices
Anchors like consistent scales prevent distortion, and sans-serif labels ensure zoom-proof text. Animate builds sequentially to guide eyes through comparisons.
Innovate with 3D illusions for emphasis or heat maps for geographic trends, adding depth to flat virtual views.
Implementation Steps
Import data via CSV for auto-population.
Tweak styles to match deck themes.
Test interactions in presentation mode.
Add annotations for key takeaways.
Share via link for collaborative edits.
Streamlined for analysts, this yields pro results in minutes.
Amplifying Remote Insights
Educators use for lesson metrics; execs for KPI spotlights. Integration with Numbers app syncs spreadsheets effortlessly.
Plot your data`s power - select a Keynote charts template now.
Frequently Asked Questions
Trends in Digital Visualization
AI predictions overlay futures; VR embeds preview immersive analytics. A manager reported clearer decisions post-adoption.
70+ presets from simple to sophisticated, with how-tos. Community inputs shape additions like Sankey flows.
Combine with screen recordings for tutorial series. This multi-format approach maximizes reach.
For startups, free-tier compatibility lowers barriers. Scale as needs grow.
Unlock data`s story - endless possibilities await in these templates.
Graph your growth - download Keynote charts today.