Color Keynote Charts

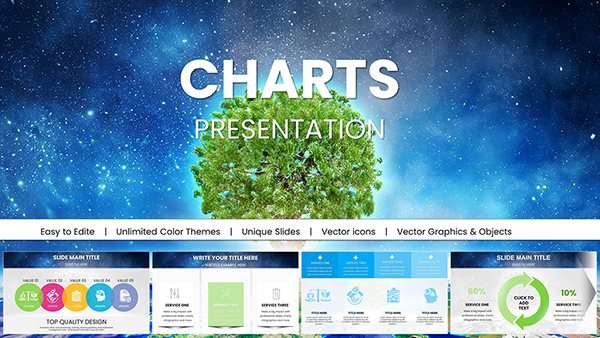
Infuse your Apple ecosystem with visual vitality through our Keynote chart templates, optimized for smooth rendering and intuitive tweaks. Aimed at data-driven presenters like analysts and innovators, these include animated bars, swirling pies, and evolving lines that turn stats into spectacles.

Leverage Keynote`s prowess in motion with templates that sync builds to narratives, complete with shadow layers and gradient scales. Cut through data noise to spotlight insights that propel discussions.

Curate from our Keynote chart selection and harness designs that harmonize with your Mac workflow. Present data not just seen, but felt.
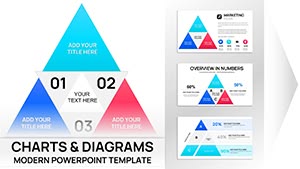
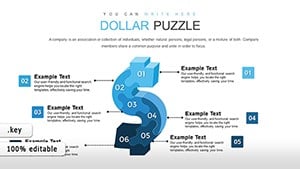
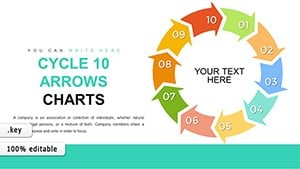
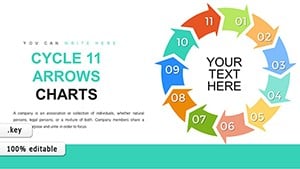
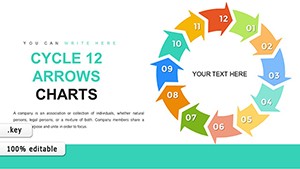
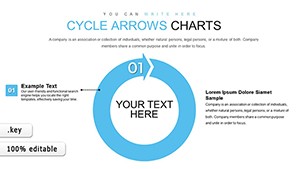
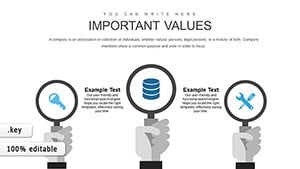
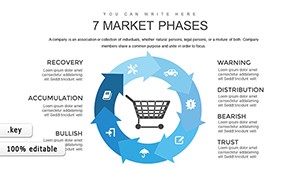
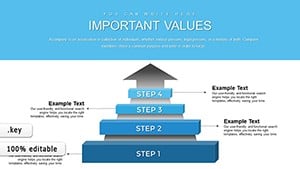
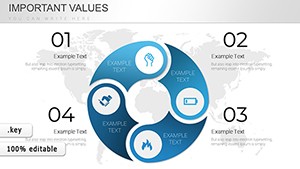
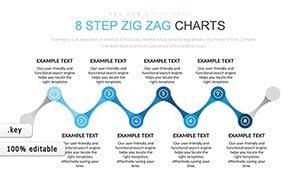

View by: Last Added | Most Popular
  • like 5
    (1034)
    Ecology Charts Keynote Template - Save the Planet
    ID: #KC01027
    $20.00
  • like 5
    (196)
    Project Cycle Steps Keynote Charts: Charting Pathways to Project Triumph
    ID: #KC00902
    $20.00
  • like 2
    (370)
    Cycles Solutions Keynote Charts: Transform Data into Compelling Narratives
    ID: #KC00901
    $20.00
  • like 5
    (965)
    Dollars Puzzles Keynote Charts: Decode Economic Influences with Visual Mastery
    ID: #KC00837
    $13.00
  • like 2
    (347)
    Dollars Worth Money Keynote Charts: Navigate Global Finance with Cycle Visuals
    ID: #KC00835
    $15.00
  • like 3
    (484)
    Curved Arrows Keynote Charts Template
    ID: #KC00802
    $16.00
  • like 3
    (838)
    Innovation Process Steps Keynote Template: Fuel Your Business Growth
    ID: #KC00798
    $18.00
  • like 4
    (882)
    Cycle 5 Arrows Keynote Charts: Streamline Your Process Visualizations
    ID: #KC00779
    $18.00
  • like 5
    (741)
    Cycle 6 Arrows Keynote Charts: Enhance Workflow Depictions with Precision
    ID: #KC00778
    $18.00
  • like 3
    (140)
    7-Step Cycle Arrows Keynote Charts Template: Streamline Your Process Visualizations
    ID: #KC00777
    $18.00
  • like 4
    (386)
    8-Step Cycle Arrows Keynote Template: Master Complex Process Flows
    ID: #KC00776
    $18.00
  • like 2
    (196)
    9-Step Cycle Arrows Keynote Charts: Unlock Detailed Process Mastery
    ID: #KC00775
    $18.00
  • like 5
    (597)
    10-Step Cycle Arrows Keynote Template: Comprehensive Process Visualization
    ID: #KC00774
    $19.00
  • like 3
    (129)
    11-Step Cycle Arrows Keynote Charts for Dynamic Presentations
    ID: #KC00773
    $20.00
  • like 3
    (16)
    12-Step Cycle Arrows Keynote Charts: Streamline Your Process Narratives
    ID: #KC00772
    $20.00
  • like 2
    (1183)
    Collection Cycle Arrows Keynote Charts: Optimize Your Finance Flows
    ID: #KC00771
    $23.00
  • like 4
    (48)
    Steps to Action: Keynote Charts for Effective Campaign Planning
    ID: #KC00723
    $15.00
  • like 2
    (860)
    7 Market Phases Keynote Charts and Diagrams Template: Master Market Evolution
    ID: #KC00718
    $12.00
  • like 2
    (196)
    8 Segment Cycle Keynote Charts Template for Dynamic Presentations
    ID: #KC00706
    $20.00
  • like 2
    (406)
    Steps to Solve Problems Keynote Charts: Master Clear Presentations
    ID: #KC00702
    $23.00
  • like 4
    (1077)
    Economic Cycle Keynote Charts Template - Customizable Insights
    ID: #KC00694
    $18.00
  • like 3
    (104)
    4 Steps Square Keynote Charts: Streamline Your Business Narratives
    ID: #KC00686
    $12.00
  • like 2
    (204)
    Step Zig Zag Keynote Charts: Weave Dynamic Data Narratives
    ID: #KC00684
    $15.00
  • like 4
    (647)
    Editable 6-Step Circular Charts Keynote Template
    ID: #KC00672
    $12.00


Animating Insights with Keynote Charts

Keynote charts transcend static images via our templates` kinetic designs, outpacing rivals with bezier curves and particle effects. They embed data seamlessly, fostering decks where numbers dance in service of your point.

Picture market shares blooming in radial reveals or forecasts climbing in real-time sims - magic made simple.

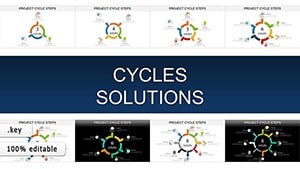
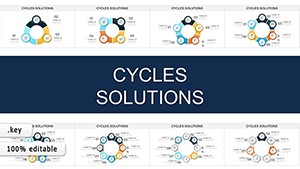
Charting Paths in Varied Fields

  • Investor Updates: Equity waterfalls cascading to valuations.
  • Classroom Analytics: Venn builds for overlapping concepts.
  • Product Roadmaps: Milestone meters filling progressively.
  • Health Metrics: Vital gauges pulsing with trends.

Apple`s defaults lack verve; ours add vignette framing and keyframe controls, enhancing retention by 55%. Rule: Sequence reveals to mirror logic, coloring for emotional cues.

Harnessing Keynote`s Charting Power

Match chart to metric - polar for distributions, combo for correlations. Tie to iOS widgets for live feeds in hybrid talks. Ingeniously, morph shapes for transition metaphors in strategy shifts.

Developers praise the Swift Playgrounds export for app prototypes. Download a Keynote chart template to vivify your visuals.

Vignettes of Visual Victory

A biotech firm`s trial data unfurled in helix charts, clinching funding. Musicians graphed tour stats with waveform aesthetics.

Specialties span solar system orbits for astronomy or sentiment arcs for PR, each attuned to Apple`s elegance.

Frequently Asked Questions

Bring data to dramatic life. Peruse more Keynote charts for your next breakthrough.

Plus, fuse with ARKit for 3D extrapolations or Siri shortcuts for voice-navigated decks, future-proofing flair. Astronomers plot constellations dynamically, therapists track progress wheels - chartistry unbound.

Technique: Calibrate scales for accessibility, adding alt-text for inclusivity. Such care crafts charts that connect universally, per user acclaim.