Keynote Problem Solving Charts - Editable Keynote | ImagineLayout


Type: Keynote Charts template
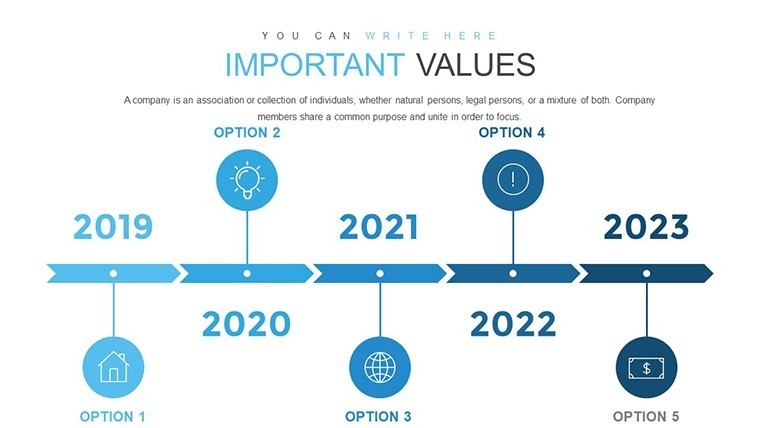
Category: Timelines, Illustrations, Analysis
Sources Available: .key
Product ID: KC00702
Template incl.: 42 editable slides
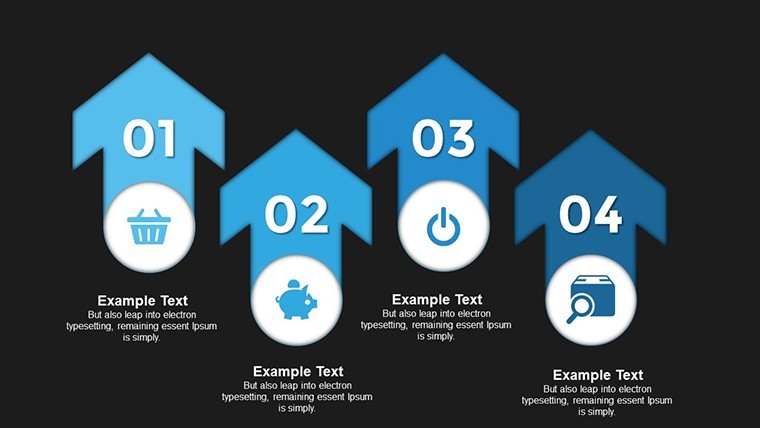
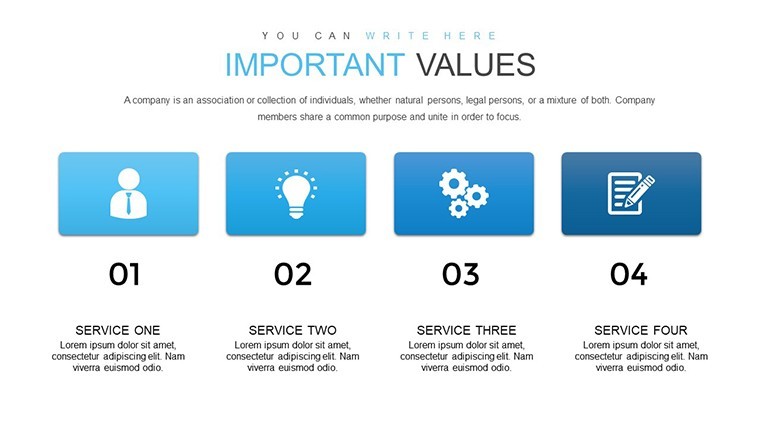
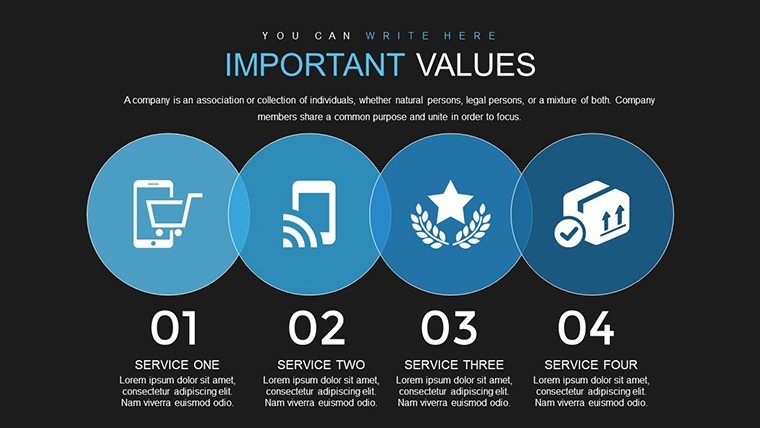
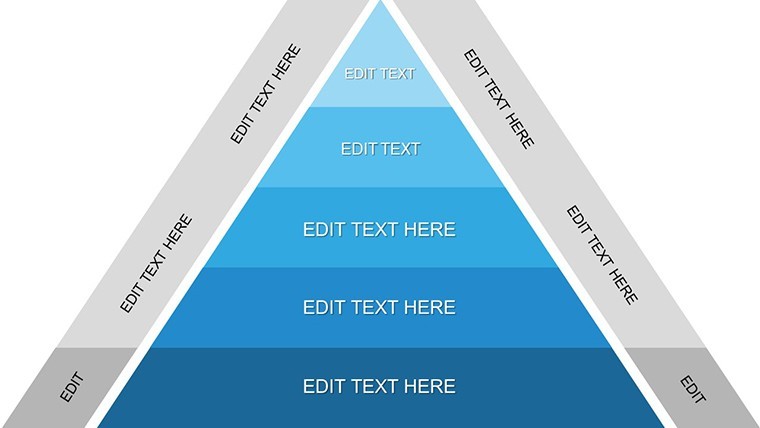
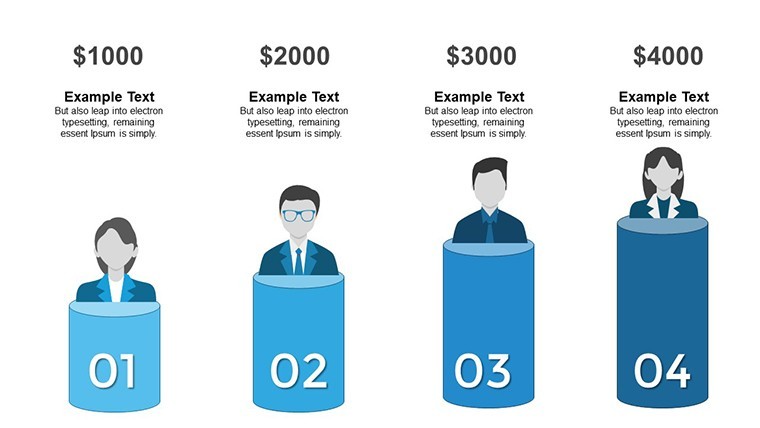
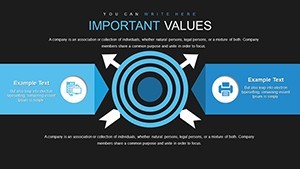
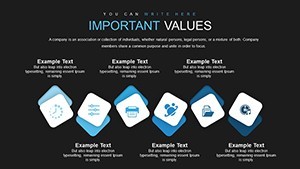
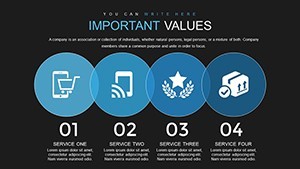
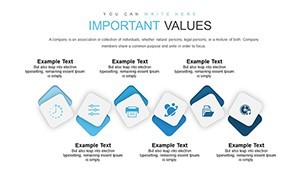
42 problem solving diagrams fill the KEY file and let you break down complex issues for stakeholder briefings instead of building from scratch.
No setup needed.
The paid version includes the full 42 editable slides while the page does not specify free version details yet the file follows standard KEY formats compatible with current Keynote installations.
In practice you duplicate slides and reuse the same structure across multiple reports without redrawing anything.
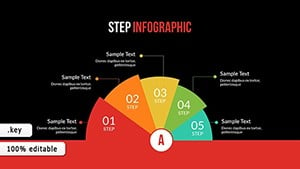
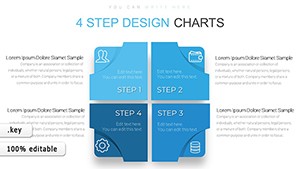
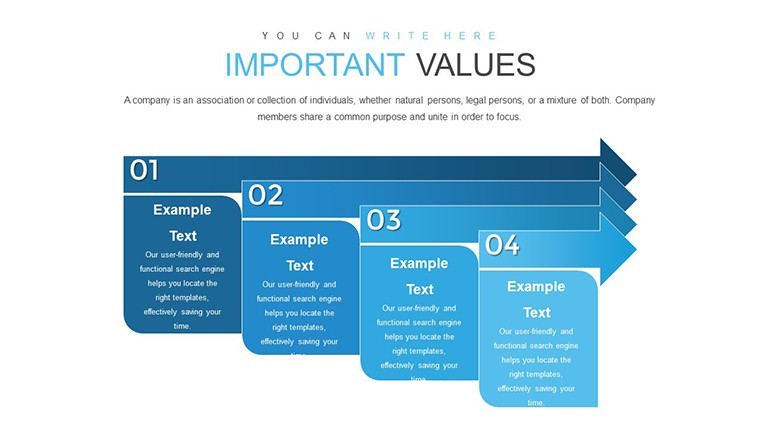
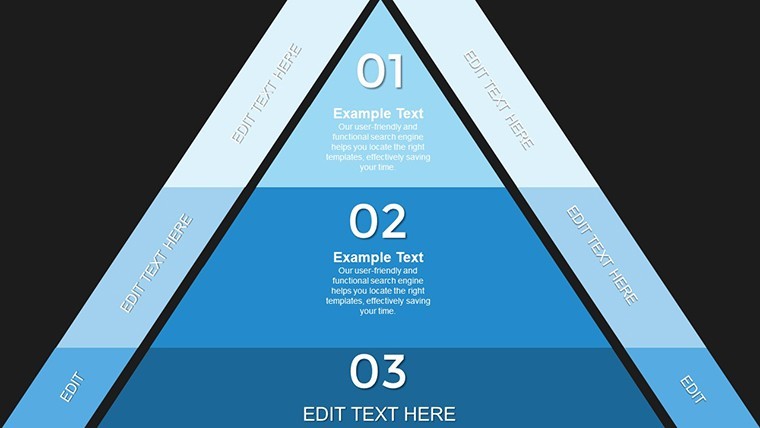
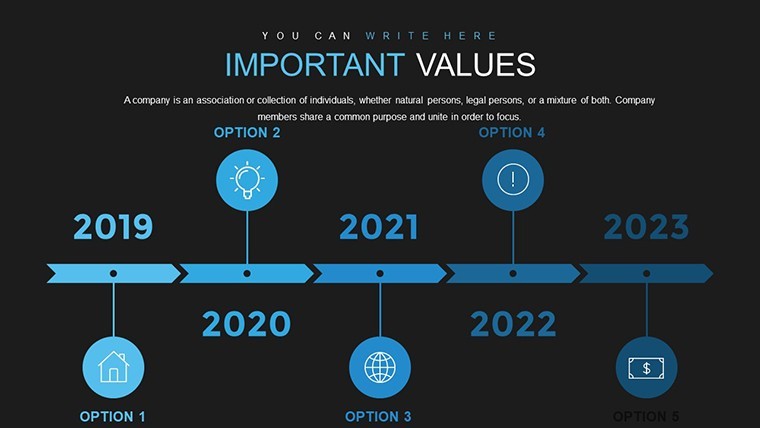
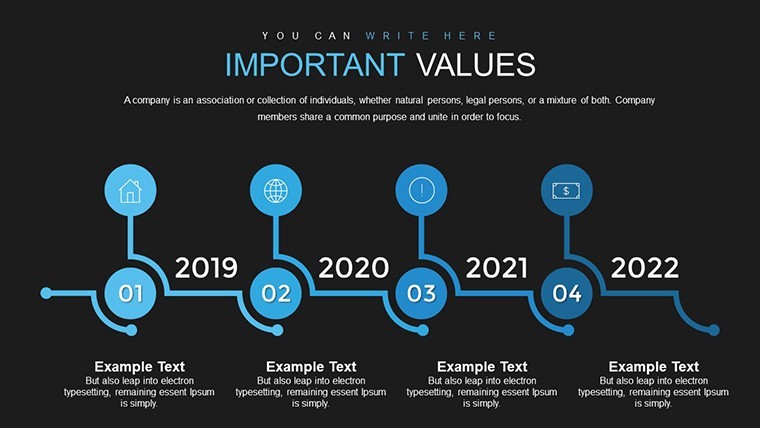
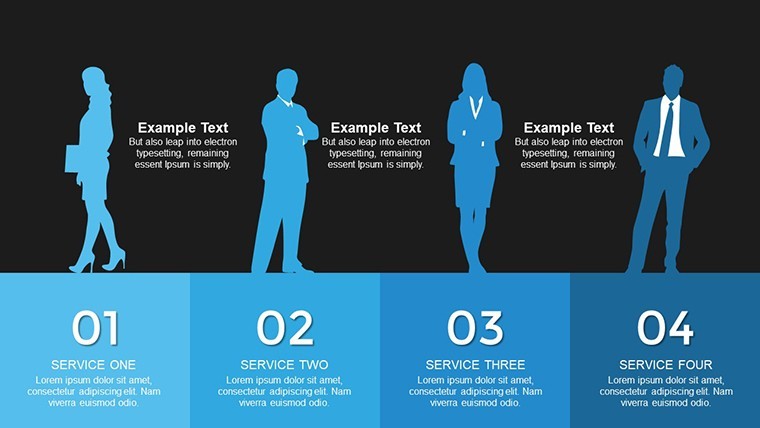
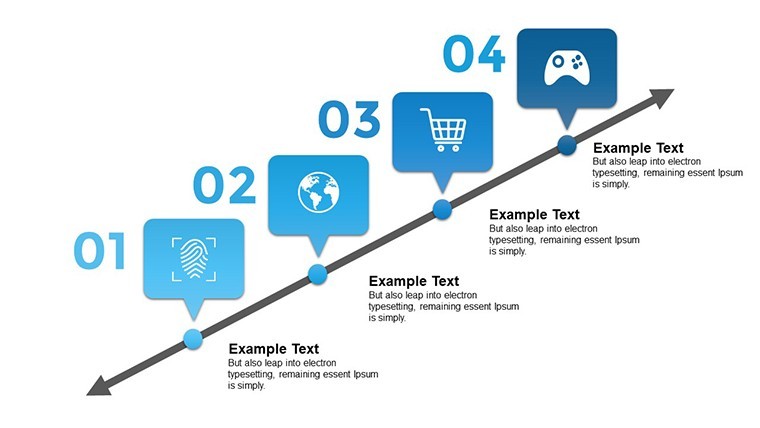
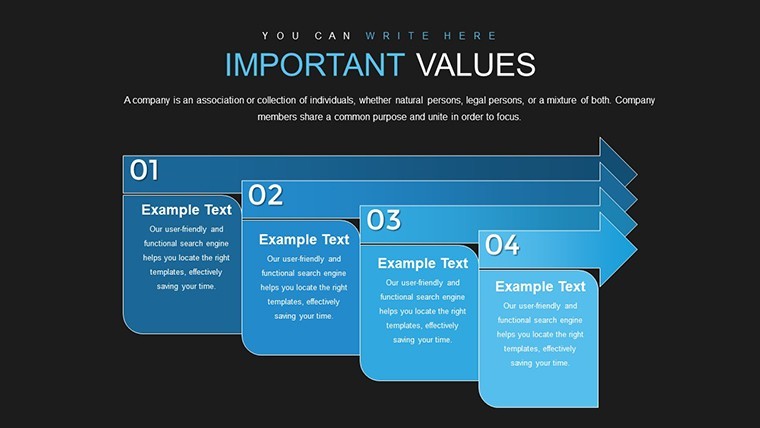
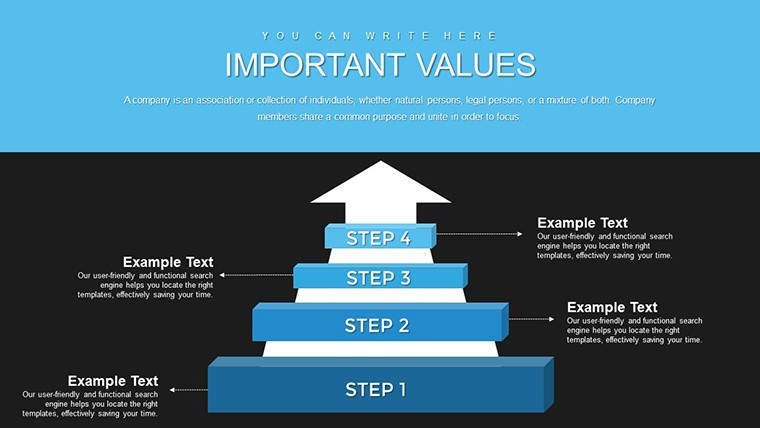
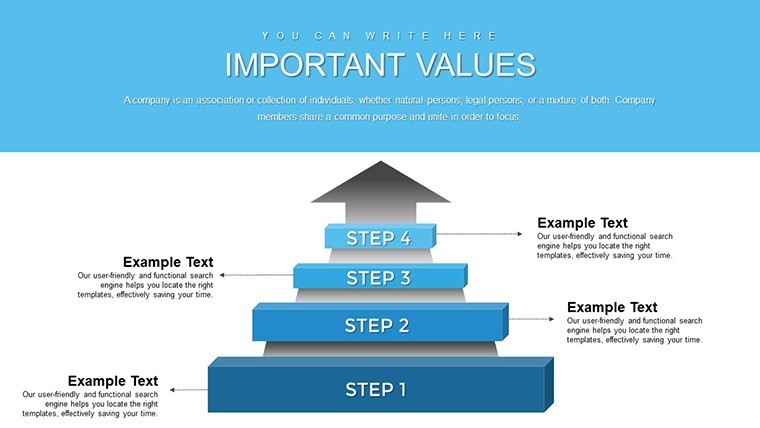
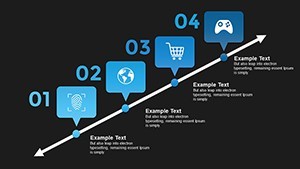
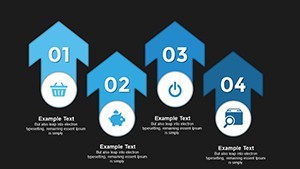
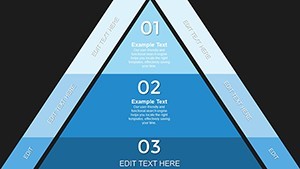
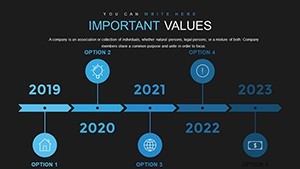
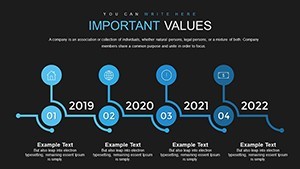
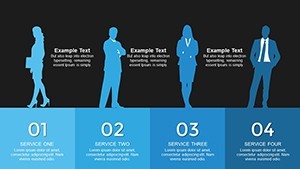
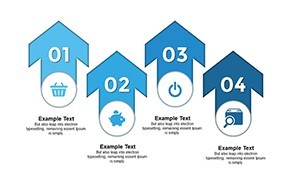
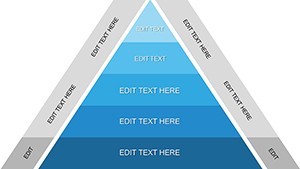
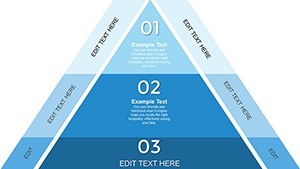
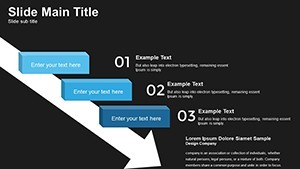
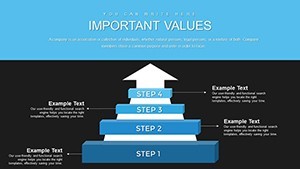
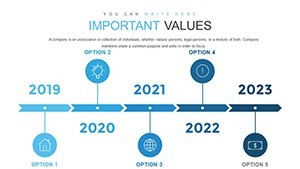
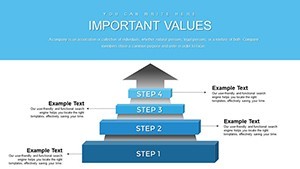
When you need to explain a multi-step process to stakeholders without arranging shapes manually the sequential block structure in this set handles that out of the box.
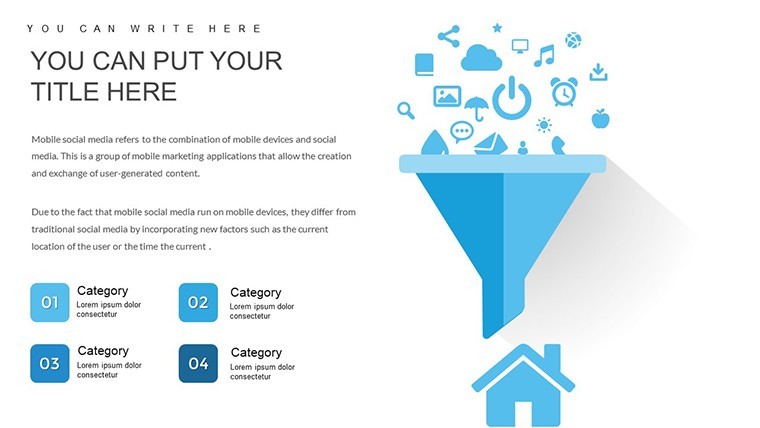
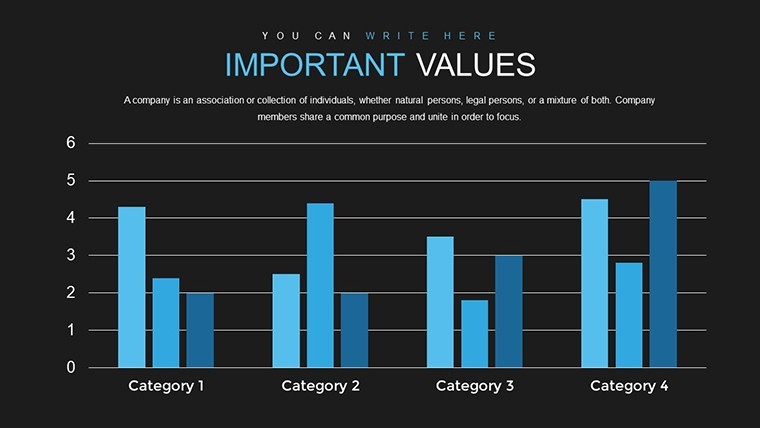
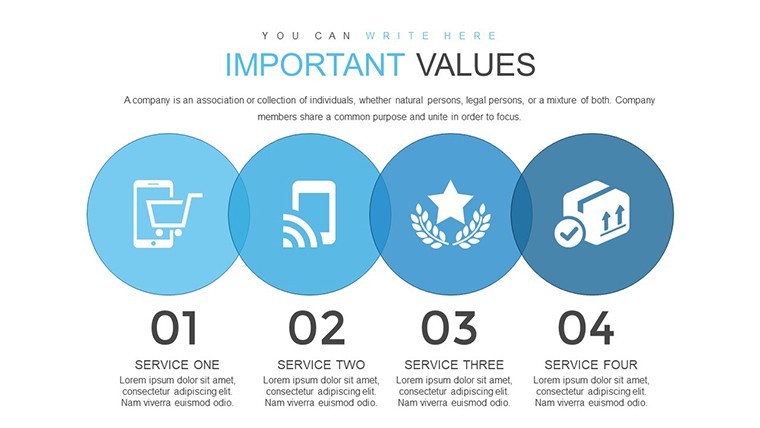
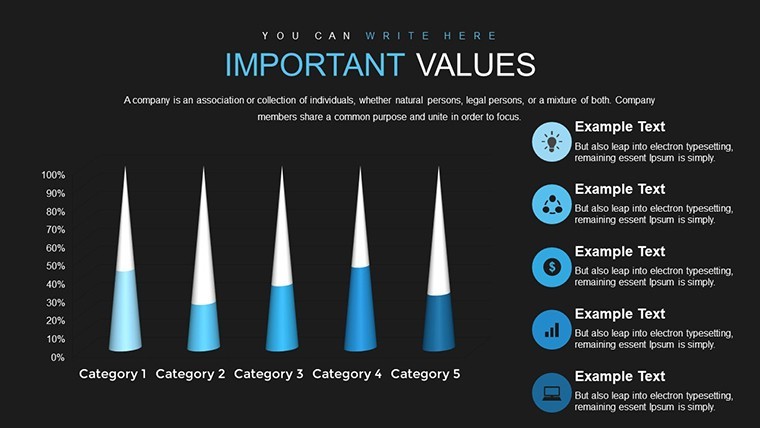
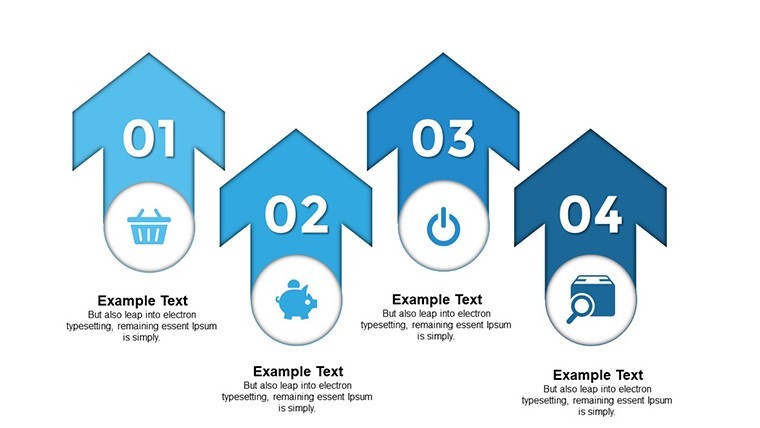
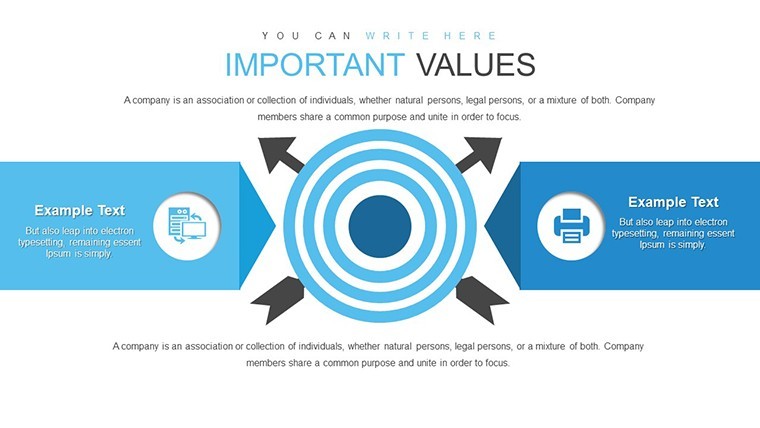
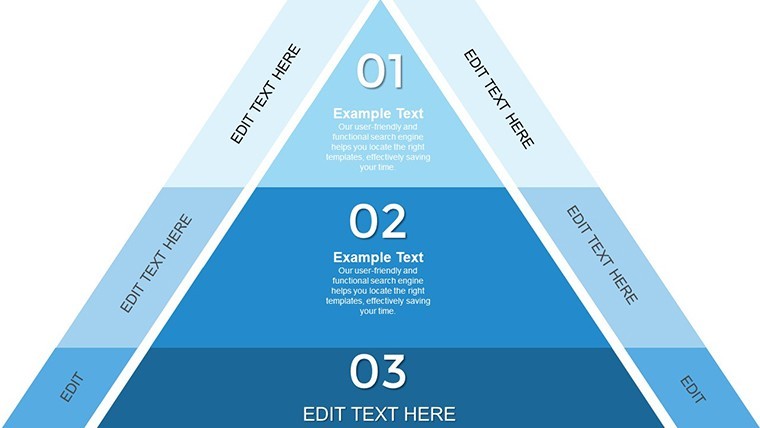
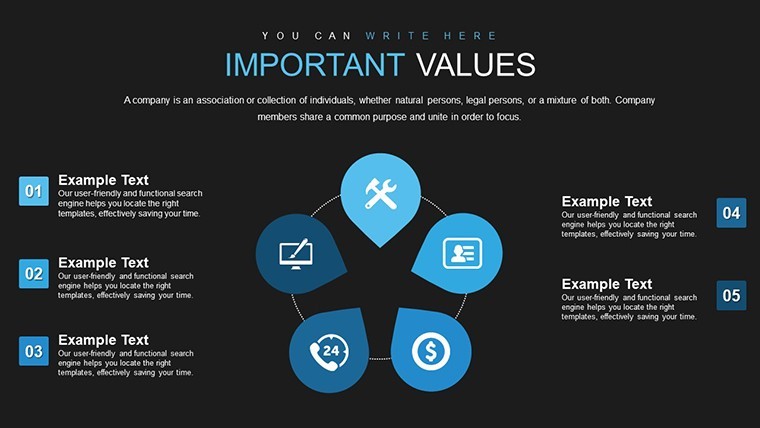
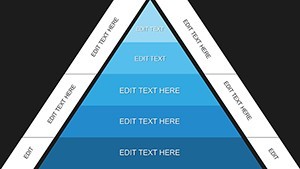
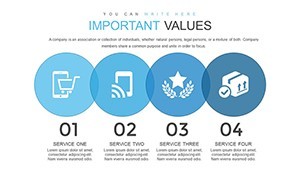
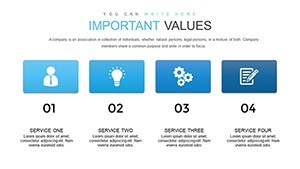
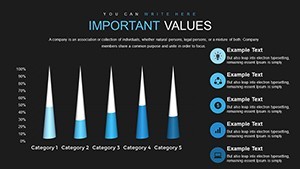
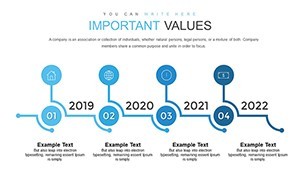
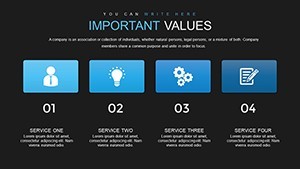
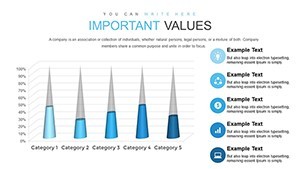
This Keynote diagram template supports process breakdown analysis so the viewer decides the best path by seeing each option mapped side by side and in a product launch meeting it shows the steps from idea to market so the team concludes the critical path immediately.
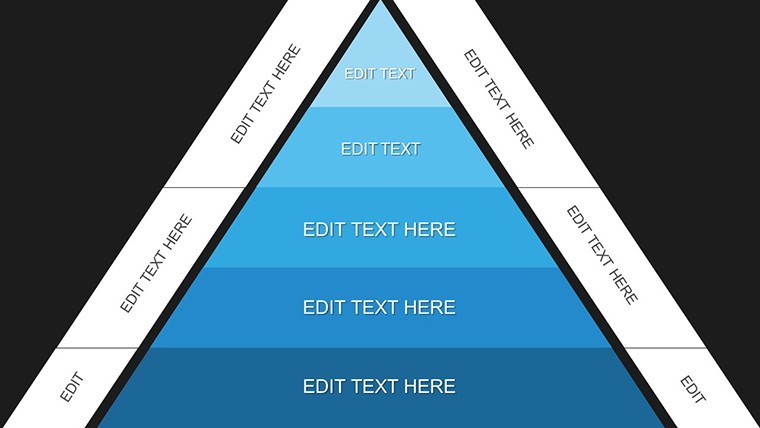
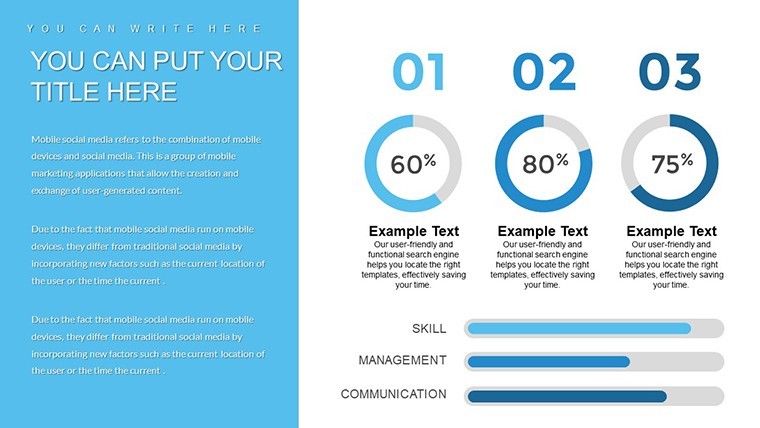
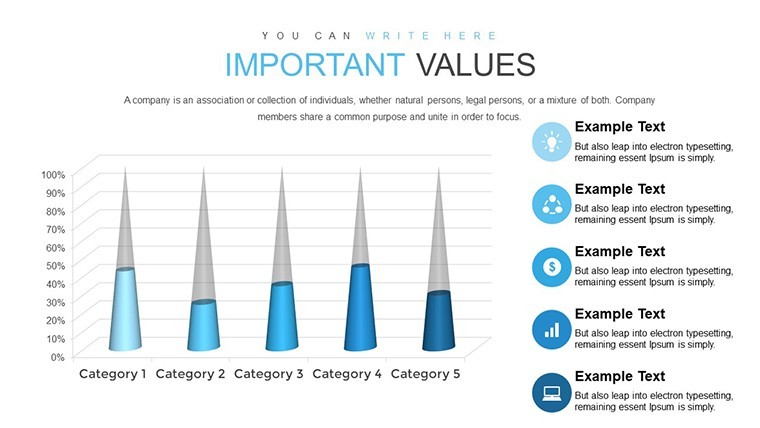
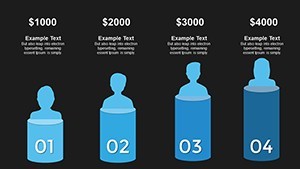
Typically teams use it for project troubleshooting and the result is clearer priority setting that keeps structure readable on one slide.
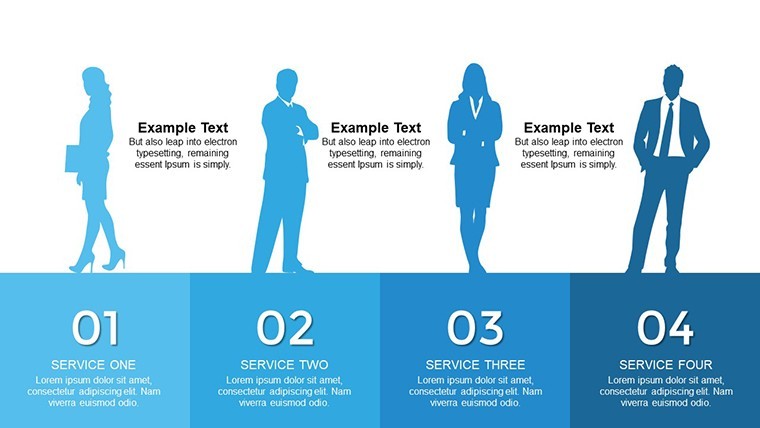
It suits project managers who present clear paths to the team.
Best used when the data fits structured steps and not ideal for creative storytelling slides.
Use this instead of building diagrams manually in Keynote.
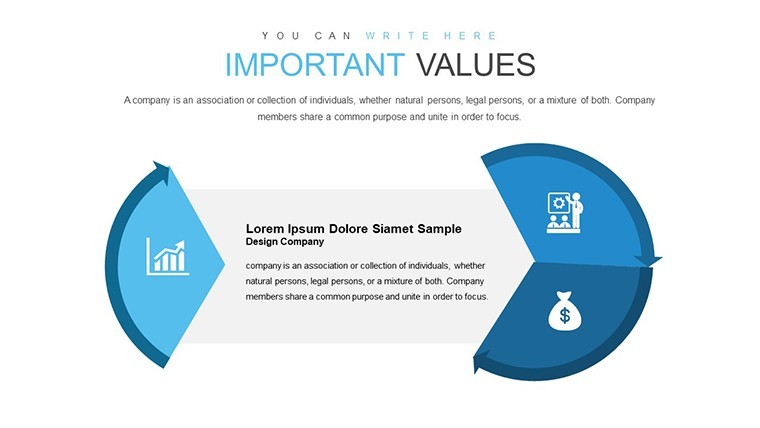
The predefined structure keeps everything aligned so you don’t end up adjusting spacing slide by slide.
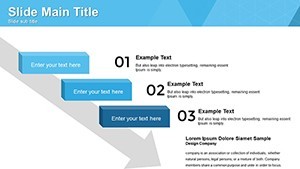
In most cases you only replace text and adjust colors via the slide master.
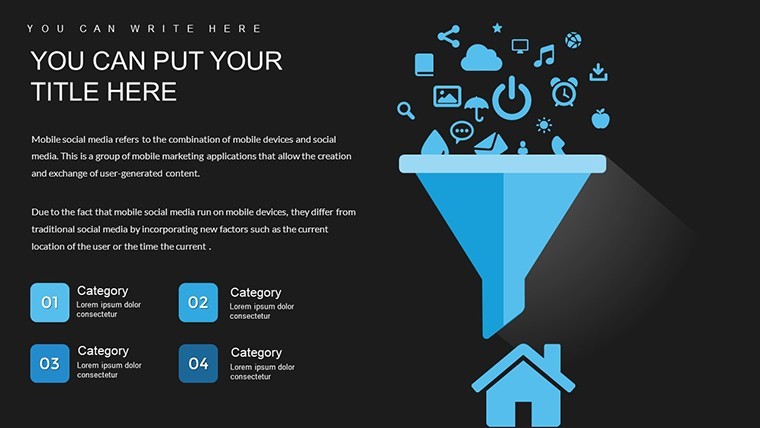
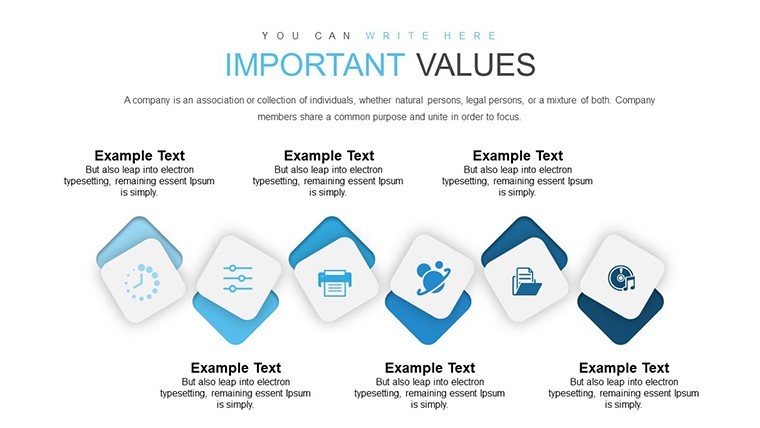
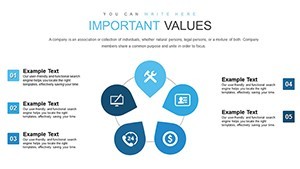
The layouts help organize complex content in strategy planning and reduce the communication problem of unclear priorities.
Everything is already structured.
Template Specifications
| Feature | Details |
|---|---|
| Slides / diagrams | 42 problem solving diagrams |
| File format | KEY |
| Software version | Keynote 12+ (standard KEY format compatible with current installations) |
| Color schemes | Adjustable via slide master (number not specified on page) |
| Editable elements | Vector elements resize and recolor independently |
| Aspect ratio | 16:9 |
| Free vs Paid | Paid includes 42 editable slides free version not specified on page |
| Masters / Backgrounds | Editable masters for quick palette switch |
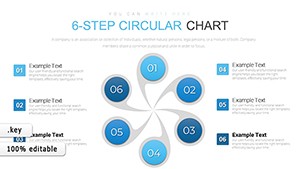
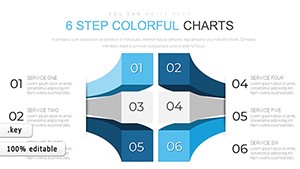
If you need circular options see the 6-Step Circular Charts Keynote.
For more process ideas check the related Steps to Action Keynote Charts.
How do I change colors in this Keynote charts template?
To change colors open the file in Keynote and go to View > Edit Master Slides. Select the master slide and adjust the theme colors there. This updates all slides instantly in most cases and typically teams only do this once per deck.
Does the license allow client work?
The license permits client work under standard terms. You can use the template for paid client projects as long as you do not resell the file itself. One license covers your individual or small team use and for larger agencies multiple licenses are required.
What is the difference between the free and paid version?
The paid version includes the full 42 editable slides in KEY format. Free version details are not specified on the page. In practice the paid gives complete access to every diagram without limitations.
What are the refund conditions?
Refunds are possible if the template does not meet your expectations within the allowed period. Contact support with your order ID for processing. Note that once downloaded some conditions may apply depending on usage.
Can multiple team members use one license?
One license is intended for a single user. For multiple team members you need additional licenses or a team plan. Typically each user requires their own copy for compliance.
Download and start editing immediately