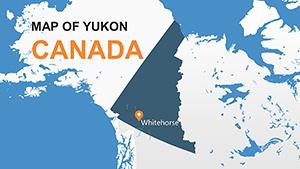
Looking for high quality professional PowerPoint maps designed specifically for Canada and global regions? Our curated collection of editable map slides helps you craft impactful presentations with ease. Whether you need to visualize regional data for business reports highlight geographic trends in education or illustrate market reach in pitch decks our PowerPoint maps provide clear customizable visuals that elevate your message.
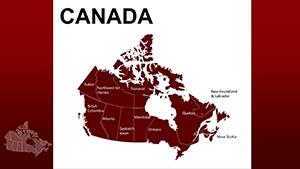
Editable PowerPoint Map Templates save hours of design time because they come ready to use with labeled regions customizable colors and built in infographic elements. Simply insert your data update labels adjust styles and you're presentation ready.

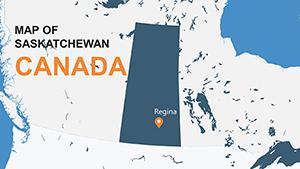
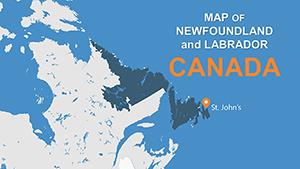
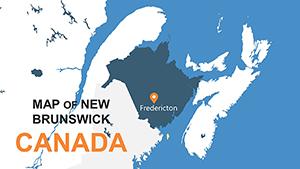
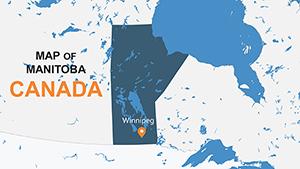
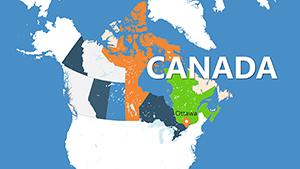
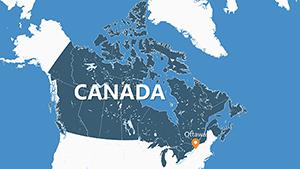
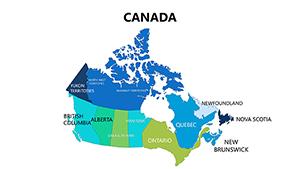

PowerPoint map templates transform plain slides into engaging visual stories. Instead of static default shapes you get purpose built designs that clearly communicate geographic insights. These templates help audiences quickly understand regional differences trends and distributions across Canada North America or the world. They are perfect for corporate reports marketing plans classroom lessons non profit impact summaries international strategy reviews and more.
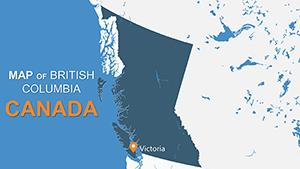
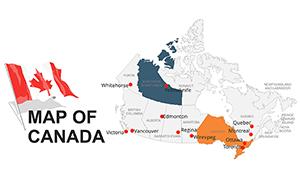
In sales presentations highlight performance by province or territory show customer coverage heat maps and compare growth across regions. Investors and executives appreciate polished visuals that make complex geographic data instantly understandable. Use professionally designed PowerPoint map templates to clearly show sales territories target markets and expansion opportunities.
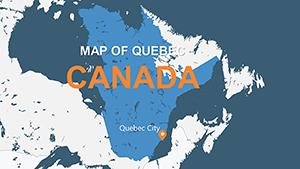
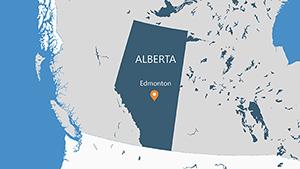
Teachers and students can use PowerPoint maps to bring geography projects to life. Show demographic data compare provincial statistics or illustrate cultural and historical context visually. Researchers presenting at conferences benefit from easy to interpret regional charts that support their findings.
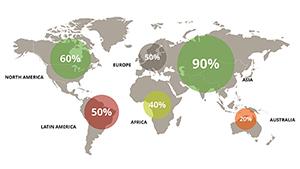
Marketers can map campaign performance in different regions visualize event locations and plan logistics with clear visual aids. Use map slides to show where your audience is located and how different regions respond to promotions. Customize colors to match your brand and make your message cohesive.
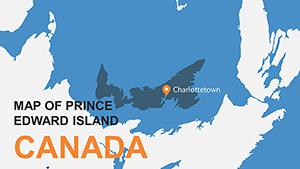
Customizing a map slide is intuitive. After downloading open the slide in PowerPoint select the map elements and update the fill colors to represent different values. Change labels to match your data categories and adjust font styles for readability. Many templates include linked charts that update automatically when you edit values so your visuals stay accurate and dynamic.
Whether you`re presenting to executives clients students or colleagues a well designed map keeps your audience tuned in. Start with a template that fits your message then tweak colors sizes and icons to make the narrative clear and compelling.
Ready to make your next presentation stand out? Browse our collection of editable PowerPoint maps and download designs that fit your project needs now.
Yes all map regions and colors are fully editable. You can change fills outlines and labels to match your presentation style or data requirements.
Most templates are compatible with PowerPoint 2016 and later. Check individual template details for version requirements and ensure your software supports editable vector graphics.
Yes you can use the templates in business reports marketing decks client proposals and other commercial presentations as long as you comply with the licensing terms provided at download.
Copyright © 2009-2026 ImagineLayout All rights reserved.