Business solutions Keynote Charts
Illuminate decision-making with our business solutions Keynote charts, designed for analysts, strategists, and executives. These graphics distill metrics into compelling visuals like funnel analyses and trend lines for solution overviews.
From CRM dashboards to ROI matrices, they empower precise storytelling. Suited for board updates or client demos, our charts enhance comprehension.
For data-savvy leaders, they offer drag-and-drop simplicity. Layer in your datasets for instant relevance. Explore business solutions Keynote charts and decode success patterns now.
Chart your course? Choose one and gain clarity.
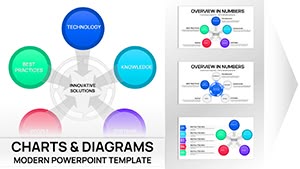
Keynote Innovative Solutions Charts - Editable Keynote | ImagineLayout
ID: #KC01114
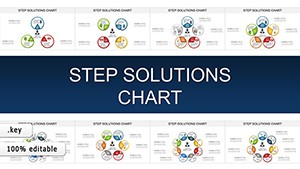
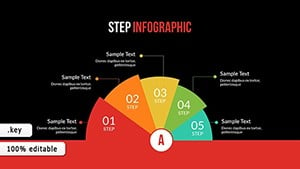
Step Solutions Keynote Charts: Transform Complex Processes into Clear Visual Narratives
ID: #KC00905
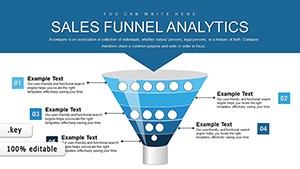
Sales Funnel Analytics Keynote Template: Drive Revenue Growth
ID: #KC00818
3D Steps Processing Keynote Charts Template: Visualize Processes with Depth
ID: #KC00809
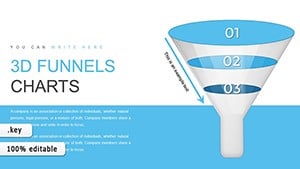
3D Funnel Keynote Chart Template
ID: #KC00803
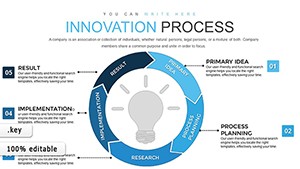
Innovation Process Steps Keynote Template: Fuel Your Business Growth
ID: #KC00798
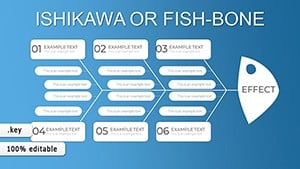
Fishbone Ishikawa Keynote Template - Editable | ImagineLayout
ID: #KC00733
Steps to Action Campaign Keynote Charts - Editable Keynote
ID: #KC00723
Keynote Problem Solving Charts - Editable Keynote | ImagineLayout
ID: #KC00702
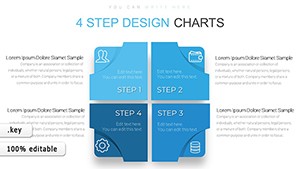
Keynote Square Matrix Charts - Fully Editable | ImagineLayout
ID: #KC00686
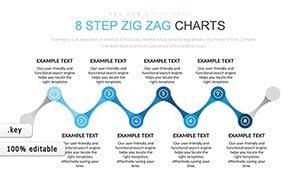
Keynote Zig Zag Process Charts - Fully Editable | ImagineLayout
ID: #KC00684
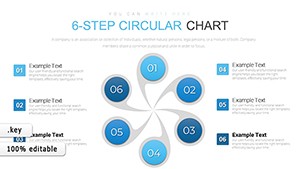
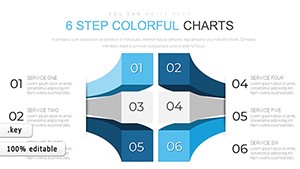
6-Step Circular Charts Keynote - Fully Editable | ImagineLayout
ID: #KC00672
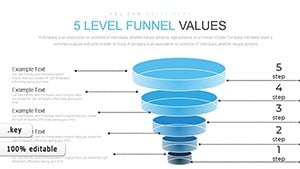
5-Level Sales Funnel Keynote Template - Editable Keynote | ImagineLayout
ID: #KC00661
Decision Making Keynote Charts - Editable Keynote | ImagineLayout
ID: #KC00660
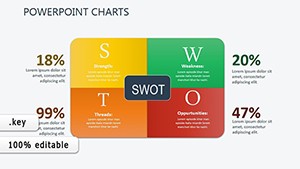
SWOT Keynote Charts - Editable Keynote | ImagineLayout
ID: #KC00653
Infographic Design Keynote Charts: Cycles and Puzzles Unleashed
ID: #KC00513
Management Process Keynote Charts - Editable | ImagineLayout
ID: #KC00503
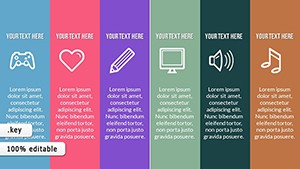
Infographic Creator Keynote Charts: Craft Data Masterpieces
ID: #KC00494
Business Infographic Process Keynote Charts: Streamline Workflows Visually
ID: #KC00480
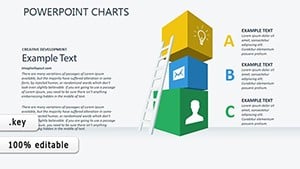
Innovative Business Ideas Keynote Charts Template
ID: #KC00406
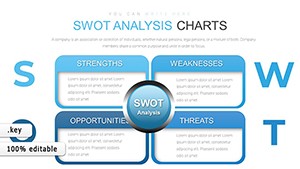
SWOT Analysis Keynote Template: Unlock Strategic Insights with Ease
ID: #KC00390
Tactical Precision: Elevate Your Planning with Keynote Charts
ID: #KC00374
Marketing Charts Keynote Template
ID: #KC00345
Progress Movement 3D Keynote Charts: Advance with Visual Depth
ID: #KC00341
Why Business Solutions Keynote Charts Stand Out Advanced interactivity, like drill-down pies, beats static images. A solution efficacy chart might cascade metrics, revealing bottlenecks. Execs cut analysis time by 50%.
Keynote-tuned, exploit shadows for depth. Hues signal status - greens for wins.
Key Deployment Areas Performance Reviews: KPI radars tracking solution impacts.Client Consults: Custom Sankeys for workflow efficiencies.Internal Audits: Bubble plots for risk assessments.Forecasting: Line extrapolations with confidence bands. Excel over defaults with formula embeds.
Chart Customization Guide Tweak axes, add legends via inspectors. Tip: Animate sequences for phased reveals.
Envision CRM funnels morphing stages. Or portfolio bubbles sizing by revenue.
Impactful Instances A consultancy visualized savings, sealing renewals. Marketers tracked campaigns via heatmaps, optimizing spends.
For ops, throughput Gantts streamlined processes. Scales to any dataset.
Tips for Chart Mastery Select types matching data - bars for compares. Label clearly, avoid clutter. Test legibility from afar.
Pair with narratives for context. Elevates reports profoundly.
Solve with visuals. Download and delineate.
Frequently Asked Questions 950 words to chart triumphs. Select and strategize.