Process PowerPoint Diagrams
This collection covers slide-ready process diagram layouts for Microsoft PowerPoint: sequential workflows, Agile and Scrum sprint cycles, operational production flows, cause-and-effect structures, and branching decision diagrams. The templates are built in editable .pptx format - shapes, connectors, and text fields are all live objects, not flattened images. You edit the content, not the design.
The people who reach for this category most often are project managers building sprint reviews, operations directors preparing quarterly reports, and strategy consultants who need a framework diagram in a client deck by end of day. The common thread: they need a process laid out clearly - stages in order, handoffs visible, decision points marked - and they don't have time to align boxes and route arrows manually in a blank slide.
Select the layout that matches your process type and download the file.
 (908)
(908) Procedure PowerPoint Diagrams Template: Simplify the ComplexID: #PD00192$20.00
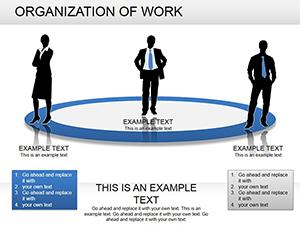 (743)
(743) Organization of Work PowerPoint Diagrams: Download PPTXID: #PD00172$25.00
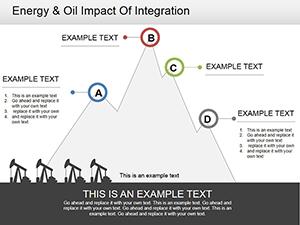 (153)
(153) Oil Industry PowerPoint Diagram Template: Fuel Your Energy PresentationsID: #PD00170$15.00
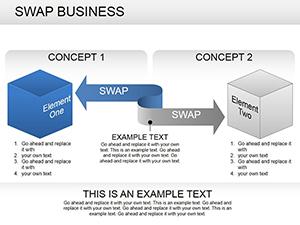 (745)
Swap Business PowerPoint Diagram TemplateID: #PD00164$24.00
(745)
Swap Business PowerPoint Diagram TemplateID: #PD00164$24.00 (827)
Business Solutions PowerPoint Diagrams TemplateID: #PD00163$23.00
(827)
Business Solutions PowerPoint Diagrams TemplateID: #PD00163$23.00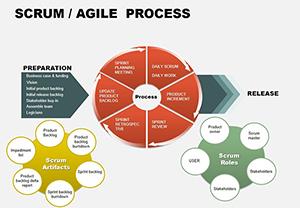 (529)
(529) Agile Scrum PowerPoint Diagrams Template: Accelerate Team SuccessID: #PD00152$20.00
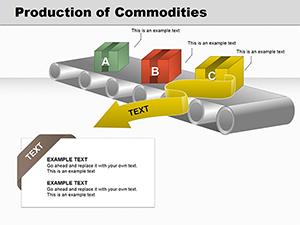 (465)
Transform Production Insights with Commodities PowerPoint DiagramsID: #PD00146$27.00
(465)
Transform Production Insights with Commodities PowerPoint DiagramsID: #PD00146$27.00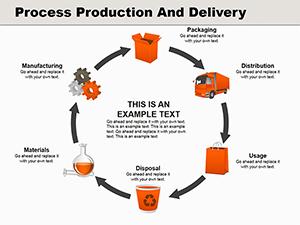 (22)
Process Production and Delivery PowerPoint Diagrams: Transform Your Business NarrativesID: #PD00140$28.00
(22)
Process Production and Delivery PowerPoint Diagrams: Transform Your Business NarrativesID: #PD00140$28.00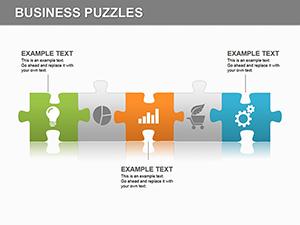 (59)
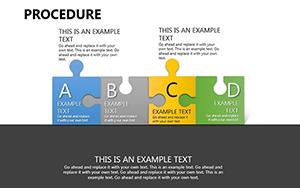
Puzzle Work PowerPoint Diagrams: Piece Together Success in Your PresentationsID: #PD00134$22.00
(59)
Puzzle Work PowerPoint Diagrams: Piece Together Success in Your PresentationsID: #PD00134$22.00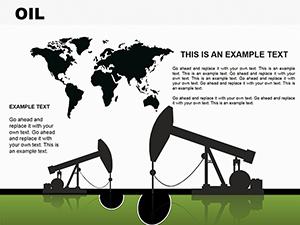 (659)
OIL PowerPoint Diagram TemplateID: #PD00097$19.00
(659)
OIL PowerPoint Diagram TemplateID: #PD00097$19.00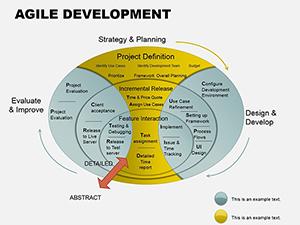 (162)
Agile Development PPT Template: Ignite Iterative ExcellenceID: #PD00081$25.00
(162)
Agile Development PPT Template: Ignite Iterative ExcellenceID: #PD00081$25.00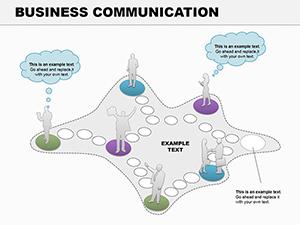 (355)
Business Communication PPT Diagrams: Weave Words into ImpactID: #PD00080$14.00
(355)
Business Communication PPT Diagrams: Weave Words into ImpactID: #PD00080$14.00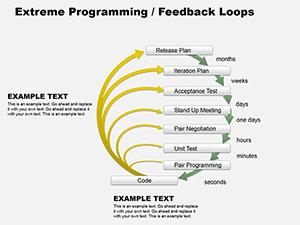 (137)
XP Feedback Loop Diagrams for PowerPointID: #PD00079$6.00
(137)
XP Feedback Loop Diagrams for PowerPointID: #PD00079$6.00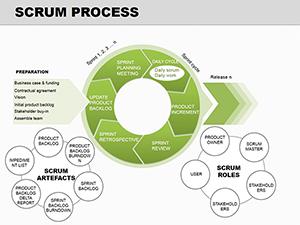 (109)
Agile Scrum Process PowerPoint Diagrams: Visualize Iterative SuccessID: #PD00078$17.00
(109)
Agile Scrum Process PowerPoint Diagrams: Visualize Iterative SuccessID: #PD00078$17.00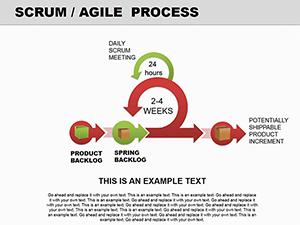 (136)
Agile PowerPoint Diagrams - Editable PPTX | ImagineLayoutID: #PD00077$17.00
(136)
Agile PowerPoint Diagrams - Editable PPTX | ImagineLayoutID: #PD00077$17.00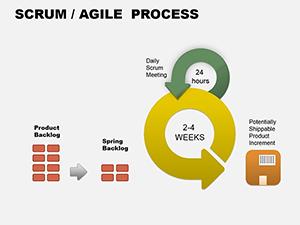 (190)
Scrum Agile PowerPoint Diagrams: Streamline Your Iterative ProcessesID: #PD00076$16.00
(190)
Scrum Agile PowerPoint Diagrams: Streamline Your Iterative ProcessesID: #PD00076$16.00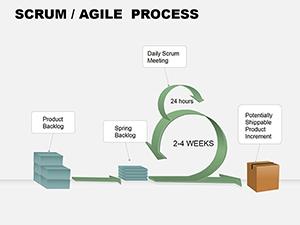 (670)
3D Scrum Agile Process PowerPoint diagramID: #PD00075$18.00
(670)
3D Scrum Agile Process PowerPoint diagramID: #PD00075$18.00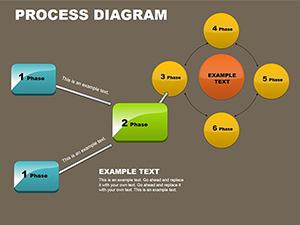 (628)
Process Block Schemes PowerPoint TemplateID: #PD00068$18.00
(628)
Process Block Schemes PowerPoint TemplateID: #PD00068$18.00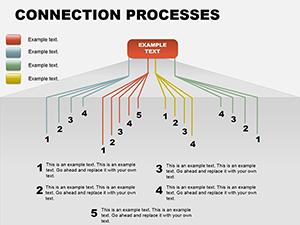 (668)
Connection Processes PowerPoint DiagramsID: #PD00064$15.00
(668)
Connection Processes PowerPoint DiagramsID: #PD00064$15.00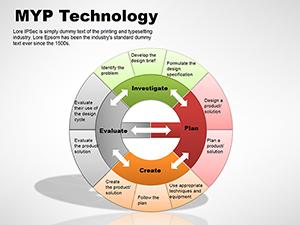 (882)
MYP Technology PowerPoint Diagrams TemplateID: #PD00048$15.00
(882)
MYP Technology PowerPoint Diagrams TemplateID: #PD00048$15.00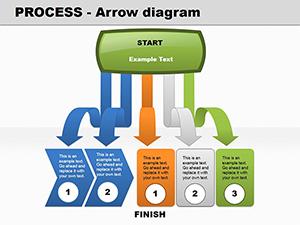 (296)
Process Arrow PowerPoint diagramID: #PD00046$20.00
(296)
Process Arrow PowerPoint diagramID: #PD00046$20.00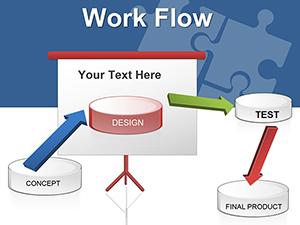 (478)
Workflow PowerPoint Diagram TemplateID: #PD00039$24.00
(478)
Workflow PowerPoint Diagram TemplateID: #PD00039$24.00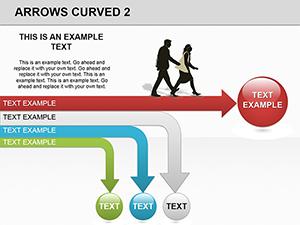 (167)
Curved Arrows PowerPoint Template: Bend Data to Your WillID: #PD00032$16.00
(167)
Curved Arrows PowerPoint Template: Bend Data to Your WillID: #PD00032$16.00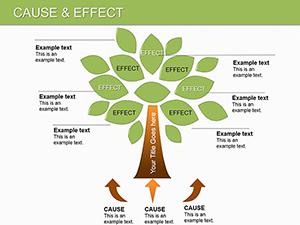 (587)
Cause and Effect PowerPoint Diagrams TemplateID: #PD00030$27.00
(587)
Cause and Effect PowerPoint Diagrams TemplateID: #PD00030$27.00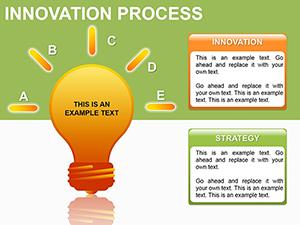 (1086)
Innovation Process PowerPoint Diagrams TemplateID: #PD00028$28.00
(1086)
Innovation Process PowerPoint Diagrams TemplateID: #PD00028$28.00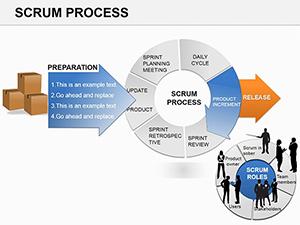 (462)
Scrum Process PowerPoint DiagramsID: #PD00025$18.00
(462)
Scrum Process PowerPoint DiagramsID: #PD00025$18.00 (738)
Progressive Business Process PowerPoint DiagramsID: #PD00024$18.00
(738)
Progressive Business Process PowerPoint DiagramsID: #PD00024$18.00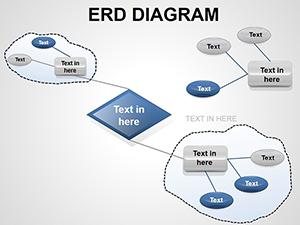 (23)
ERD PowerPoint Diagrams - Fully Editable PPTXID: #PD00018$16.00
(23)
ERD PowerPoint Diagrams - Fully Editable PPTXID: #PD00018$16.00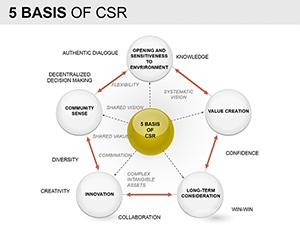 (212)
Basis of CSR PowerPoint Diagrams TemplateID: #PD00012$28.00
(212)
Basis of CSR PowerPoint Diagrams TemplateID: #PD00012$28.00 (693)
Marketing Plan Steps PowerPoint DiagramsID: #PD00009$18.00
(693)
Marketing Plan Steps PowerPoint DiagramsID: #PD00009$18.00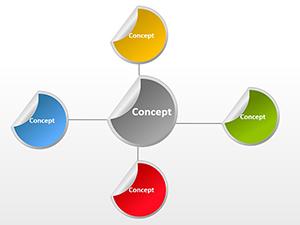 (1029)
Round Sticker PowerPoint Diagrams TemplateID: #PD00008$12.00
(1029)
Round Sticker PowerPoint Diagrams TemplateID: #PD00008$12.00 (988)
People Communication PowerPoint Diagram SetID: #PD00001$20.00
(988)
People Communication PowerPoint Diagram SetID: #PD00001$20.00
Agile and Scrum process diagrams: what the layouts do that a list cannot
Agile project delivery is the most common process type represented in this collection - and for good reason. Scrum is a methodology that many people have heard described but rarely seen visualized at the right level of detail for a stakeholder presentation. A sprint cycle diagram doesn't just show what Scrum does; it shows who is responsible at each stage, where the review gates are, and how the cycle connects back to the product backlog. A bulleted slide covering the same material requires the audience to construct that mental model themselves. The diagram builds it for them.
The Agile and Scrum templates in this category include layouts for sprint planning, the daily standup loop, sprint review and retrospective, and the full cycle from backlog refinement to deployment. They are built with separate swim-lane zones for team roles, which is the structural feature that makes a Scrum diagram genuinely useful in a stakeholder meeting - it makes accountability visible alongside sequencing, which is what executives and product owners actually want to see.
XP (Extreme Programming) and feedback loop diagrams
For development teams using XP or continuous delivery practices, the feedback loop diagram format covers the short iteration cycles that don't fit neatly into a Scrum sprint visualization. These layouts show the build-test-review cycle as a repeating structure, which communicates to a technical or product audience how quality is maintained incrementally. The XP templates here use arrow-and-node layouts that read more naturally to engineering audiences than flow-box formats.
Four workflow scenarios where pre-built diagram layouts change the outcome
A logistics manager at a manufacturing company is presenting a production-to-delivery process map to the COO and procurement lead. The process has seven stages, three handoff points between departments, and two places where delays commonly occur. Building that in PowerPoint from blank shapes takes the better part of a morning: aligning connector arrows, getting text box sizes consistent, making sure the visual weight doesn't skew toward one department. A pre-built process production and delivery diagram template provides that structure in minutes - the manager edits the labels and adds the delay flags, and the diagram communicates the full flow cleanly.
A strategy consultant is delivering a workflow optimization workshop to a client's operations team. She needs to show current-state and future-state processes side by side on a single slide. The client's attention will be on the comparison, not the diagram mechanics. An organization-of-work diagram template with two parallel flow columns gives her the comparison structure without requiring custom layout work. The client sees the before and after immediately.
An IT director is running a software delivery review with business stakeholders who aren't familiar with Agile terminology. He needs a visual that conveys the development cycle - from requirements to testing to release - without drowning the audience in technical labels. An Agile development process diagram, simplified and labeled with business-facing language, gives the stakeholders a map of where their projects sit without requiring an explanation of sprint nomenclature.
A CSR (Corporate Social Responsibility) lead is presenting an ESG initiative workflow to the executive committee. The initiative spans five departments and twelve months. A process diagram that shows phases, owners, and milestones in one view gives the committee a shared reference point. The alternative - a text-heavy slide with bullet points organized by department - requires the audience to do the integration work themselves. The diagram does it once, correctly, and stays on screen as a navigational anchor throughout the discussion.
Linear versus cyclical layouts: choosing the right process structure
The most consequential choice when selecting a process diagram is whether your process is fundamentally linear or cyclical. A linear layout signals a process that moves from a defined start to a defined end - onboarding, project delivery, production runs. A cyclical layout signals a recurring process without a terminal point - quality review loops, Scrum sprints, continuous improvement programs.
Using the wrong structure sends the wrong message before a word is spoken. A linear diagram applied to a continuous improvement program implies the process has an end state, which undermines the narrative. A cyclical layout applied to a one-time project creates the impression of ongoing obligation. Select the template type based on process logic, not visual preference.
For branching processes - where a decision point sends different cases down different paths - look for the decision-diamond layouts in the flow and cause-and-effect subsets of this collection. These aren't a separate product category, but several templates here include branch structures that handle if/then logic inside a process flow. The Cause and Effect template is particularly useful for root-cause analysis presentations where multiple contributing factors feed into a central problem.
Technical tip: keeping connectors attached when you add or remove steps
The most common problem when editing a process diagram in PowerPoint is connector arrows that detach when you move a shape. The root cause is nearly always the same: shapes were moved after the connectors were drawn, which breaks the attachment point. The fix is to group each process step (its box and its outgoing connector) before repositioning. Then use PowerPoint's Align and Distribute tools - found under the Drawing Tools > Format tab > Align - to redistribute the grouped elements evenly across the slide.
When adding a new step to an existing chain, insert a new shape, draw new connectors to and from it, then reselect everything and redistribute. Trying to stretch an existing connector to bridge a new gap almost always produces a misaligned result. Draw fresh connectors each time. The templates in this collection use standard PowerPoint connector types (not custom paths), which means they respond correctly to PowerPoint's built-in alignment tools without manual coordinate adjustment.
How this collection compares to building process diagrams from scratch
Default PowerPoint shapes produce generic output. Every arrow is the same weight, every box is the same size, and nothing distinguishes a primary process step from a review gate from a decision point. Differentiation has to be applied manually - different colors, different border weights, different font sizes - and doing that consistently across a 10-step process diagram takes longer than most people expect.
The templates here arrive with that differentiation already applied. Primary steps are visually distinct from handoff points. Decision nodes are shaped differently from process boxes. Annotation zones are positioned so they don't collide with the connector arrows. These are small choices individually, but collectively they determine whether the diagram reads clearly at a glance or requires a walkthrough.
Adjacent categories on ImagineLayout worth exploring
If your process presentation includes elements that repeat or loop, the Cycle PowerPoint diagram templates are built specifically for recurring-process visualization and include formats that the linear process layouts here don't cover. For process diagrams where directional flow is the primary visual logic - where the arrows carry more information than the boxes - the Flow PowerPoint diagram templates provide arrow-led layouts that emphasize movement and sequence. And if you need the full PowerPoint diagram library without subcategory filters, the PowerPoint diagrams main collection covers every structure type in one browsable view.
Download the process diagram template that fits your workflow and edit it directly in PowerPoint.
Frequently Asked Questions
Can I add or remove steps from a process diagram template without breaking the layout?
Yes, but the approach matters. To add a step, insert a new shape (duplicate an existing step shape to match the styling), position it in the sequence, then draw new connectors to and from it rather than stretching an existing connector. Use PowerPoint's Align and Distribute tools under Drawing Tools > Format > Align to re-space all elements evenly after the insertion. To remove a step, delete the shape and its connectors, then reconnect the adjacent steps with a fresh connector. Avoid dragging connectors from one attachment point to another - this often leaves invisible anchor artifacts that cause later repositioning issues.
Do the Agile and Scrum diagram templates work for non-software teams?
Yes. Agile process diagrams are frequently used by marketing, HR, and operations teams that have adopted iterative working practices - not just software development teams. The terminology in the templates (backlog, sprint, retrospective) can be relabeled directly in the editable text fields to match the language your team uses. The structural logic of the diagram - short iteration cycles with review gates - applies equally to content production, recruitment campaigns, and operational process improvement. Relabeling a Scrum sprint diagram to match a marketing campaign cycle takes a few minutes and produces a professionally structured slide.
Are these templates compatible with PowerPoint on both Windows and Mac?
Yes. All templates are built in standard .pptx format and open correctly in PowerPoint 2016, 2019, 2021, and Microsoft 365 on both Windows and macOS. The shapes use native PowerPoint vector geometry, so they render and scale identically on both platforms. One area to check on Mac is font substitution: if the template uses a font that's part of the Windows Microsoft 365 font library but not pre-installed on macOS, Keynote may substitute a different font. Open the file and scan headings and labels to confirm font rendering before your presentation.
What is the license for these templates - can I use them in consulting deliverables for clients?
Yes. The standard ImagineLayout license covers commercial use, which explicitly includes client-facing consulting deliverables, strategy documents, and project reports. You can edit, adapt, and present these templates in any professional context. The restriction is on redistribution of the original, unmodified template files - you cannot include them in a template library you sell or give to others. Many consultants at strategy and operations firms use these templates as part of their standard slide toolkit; the license supports that use fully.
Can I export these process diagrams as PDF without losing diagram quality?
Yes. All shapes and connectors in these templates are native PowerPoint vector objects, which means PDF export (via File > Export to PDF or Save As PDF) renders them at full resolution without any quality loss - regardless of the output page size. The diagrams will appear as crisply on a printed A4 page as on screen. The one thing to check before exporting is that no connector arrows have been accidentally set to a very thin stroke weight, which can make them appear faint on printed output. Select all connector shapes and confirm the line weight is at least 1.5pt for print legibility.