Venn PowerPoint Diagrams
These templates provide structured Venn diagrams ready for PowerPoint and Google Slides. A consultant mapping stakeholder interests or an educator explaining set theory can insert labels and adjust overlaps without redrawing circles each time.
The layouts already solve alignment, text wrapping inside intersections, and consistent stroke weights so the focus stays on the insight rather than the geometry.
Open the collection and select the diagram style that matches the number of sets you need to compare.
 (128)
(128) Interactive Venn PowerPoint Diagram TemplateID: #PD00200$19.00
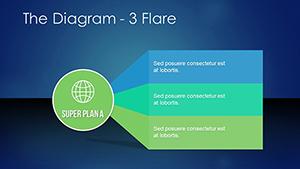 (1138)
 Venn Diagram Maker Template for PowerPointID: #PD00218$18.00
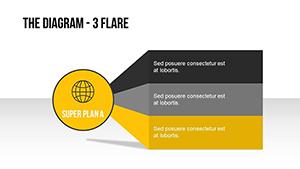 (258)
Flare Venn Diagram PowerPoint Template: Pro EditionID: #PD00217$18.00
(258)
Flare Venn Diagram PowerPoint Template: Pro EditionID: #PD00217$18.00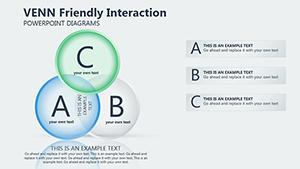 (300)
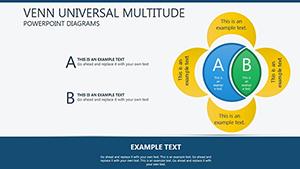
Venn Meaning PowerPoint Diagram templateID: #PD00199$19.00
(300)
Venn Meaning PowerPoint Diagram templateID: #PD00199$19.00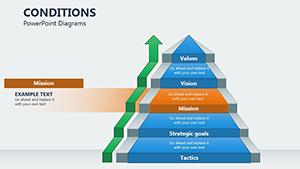 (858)
Conditions PowerPoint Diagrams: Mastering Event-Driven VisualsID: #PD00198$22.00
(858)
Conditions PowerPoint Diagrams: Mastering Event-Driven VisualsID: #PD00198$22.00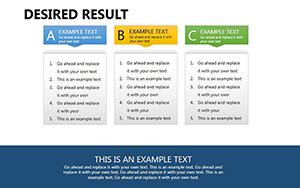 (478)
Desired Result PowerPoint DiagramsID: #PD00189$22.00
(478)
Desired Result PowerPoint DiagramsID: #PD00189$22.00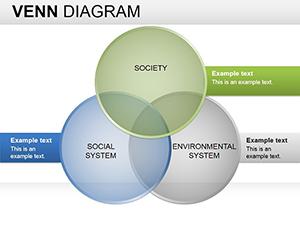 (721)
Website Mockup Keynote Diagrams: Elevate Your UI Design WorkflowID: #PD00171$25.99
(721)
Website Mockup Keynote Diagrams: Elevate Your UI Design WorkflowID: #PD00171$25.99 (1097)
 Superimposed Sheets PowerPoint Diagrams TemplateID: #PD00128$20.00
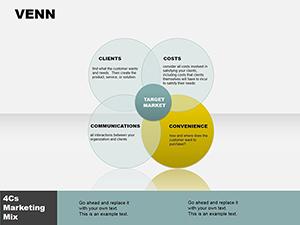 (735)
Business Venn Diagrams PowerPoint Template: Reveal Hidden ConnectionsID: #PD00085$12.00
(735)
Business Venn Diagrams PowerPoint Template: Reveal Hidden ConnectionsID: #PD00085$12.00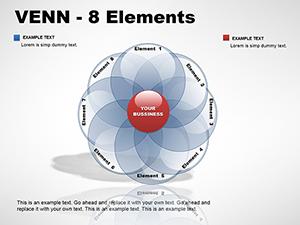 (54)
8-Element Venn PowerPoint DiagramsID: #PD00045$24.00
(54)
8-Element Venn PowerPoint DiagramsID: #PD00045$24.00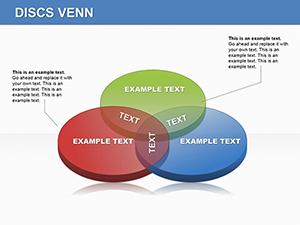 (82)
Discs Venn PowerPoint Diagrams - Editable PPTX | ImagineLayoutID: #PD00044$22.00
(82)
Discs Venn PowerPoint Diagrams - Editable PPTX | ImagineLayoutID: #PD00044$22.00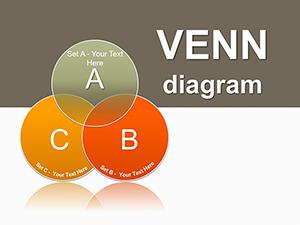 (691)
Probability Venn PowerPoint Diagrams: Master Set Visuals with EaseID: #PD00042$28.00
(691)
Probability Venn PowerPoint Diagrams: Master Set Visuals with EaseID: #PD00042$28.00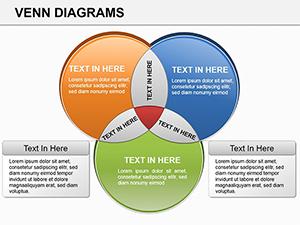 (361)
Venn PowerPoint Diagrams: Compare Ideas EffortlesslyID: #PD00019$24.00
(361)
Venn PowerPoint Diagrams: Compare Ideas EffortlesslyID: #PD00019$24.00
When a Single Venn Diagram Slide Replaces an Entire Section of Bullets
Three overlapping circles can show shared responsibilities across departments in one glance. These templates give you the exact proportions already balanced so the audience grasps the concept before you finish speaking.
Do the Templates Support Concentric or Nested Circle Designs?
Yes. Dedicated layouts for nested and concentric versions keep the inner circles perfectly centered when you resize or recolor any layer.
How to Animate Overlaps Step by Step Without Losing Clarity
Use the built-in entrance animations on individual circle groups. The sequence reveals each intersection in order, guiding the audience through the logic without overwhelming the slide.
Four Situations Where These Diagrams Change the Conversation
A brand strategist used the Interactive Venn PowerPoint Diagram Template to show how audience segments overlapped for a multi-channel campaign. The client immediately understood targeting priorities and approved budget allocation on the spot.
An academic lecturer replaced a static slide with the Flare Venn Diagram PowerPoint Template. Students followed the animated build and asked deeper questions about the unique areas instead of the visual itself.
A product owner mapped feature requests against current capabilities. The Conditions PowerPoint Diagrams layout highlighted the sweet spot of high-impact, low-effort items that guided the next sprint planning.
A sales enablement lead created comparison diagrams for two competing solutions. The Desired Result PowerPoint Diagrams version let reps quickly show differentiation during client calls without flipping between multiple slides.
The Real Time Sink of Manual Venn Construction
You adjust circle radii for perfect overlap, then realign every text box when the data changes. These repeated micro-edits accumulate and reduce the time left for refining the actual argument.
Practical Advice for Long-Running Presentation Libraries
Duplicate the entire Venn slide and save it as a custom layout. Future decks pull the updated version from the master in one click, keeping every diagram version-controlled.
Technical Tip for PowerPoint and Google Slides Users
In PowerPoint, convert the grouped shapes to a SmartArt graphic after finalizing content. This unlocks automatic layout adjustments if you later add or remove circles while preserving the original color theme.
Why These Diagrams Focus on Clarity Over Decoration
They contain only the circles, text frames, and minimal connectors needed to show relationships-nothing extra that competes with your message.
For seasonal print needs see our holiday postcard templates. Teams using Keynote decks may prefer internet ecommerce Keynote templates. Chart-focused users often move to PowerPoint chart templates.
Choose the diagram that matches your comparison and begin customizing.
Venn Diagram PowerPoint Templates FAQ
Do these templates work in both PowerPoint and Google Slides?
Yes. The .pptx files import directly into Google Slides with all editable shapes and colors intact. Animation settings may need minor re-application but the core diagram structure remains fully functional.
Can I use more than five circles in these layouts?
The base templates support up to five circles with pre-grouped shapes. For six or more you can duplicate and manually align using the built-in guides, or contact support for a custom extension.
How do I keep the diagram consistent when updating data quarterly?
Save the finished slide as a custom layout in the slide master. Next quarter duplicate the layout and only edit the text or linked chart data-alignment and colors stay locked.
Are animations preserved when exporting to PDF?
PDF export captures the static final state with all fonts embedded. For animated delivery use the native PowerPoint or Google Slides file so the step-by-step reveal remains interactive during the presentation.