Matrix PowerPoint Diagrams
Matrix diagrams are one of the most effective ways to explain complex relationships in a single clear slide. On this page you will find a focused collection of Matrix PowerPoint diagram templates designed to help you organize ideas compare options and present decisions with confidence.
Each template is built for real presentation needs. Whether you are preparing a strategy deck a management report or a classroom lecture these matrix slides help your audience understand priorities trade offs and connections at a glance. With clean layouts balanced grids and modern typography your message stays clear and professional.
All designs are fully editable in PowerPoint so you can easily change colors labels icons and data to match your brand or topic. From simple two by two frameworks to advanced multi level matrices these templates save time and elevate the visual quality of your slides without extra effort.
 (671)
(671) Green Progress PowerPoint Diagrams TemplateID: #PD00214$15.00
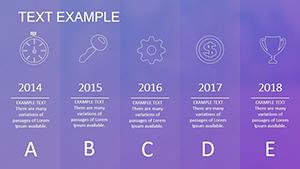 (770)
Collective PowerPoint Diagrams for GrowthID: #PD00212$16.00
(770)
Collective PowerPoint Diagrams for GrowthID: #PD00212$16.00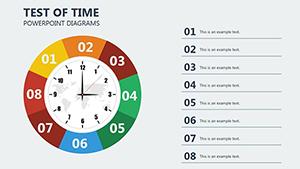 (1040)
 Test of Time PowerPoint Diagrams: Infographics That EndureID: #PD00203$18.00
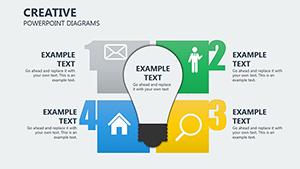 (29)
Creative PowerPoint Diagrams: Puzzles of PossibilityID: #PD00202$22.00
(29)
Creative PowerPoint Diagrams: Puzzles of PossibilityID: #PD00202$22.00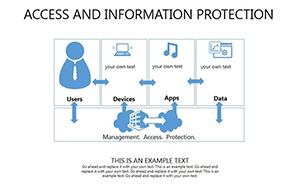 (65)
(65) Access And Information Protection PowerPoint DiagramsID: #PD00187$25.00
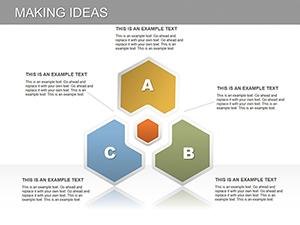 (161)
Presentation Making Ideas PowerPoint Diagram TemplateID: #PD00132$26.00
(161)
Presentation Making Ideas PowerPoint Diagram TemplateID: #PD00132$26.00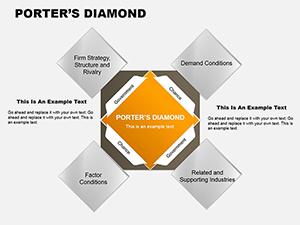 (376)
Porter's Diamond Square PowerPoint Diagrams: Forge Competitive EdgesID: #PD00092$18.00
(376)
Porter's Diamond Square PowerPoint Diagrams: Forge Competitive EdgesID: #PD00092$18.00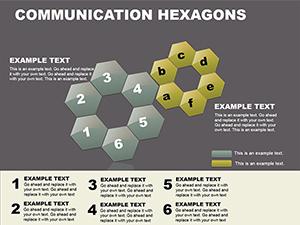 (295)
Hexagon PowerPoint Diagrams - Editable PPTX | ImagineLayoutID: #PD00070$18.00
(295)
Hexagon PowerPoint Diagrams - Editable PPTX | ImagineLayoutID: #PD00070$18.00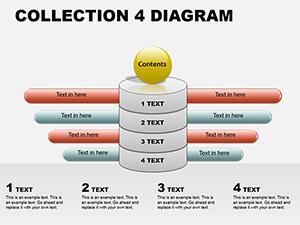 (156)
(156) PowerPoint Diagram Collection 4: Sculpting Ideas in 3DID: #PD00062$18.00
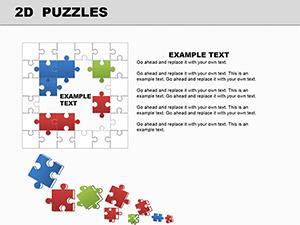 (291)
2D Puzzles PowerPoint Template: Unlock Creative ConnectionsID: #PD00054$24.00
(291)
2D Puzzles PowerPoint Template: Unlock Creative ConnectionsID: #PD00054$24.00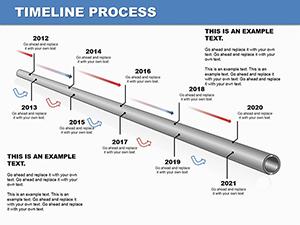 (658)
Timeline Process Diagrams - Editable PPTX | ImagineLayoutID: #PD00052$24.00
(658)
Timeline Process Diagrams - Editable PPTX | ImagineLayoutID: #PD00052$24.00
What Are Matrix Diagrams Used For
Matrix diagrams are widely used when you need to compare several variables across two dimensions. They help structure thinking and guide discussion without overwhelming the audience. Instead of long explanations you can show relationships visually and keep everyone aligned.
Common Business Scenarios
- SWOT style analysis for products teams or markets
- Risk versus impact assessment for project planning
- Priority matrices for decision making workshops
- Performance reviews comparing goals and results
Education and Training Use Cases
In education matrix diagrams help students compare concepts theories or historical events. Trainers often use them to explain skill levels learning paths or evaluation criteria in a simple visual form that supports discussion.
Why Choose These Templates Instead of Default Slides
Default presentation slides often lack structure and visual balance. These matrix PowerPoint templates are designed by professionals who understand spacing alignment and readability. Every element has a purpose and supports your message.
- Ready to use layouts that save hours of design work
- Consistent proportions that look polished on screen and print
- Flexible designs suitable for formal and creative presentations
Creative Tips for Using Matrix Slides
Keep labels short and focused to avoid clutter. Use color contrast to highlight key areas or decisions. If your matrix feels crowded consider splitting it into two slides and guiding the audience step by step.
Icons can replace long text and help international audiences understand your message faster. Animations can also be used subtly to reveal each quadrant during a presentation and keep attention high.
Designed for Professional Results
These matrix diagrams work well for boardroom presentations client pitches internal meetings and academic lectures. They are compatible with modern versions of PowerPoint and designed to scale cleanly on large displays.
Download a matrix PowerPoint diagram today and turn complex comparisons into clear confident slides that support better decisions.
Frequently Asked Questions
Can I edit all elements in these matrix templates
Yes all shapes text colors and icons are fully editable directly in PowerPoint.
Are these templates suitable for corporate presentations
Absolutely the designs are clean professional and suitable for business and executive use.
Do I need design skills to use these slides
No the layouts are ready to use and easy to customize even for beginners.
Can I use these diagrams for training or education
Yes they are ideal for workshops lessons and learning materials.