Timeline Process Diagrams - Editable PPTX | ImagineLayout
Timeline Process Diagrams in PowerPoint
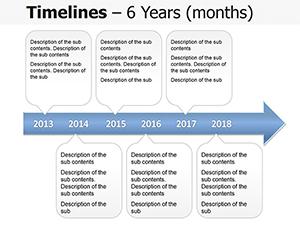
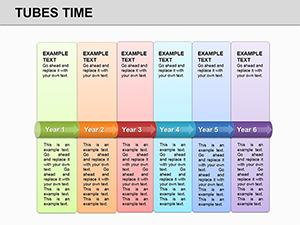
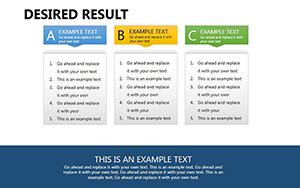
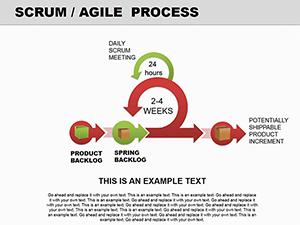
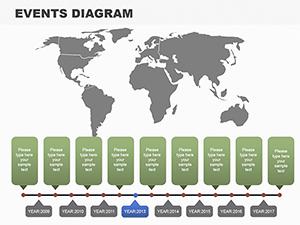
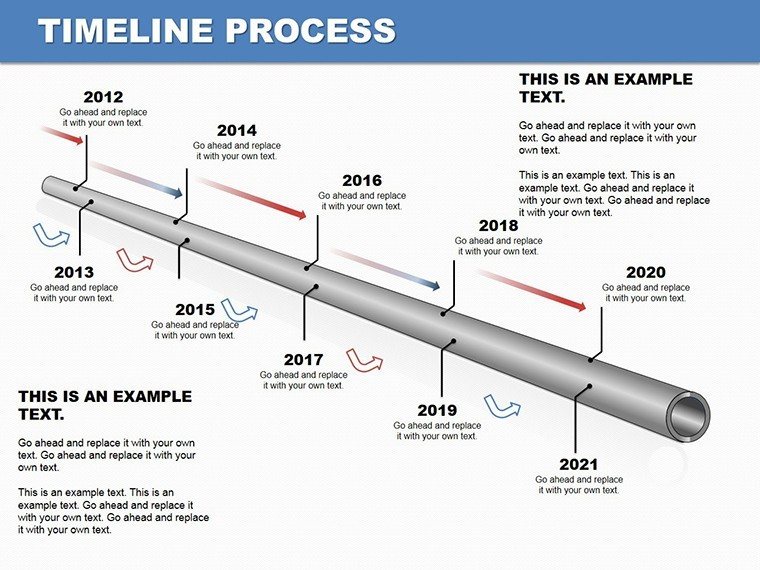
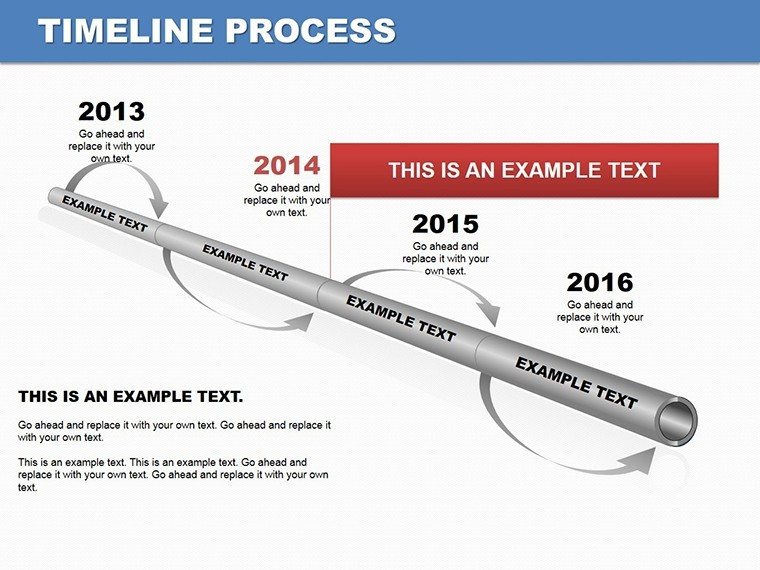
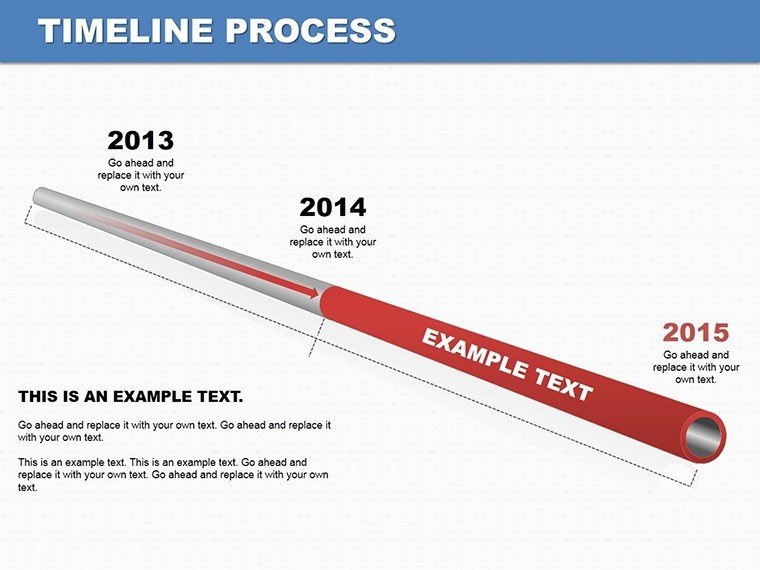
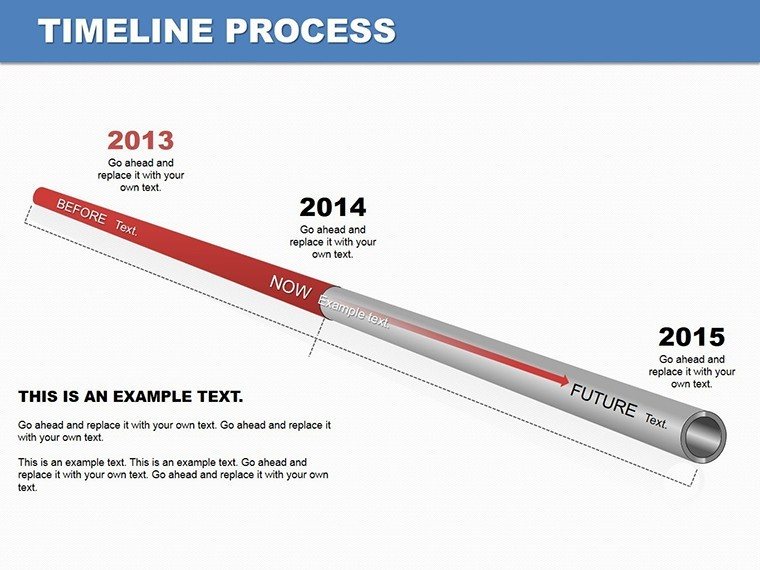
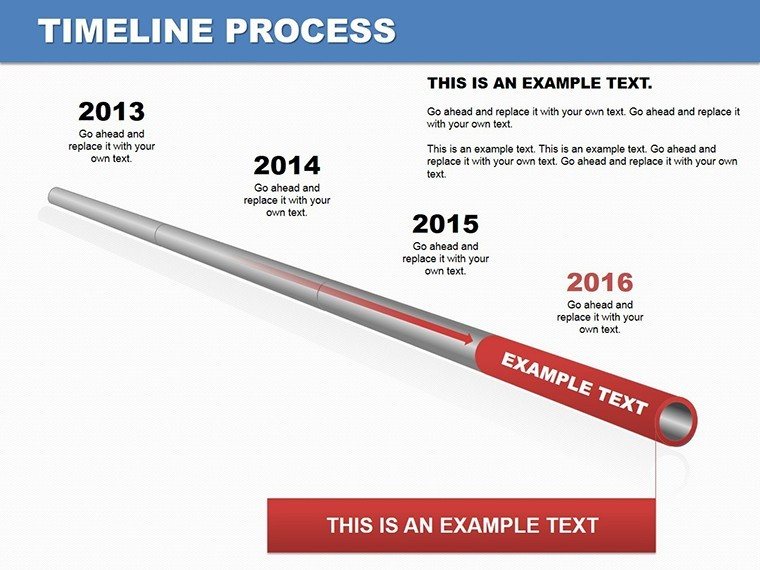
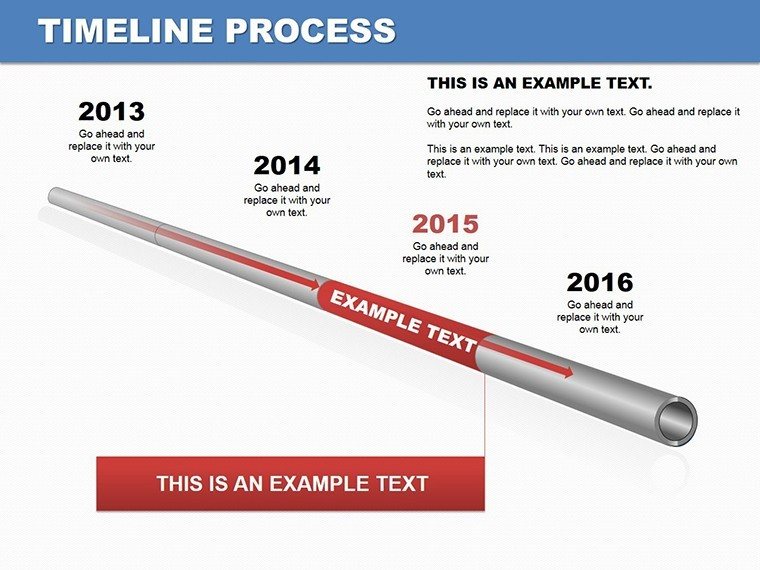
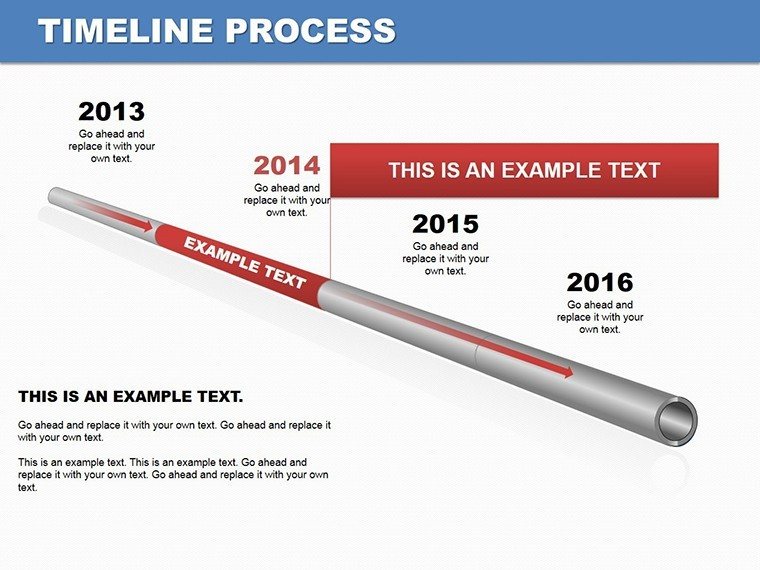
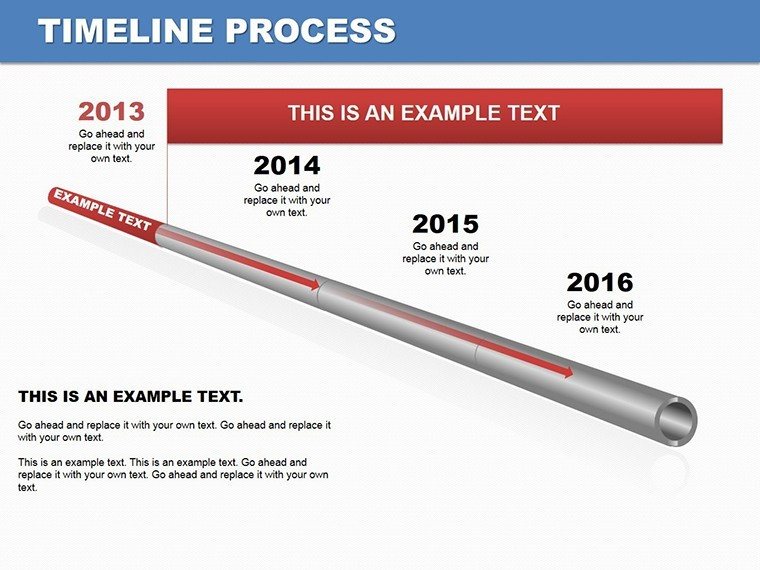
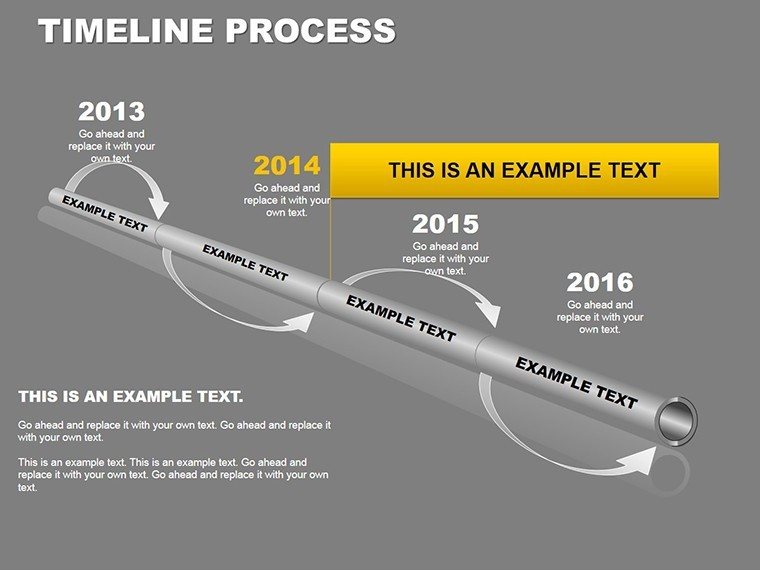
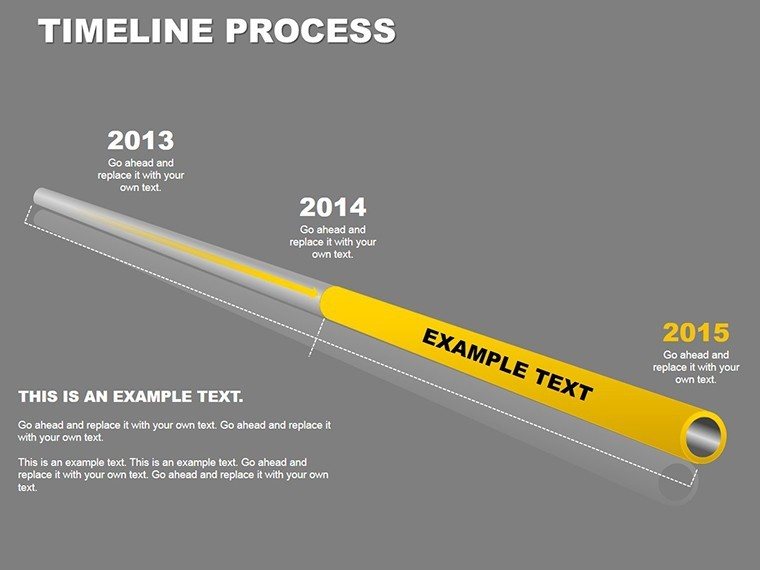
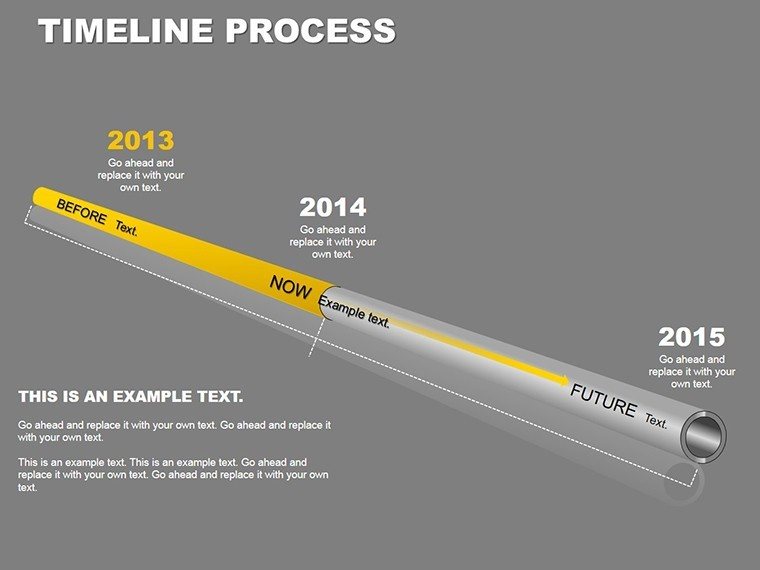
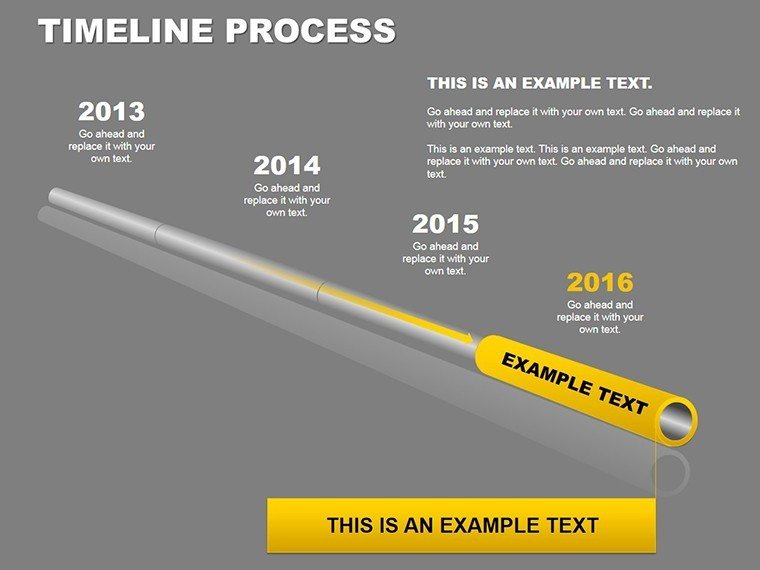
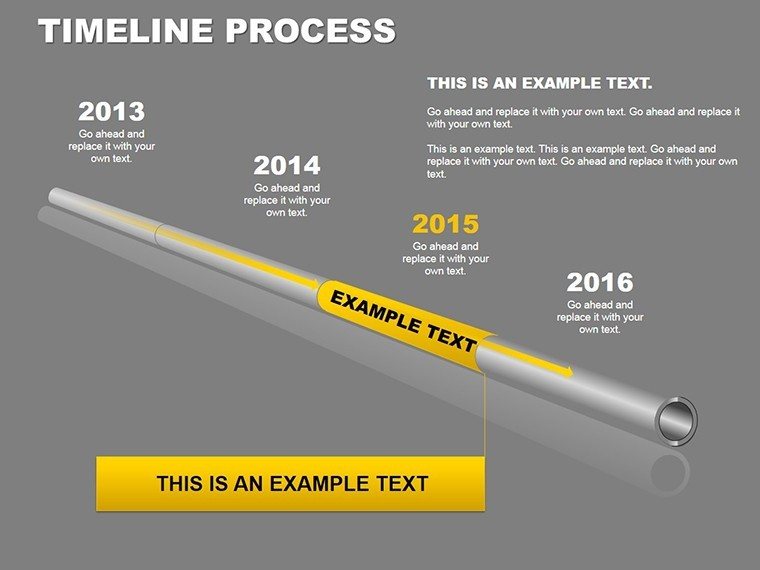
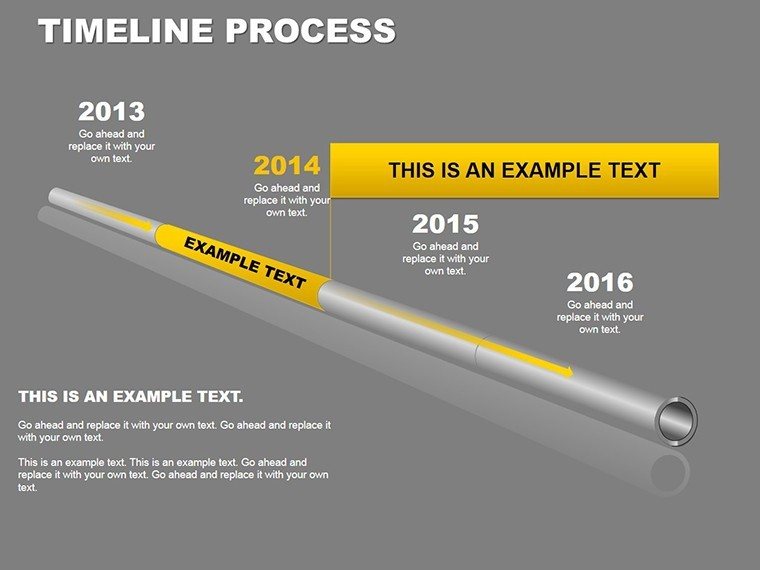
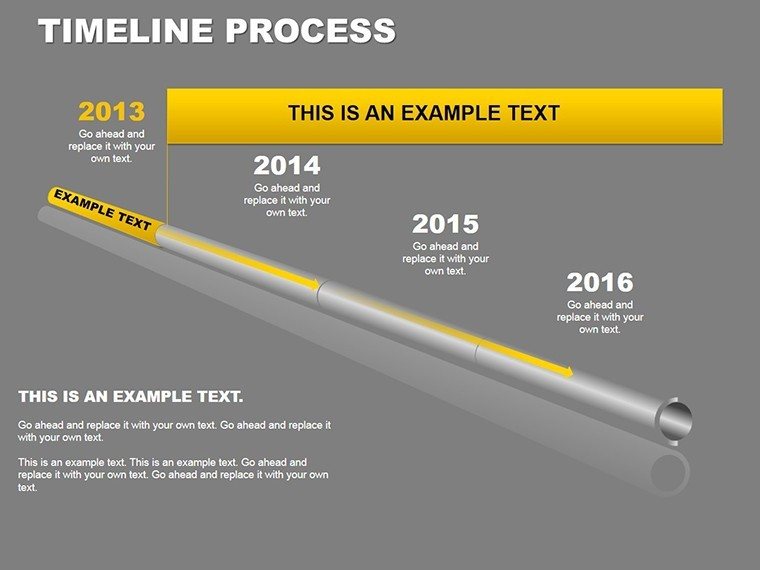
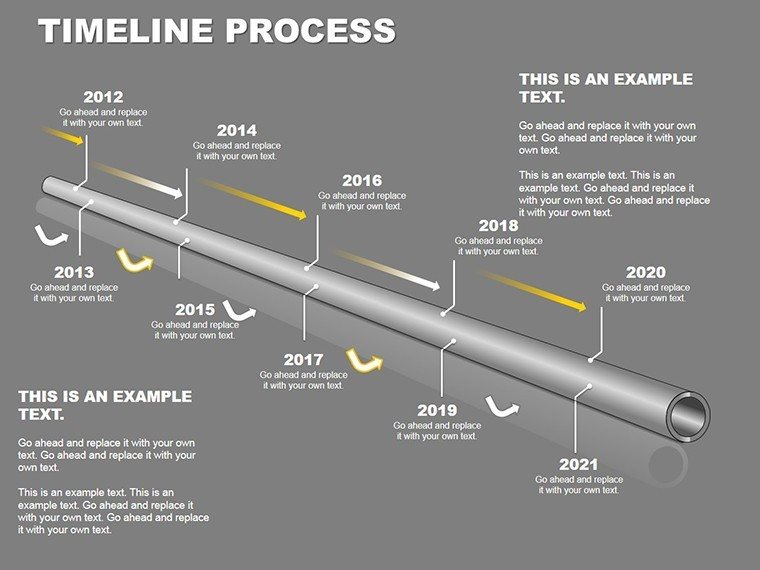
You get 16 timeline process diagrams in this single PPTX file. Horizontal flows link steps left to right using outline arrows between boxes. Vertical stacks line up phases from top to bottom. Circular variants spread out radially from a center point. You drop in your data and it works as-is.
And the file opens right in PowerPoint 2016 or later. No Keynote support here. It's $24 for the paid version with all 16 slides. No free version available so you get everything after purchase.
The spacing stays consistent across the layouts. Honestly the vertical alignment here is what makes it actually usable in practice.
The horizontal flow layouts are genuinely well-structured - each step connects without crowding the slide. If your team regularly presents project updates this set covers most of what you'll need without any redesign.
But to be honest these aren't great if you need to show lots of numerical data or detailed charts. Not ideal if you need charts with actual data. But for process flows? Yeah it works.
You know that situation when the deck is due tomorrow - this is exactly when you grab something like this. Project managers use them all the time for stakeholder meetings to map out where things stand. Check the Project Timeline Planning PowerPoint Slides if you want even more timeline focused options.
I just opened it changed the colors and it looked fine. Took maybe five minutes. The color system is one of the better-built parts - one change in the master and the whole deck updates. That alone saves real time.
The color switching is slightly confusing the first time but once you find the slide master it takes under a minute. Anyway one change and everything matches. Oh and the aspect ratio is 16:9 by default.
This helps teams figure out process steps and decide on adjustments. One thing I noticed - the diagrams don't feel crowded even when you add more text than you probably should. Yeah the spacing doesn't get messed up.
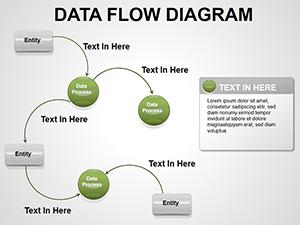
If you need similar options for other flows see the Data Flow PowerPoint Diagrams Template.
Specifications
| Feature | Details |
|---|---|
| Slides/diagrams | 16 slides including horizontal flows vertical stacks and circular/radial variants |
| File format | .pptx |
| Software version | PowerPoint 2016+ |
| Color schemes | Customizable via slide master theme palette; switch all slides at once |
| Editable elements | Boxes arrows and text resize and recolor independently |
| Aspect ratio | 16:9 |
| Free vs Paid | Paid version includes all 16 slides; no free version available |
| Masters/Backgrounds | Slide master for global color and style changes |
Download and start editing immediately
Frequently Asked Questions
How do I change the colors via the slide master?
So basically you open the file go to the View tab and click Slide Master. Pick your colors in the theme palette there and it updates every one of the 16 diagrams all at once. Honestly that's the easiest way. Works fine once you know where to look.
Does the license allow client work?
The short answer is yes for client projects under the standard terms. It's the same license most marketplaces use - one buyer one project commercial use is fine. Just don't resell the template itself. Depends a bit on your exact agreement but usually yes.
What are the free vs paid differences?
There is no free version at all. The paid one at $24 gives you the full 16 slides right away. In most cases that's what you want anyway since the free option isn't offered here. That's basically it.
What are the refund conditions?
Refunds aren't usually available once you download the file since it's digital. But if there's a real issue with the PPTX opening or something you can reach out. Oh and you can also export to PDF from there if needed before deciding.
Is it compatible with PowerPoint 2016/2019/365 on Mac?
Yes it works in PowerPoint 2016 and newer including 365 versions on both Windows and Mac. Took me a second to figure out the layout logic but after that it's straightforward. No issues there.