Spheres PowerPoint Diagrams
Transform complex ideas into clear visual stories with sphere diagram templates designed for impact. These professionally crafted graphics help you illustrate relationships, cycles, processes, and hierarchies using three-dimensional sphere elements that engage audiences.
Perfect for business presentations, educational lectures, marketing pitches, and strategic planning sessions, each template offers fully editable elements you can customize in minutes. Available for both PowerPoint and Keynote, these diagrams elevate your presentations from ordinary to memorable without requiring graphic design skills.
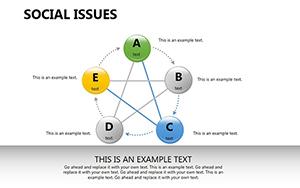 (197)
(197) Social Issues PowerPoint Diagrams TemplateID: #PD00196$23.00
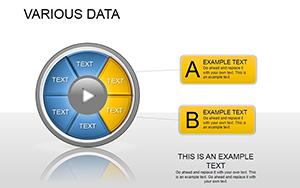 (1110)
 Various Data PowerPoint Template: Infuse Your Presentations with Visual IntelligenceID: #PD00182$20.00
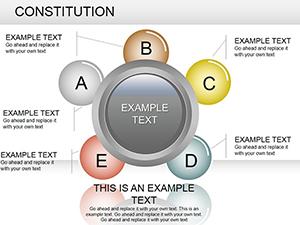 (126)
Strategic PowerPoint Diagram TemplateID: #PD00179$20.00
(126)
Strategic PowerPoint Diagram TemplateID: #PD00179$20.00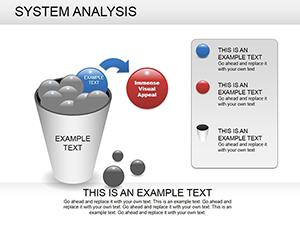 (814)
System Analysis PowerPoint Diagram: Decode Processes EffortlesslyID: #PD00169$25.00
(814)
System Analysis PowerPoint Diagram: Decode Processes EffortlesslyID: #PD00169$25.00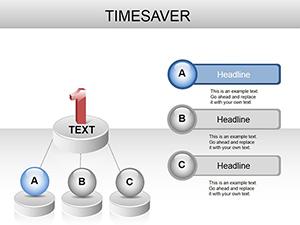 (1132)
Time Management PowerPoint Diagrams: Presentation TemplateID: #PD00162$22.00
(1132)
Time Management PowerPoint Diagrams: Presentation TemplateID: #PD00162$22.00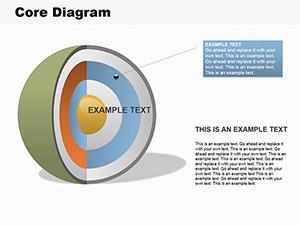 (435)
Core Spherical PowerPoint diagramsID: #PD00104$28.00
(435)
Core Spherical PowerPoint diagramsID: #PD00104$28.00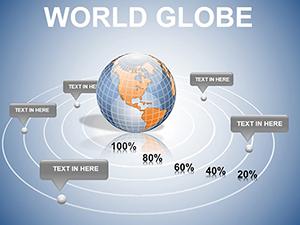 (391)
(391) World Globe PowerPoint Diagram: Global Insights VisualizedID: #PD00021$20.00
Why Sphere Diagrams Enhance Presentations
Visual communication outperforms text-heavy slides by significant margins. Sphere diagrams specifically excel at showing interconnected concepts because their circular form naturally suggests continuity, cycles, and relationships. Unlike rigid boxes or linear flowcharts, spheres convey motion and multidimensional thinking.
Audiences process visual information faster than written content. When you present data relationships, strategic frameworks, or process flows using sphere diagrams, viewers grasp concepts immediately. The three-dimensional appearance adds depth and sophistication that flat shapes cannot match.
Applications Across Industries and Functions
Business strategists use sphere diagrams to illustrate market positioning, competitive landscapes, and organizational structures. The overlapping sphere design particularly excels at showing how different business units, markets, or strategies intersect and influence each other.
Educators employ these diagrams to teach systems thinking, demonstrating how various factors in biology, chemistry, social sciences, or environmental studies interact. The visual metaphor of connected spheres helps students understand complex interdependencies.
Marketing teams visualize customer journey maps, buyer personas, and multi-channel strategies using sphere arrangements. Each sphere can represent a touchpoint, demographic segment, or platform, with connections showing how these elements relate.
Common Use Cases
- Business Strategy Presentations: Show how different departments collaborate, illustrate ecosystem partnerships, or map out growth strategies with interconnected sphere models.
- Project Management: Visualize project phases, stakeholder relationships, resource allocation, and dependency chains using sphere clusters and connection lines.
- Scientific and Academic: Explain molecular structures, ecosystem relationships, theoretical frameworks, or research methodologies through dimensional sphere representations.
- Sales and Marketing: Present product portfolios, service offerings, market segments, and value propositions with visually distinct sphere elements that audiences remember.
- Training and Development: Demonstrate skill relationships, competency frameworks, learning pathways, and organizational capabilities using layered sphere diagrams.
Design Advantages of Sphere Templates
Pre-designed templates solve the most challenging aspect of diagram creation: visual balance and professional appearance. Creating sphere graphics from scratch requires understanding lighting, shadows, gradients, and spatial relationships. Templates provide these elements refined and ready to use.
Color schemes in professional templates use contrast and harmony principles that ensure readability. Typography is scaled appropriately for labels and descriptions. Layout proportions maintain visual appeal whether displayed on small laptop screens or large conference room projectors.
Customization Strategies for Your Content
Begin by identifying how many main concepts your diagram needs to show. Most sphere templates accommodate three to eight primary elements comfortably. If you have more concepts, consider whether some can be grouped into categories or if a different diagram style might work better.
Match sphere colors to your presentation theme or brand palette. Consistent color use throughout your presentation creates cohesion and professionalism. If representing different categories or types of information, assign each category a distinct color that you maintain across all slides.
Keep text labels concise. Sphere diagrams work best when each element has a clear, brief label supplemented by your verbal explanation. Overcrowding spheres with text defeats their visual advantage. Use the notes section or supporting slides for detailed explanations.
Adjust sizes to show relative importance or magnitude. Larger spheres naturally draw more attention, making them perfect for emphasizing primary concepts while smaller spheres indicate supporting or secondary elements. This visual hierarchy guides your audience's focus exactly where you want it.
Technical Flexibility and Compatibility
Every element in these templates is fully editable. Resize spheres individually or proportionally. Change colors with a single click using your presentation software's color picker. Rearrange positions by dragging elements. Add or remove spheres as your content requires.
Templates work seamlessly in both PowerPoint and Keynote, ensuring you can collaborate with team members regardless of platform preference. Export capabilities let you save diagrams as images for reports, share them in PDFs, or incorporate them into other software.
Creating Impact in Different Presentation Contexts
For executive presentations, use sphere diagrams to show high-level strategic relationships without overwhelming details. Senior audiences appreciate visual summaries that communicate key points quickly.
In training sessions, build sphere diagrams progressively through animation. Start with one sphere and add others sequentially to help learners absorb information step by step rather than all at once.
During sales presentations, use sphere diagrams to position your solution within the client's existing ecosystem. Show how your offering connects with and enhances their current processes, technologies, or strategies.
Beyond Basic Circles
Modern sphere templates include variations like half-spheres for showing partial concepts, stacked spheres for hierarchies, and intersecting spheres for Venn diagram-style comparisons. These variations expand your visual vocabulary and help you match diagram style to content type.
Three-dimensional effects like shadows and gradients make spheres appear to float above the slide, creating visual interest that keeps audiences engaged. The depth perception draws eyes to diagrams naturally, making them focal points of your presentation.
Ready to create presentations that audiences remember? Download your sphere diagram templates now and start building visual stories that communicate with clarity and style.
Frequently Asked Questions
- Are these sphere diagrams editable in Google Slides?
- While designed for PowerPoint and Keynote, most templates can be imported into Google Slides and edited. Some advanced effects may require adjustment, but core functionality remains intact.
- Can I change the number of spheres in a template?
- Yes, spheres are individual objects you can duplicate, delete, or modify. Add more spheres by copying existing ones or remove unnecessary elements to fit your specific needs.
- Do I need special software to use these templates?
- No special software required. Templates work with standard PowerPoint or Keynote applications. No plugins or add-ons necessary for full functionality.
- Can I use these diagrams in reports and documents?
- Absolutely. Export diagrams as images and insert them into Word documents, PDFs, web pages, or any other format where visual elements enhance communication.
- How do I maintain visual consistency across multiple slides?
- Copy formatted spheres and paste them into other slides to maintain identical styling. Use your software's format painter tool to apply consistent colors and effects throughout your presentation.