Flow PowerPoint Diagrams
Formerly known as flow PowerPoint diagram templates - this collection now covers PowerPoint flowchart and process flow diagrams. Operations managers and consultants reach for these when a blank slide would require hours of manual connector drawing.
Picture an operations manager documenting the order fulfillment process for a new warehouse. The stakeholder meeting is tomorrow and every decision branch must be crystal clear. The template provides pre-connected shapes so the focus stays on logic, not alignment.
This collection focuses on process clarity. Download to begin mapping your next workflow.
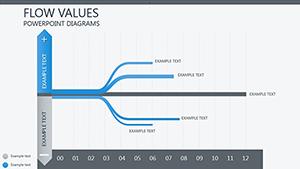 (715)
(715) Data Flow Diagrams PowerPoint Template: 20 SlidesID: #PD00066$21.00
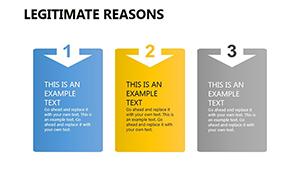 (712)
(712) Legitimate Reasons PowerPoint Diagram Template: Empower Ethical NarrativesID: #PD00193$19.00
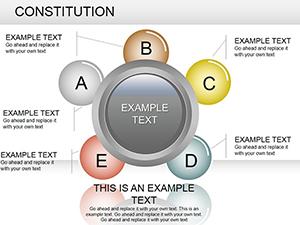 (126)
(126) Strategic PowerPoint Diagram TemplateID: #PD00179$20.00
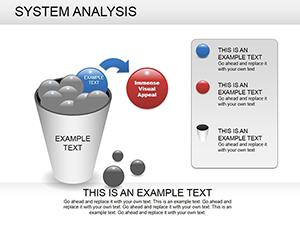 (814)
System Analysis PowerPoint Diagram: Decode Processes EffortlesslyID: #PD00169$25.00
(814)
System Analysis PowerPoint Diagram: Decode Processes EffortlesslyID: #PD00169$25.00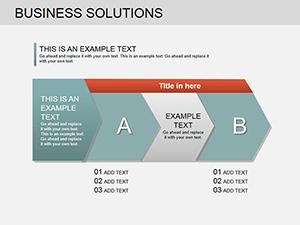 (827)
Business Solutions PowerPoint Diagrams TemplateID: #PD00163$23.00
(827)
Business Solutions PowerPoint Diagrams TemplateID: #PD00163$23.00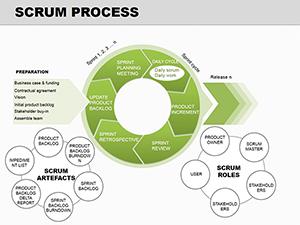 (109)
Agile Scrum Process PowerPoint Diagrams: Visualize Iterative SuccessID: #PD00078$17.00
(109)
Agile Scrum Process PowerPoint Diagrams: Visualize Iterative SuccessID: #PD00078$17.00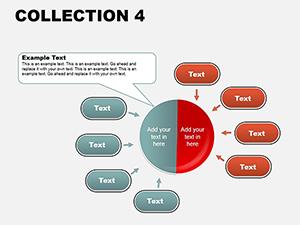 (534)
PowerPoint Diagrams Collection: Weaving Data into NarrativesID: #PD00063$18.00
(534)
PowerPoint Diagrams Collection: Weaving Data into NarrativesID: #PD00063$18.00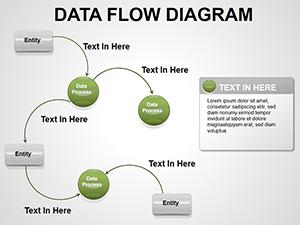 (1118)
Data Flow PowerPoint Diagrams TemplateID: #PD00017$22.00
(1118)
Data Flow PowerPoint Diagrams TemplateID: #PD00017$22.00
Why Process Mapping Needs More Than Default Shapes
Standard SmartArt often collapses when more than six steps appear. These flowcharts use grouped editable shapes that expand without breaking connectors.
Real-World Scenarios Where These Flowcharts Save the Day
A supply-chain analyst at a manufacturing firm must present the new vendor approval workflow to the CFO. The template supplies a decision-tree layout; only the approval steps change.
A project manager mapping the software release cycle for the steering committee uses the swimlane template to show responsibilities across departments without redrawing lanes.
An HR director documenting the employee onboarding process creates a linear flowchart that fits on one slide and prints cleanly for the handbook.
A quality manager at an automotive supplier visualizes the defect resolution process; the template`s color-coded decision diamonds highlight escalation paths instantly.
How Flowchart Templates Support Cross-Department Consistency
One master file with defined shape styles ensures every department uses the same arrow style and decision diamond color. Updates to the master propagate to every linked deck.
Non-Obvious Customization Tricks for Complex Flows
Group a sequence of process boxes into a single object; duplicate the group and reconnect with one drag to create parallel paths without re-aligning.
Technical Considerations When Working with PowerPoint SmartArt and Shapes
In PowerPoint, keep connectors attached to shape connection points so resizing the slide layout never breaks the flow. Export to PDF with "Best for printing" to preserve vector sharpness.
What Sets These PowerPoint Flowchart Templates Apart
Layouts prioritize clarity over decoration. Every shape remains fully editable, connectors stay attached, and text reflows without manual adjustment.
Finding the Right Template Category for Your Next Mapping Project
For data visualization inside presentations see our Keynote pie chart templates. Software teams may prefer the software Keynote templates. When the deliverable is a printed brochure, explore the telecommunication brochures templates.
Download the PowerPoint flowchart collection now to start mapping with structure already in place.
Are these flowchart templates compatible with Microsoft PowerPoint 365?
Yes, built and tested in PowerPoint 365 and 2021. Connectors remain attached, SmartArt styles update cleanly, and shapes are fully editable.
Can I export these to PDF without losing connector lines?
Yes, use the "Best for printing" PDF option. All lines and text remain vector-sharp on any device.
Do the templates support swimlane diagrams?
Yes, dedicated swimlane masters let you drag responsibility bands and keep process steps aligned inside each lane.
What license covers department-wide sharing?
The license allows unlimited internal company use and client presentations. Resale of the template files is prohibited.
Can I change colors across the entire flowchart at once?
Yes, update the theme colors on the master slide; every shape, connector, and text box inherits the new palette instantly.