Cash Flow Charts - Editable PPTX | ImagineLayout


CASH FLOW - Editable PPTX
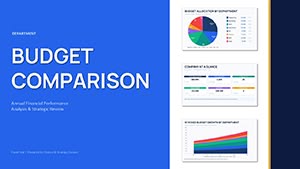
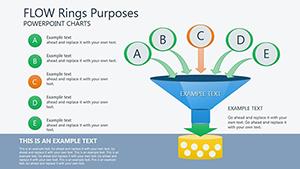
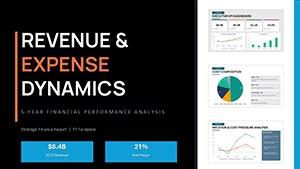
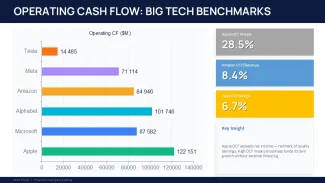
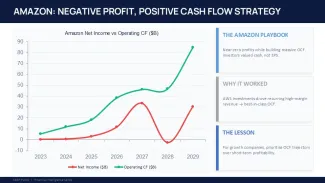
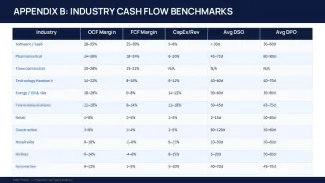
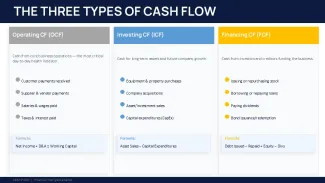
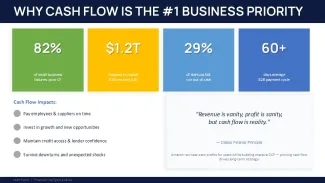
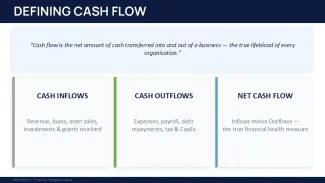
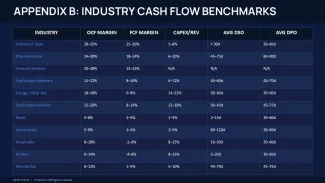
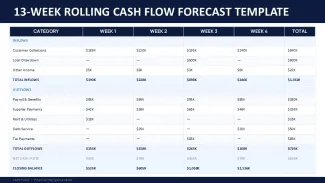
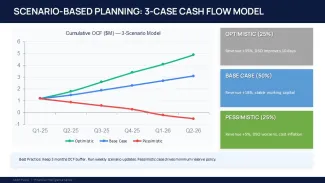
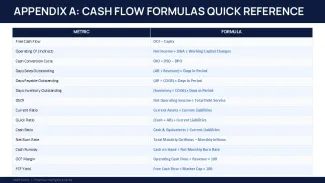
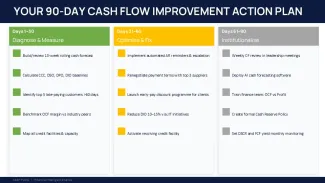
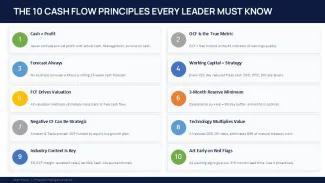
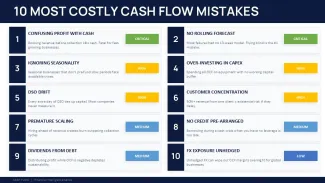
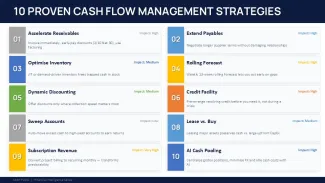
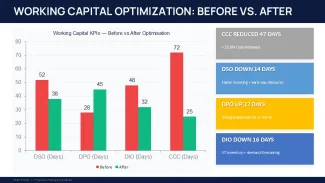
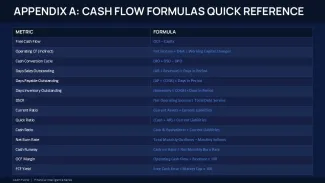
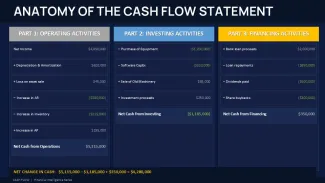
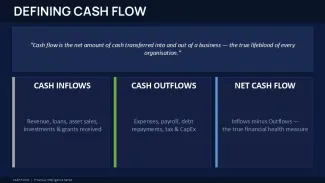
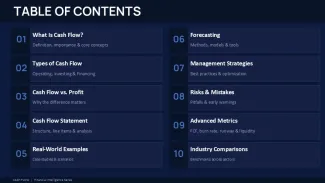
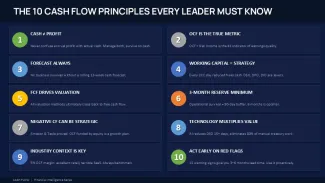
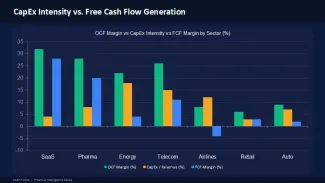
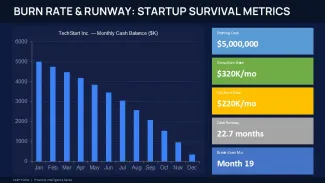
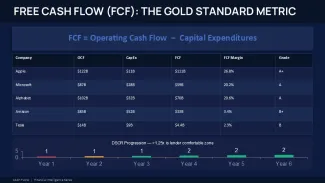
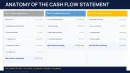
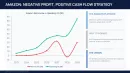
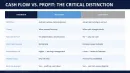
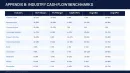
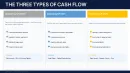
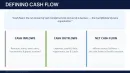
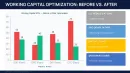
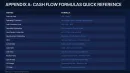
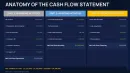
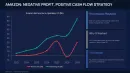
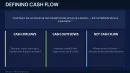
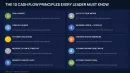
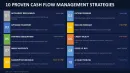
This PowerPoint charts template is built around cash flow reporting, budget tracking, and branch-level comparison slides. The layout set includes waterfall charts moving horizontally from left to right, stacked KPI cards with wide spacing, matrix diagrams, and a few tighter grid slides for financial breakdowns. Some slides use circular markers connected with thin outline arrows while others lean into rectangular data blocks with filled color sections. The spacing is actually one of the better parts here because even the denser financial slides still leave room for labels and comments.
The package includes editable PPTX slides for Microsoft PowerPoint. Based on similar releases in this series, the file works in PowerPoint 2016, Microsoft 365, and Mac versions without layout issues. The paid version includes the complete editable deck while the free version, when available, usually contains only a small sample with limited slide access. Honestly, I just opened it, changed the colors, and it looked fine. Took maybe five minutes.
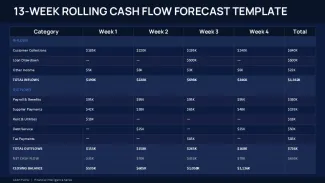
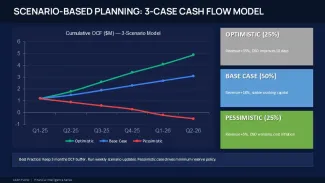
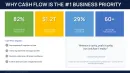
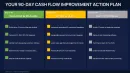
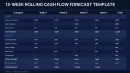
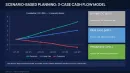
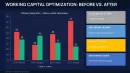
The diagrams mostly flow horizontally. Waterfall charts stack from left to right with consistent bar widths, while comparison slides use evenly spaced columns with outline icons and flat shape indicators. Some KPI layouts place large numbers in isolated cards with a lot of empty margin around them, which helps once the slides get crowded with real financial data. And that matters more than people think when quarterly decks start turning messy.
This set works best for finance teams, analysts, operations managers, and department leads preparing monthly or quarterly reporting decks. You know that situation when the deck is due tomorrow and you do not want to think about layout anymore - this is exactly when you grab something like this. The horizontal flow layouts are genuinely well-structured, especially for cash movement reporting where you need viewers to follow changes step by step without getting lost.
Not ideal for presentations that depend heavily on storytelling graphics or big image-based slides. These layouts are built for structured numbers and comparison logic. But for budget reviews, branch analysis, operating cost tracking, or internal reporting meetings, it fits naturally. Works as-is.
I liked how the card layouts resize pretty cleanly even after adding longer labels. Took me a second to figure out the layout logic, but after that it is straightforward. The color switching is slightly confusing the first time, but once you find the slide master it takes under a minute. I always change the colors in the master first before filling in any data. Also works for internal team updates, not just client decks.
The paid version is around $30 based on related chart releases in this category. In practice, that feels reasonable if you reuse the slides for recurring reporting. The color system is one of the better-built parts - one change in the master and the whole deck updates. That alone saves real time.
Template Specifications
| Feature | Details |
|---|---|
| Slides/diagrams | Around 50 editable slides including waterfall charts, KPI cards, matrices, and branch comparison layouts |
| File format | .pptx editable PowerPoint presentation file |
| Software version | PowerPoint 2016+, Microsoft 365, and Mac PowerPoint support |
| Color schemes | Multiple preset financial color themes editable through slide master controls |
| Editable elements | Charts, arrows, icons, labels, bars, tables, and text blocks resize independently |
| Aspect ratio | 16:9 widescreen presentation layout |
| Free vs Paid | Free sample includes limited slides while paid version unlocks the complete editable deck |
| Masters/Backgrounds | Master slides control fonts, colors, and chart styling globally |
FAQ
How do I change the template colors through Slide Master?
Open the PPTX file in PowerPoint, then go to View and choose Slide Master. From there you can edit theme colors, fonts, and background styles once and the changes apply across the whole deck automatically. Honestly, this is the easiest way because changing each chart manually gets annoying fast.
Can I use this template for client presentations and commercial work?
Commercial use is usually allowed for presentations you create for clients or internal business reporting. It is the same license most marketplaces use - one buyer, one project, commercial use is fine. Reselling the template itself or redistributing the editable source files is generally not allowed.
What is the difference between the free and paid versions?
The short answer is the paid file includes the full editable slide collection with all chart layouts and placeholders. Free downloads, in most cases, only contain a few preview slides so you can test formatting and compatibility first. If you actually need recurring reporting layouts, the paid version makes more sense because the whole structure is already there.
What happens if the template download does not work or I need a refund?
So basically, refunds depend a bit on the issue itself. Broken files or corrupted downloads are usually replaced first before refund requests are processed. Most users just contact support and get a working copy pretty quickly anyway.
Does this work in PowerPoint 2016, 2019, Microsoft 365, and Mac?
Yes, the PPTX format is built for modern PowerPoint versions including Microsoft 365 and Mac releases. Animations and editable chart elements usually transfer without issues between those versions. Oh, and you can also export the presentation directly to PDF from there.
Related templates: Profit by Regions and Branches Analysis, PowerPoint Charts Templates, and ImagineLayout FAQ.
Download and start editing immediately