Academic Achievement VS Student Satisfaction PowerPoint Template and Charts


Overview
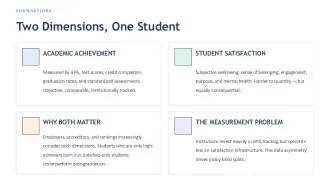
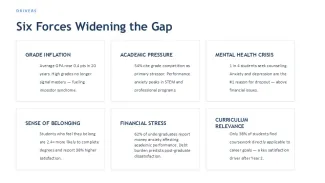
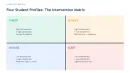
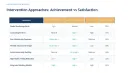
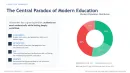
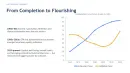
This PowerPoint template provides structured comparison slides focused on academic achievement versus student satisfaction. It includes multiple cycle diagrams and pie charts designed for education sector reporting, institutional reviews, and performance analysis presentations.
Editing Behavior
Placeholders in the cycle and pie layouts resize proportionally while maintaining alignment. Grouped chart elements stay intact when duplicating slides, and color themes applied through the Slide Master update all related visuals consistently across the 35 slides. Long category labels wrap without breaking the diagram proportions.
Key Features
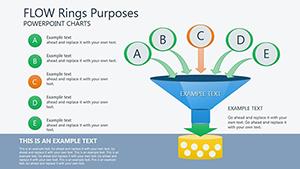
- 35 fully editable slides with cycle and pie chart variations
- Consistent layout behavior when swapping data series
- Vector elements that remain crisp after scaling
- Built-in support for standard 16:9 aspect ratio
- Easy duplication of comparison layouts
| Specification | Details |
|---|---|
| Slides | 35 editable slides |
| Format | .pptx |
| Aspect Ratio | 16:9 (standard widescreen) |
| Customization | Slide Master color schemes update all charts |
| Compatible Software | PowerPoint 2016 and newer (including Microsoft 365) |
Frequently Asked Questions
Can I change colors across all charts easily?
Yes. The template uses Slide Master color palettes. Updating the theme colors propagates to all cycle and pie charts automatically.
Are the charts fully editable in PowerPoint?
All diagrams are native PowerPoint objects. You can modify data, labels, and styles directly without losing layout integrity.
Is this suitable for commercial client work?
Yes. Purchased templates include rights for use in client presentations and internal reports.