 Click to zoom
Profit by Regions and Branches Analysis - Editable PPTX | ImagineLayout
| Format | .pptx |
| Slides | 49 unique layouts |
| Aspect ratio | 130/73 |
| Compatibility | PowerPoint |
| Animated | No |
| Language | English |
| License | Commercial |
| File size | — |
| Version | v1.0 |
| Last updated | April 2026 |
What's inside
Profit by Regions and Branches Analysis - Editable PPTX
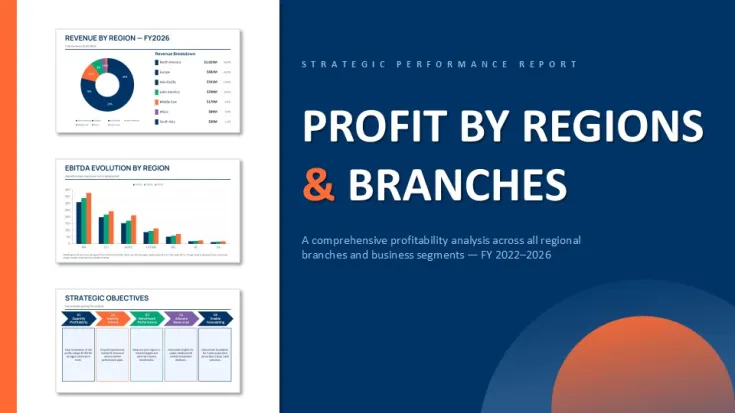
You get 50 slides in this PPTX built around bubble matrices and heatmaps to break down profit by regions and branches. The bubble ones sit in a square grid with even spacing left to right and top to bottom while the heatmaps use tight rectangular cells filled by color intensity. Waterfall charts run horizontal with bars stacking left to right and KPI scorecards sit in a loose card grid with plenty of space around each number.
File is pure PPTX and opens straight in PowerPoint 2016 plus later versions including Mac. Paid version runs $30 for the complete editable set with all charts tables and placeholders. Free samples when they pop up only give you a couple slides without the full regional structure.
And the bubble matrix layout direction is the detail I noticed first because the circles keep balanced spacing even if you push longer labels in there. You drop in your data and it works as-is.
But it's not ideal if you're doing open-ended brainstorming because the layouts stay pretty fixed for data comparison.
In practice this is exactly what a finance director grabs when the quarterly board deck lands tomorrow and they need branch performance numbers without rebuilding everything.
Regional heads and analysts who crank out these reports every quarter are the ones who actually reach for something like this.
Color changes run through the slide master so one tweak updates the deck. I always change the colors in the master first before filling any data - took me a second to figure out the layout logic but after that it's straightforward.
Honestly the vertical alignment here is what makes it actually usable when you compare regions side by side.
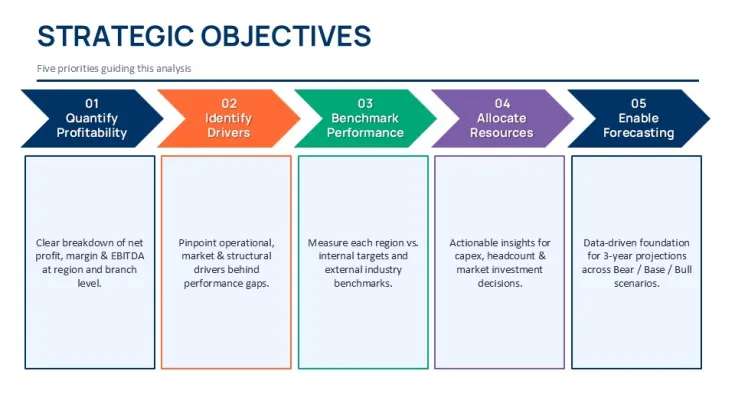
The horizontal flow layouts are genuinely well-structured - each step connects without crowding the slide. If your team regularly presents project updates this set covers most of what you'll need without any redesign.
Honestly I just opened it changed the colors and it looked fine. Took maybe five minutes.
The color system is one of the better-built parts - one change in the master and the whole deck updates. That alone saves real time.
You know the kind of deck where you need it done today and don't want to think about layout? This is that. For anyone who presents quarterly reviews or stakeholder updates this gives you a solid starting point that doesn't look generic.
Oh and the aspect ratio is 16:9 by default anyway.
Template Specs
FeatureDetailsSlides/diagrams50 slides with bubble matrices heatmaps waterfall charts and KPI scorecardsFile format.pptxSoftware versionPowerPoint 2016+ including Mac versionsColor schemesSwitch entire palette via one slide master editEditable elementsCharts tables text placeholders resize and recolor independentlyAspect ratio16:9Free vs PaidFree limits to sample slides; paid unlocks full 50-slide editable file for $30Masters/BackgroundsSingle slide master for quick global updatesDownload and start editing immediately
Need more options? Check the full analysis PowerPoint charts category or similar files like the Business Analysis PowerPoint Charts Template and Business Analysis Solution PowerPoint Charts.
How do I change the colors across all slides?So basically you switch to Slide Master view in PowerPoint click the master slide at the top and adjust the color scheme there. Everything updates automatically once you return to normal view. It's the same for all the bubble matrices and heatmaps too.
Can I use this template for client work?The license lets you modify the file and deliver customized versions to external stakeholders or clients. Just don't resell the template itself as-is. It's the same license most marketplaces use - one buyer one project commercial use is fine.
What's the difference between free and paid?Paid gives you the complete 50-slide file with every chart and placeholder fully editable. Free versions when they're available only hand out a few sample slides and skip the full regional analysis setup. In most cases the paid one is what you actually need for a real deck.
What are the refund conditions?Refunds are available within 14 days if the file doesn't meet your expectations after you download and test it in PowerPoint. Just contact support with your order details and they handle it quickly. Works fine as long as you haven't heavily customized or shared it.
Does this work with PowerPoint 2016 2019 365 and Mac?Honestly it opens and edits without issues in PowerPoint 2016 2019 365 and all Mac versions. All the charts and tables stay fully editable. - actually the easiest way is just to open the file and start swapping your numbers right away. Oh and you can also export to PDF from there.
Good for
- Project roadmaps and sprint plans
- Product launch timelines
- Quarterly or annual review decks
- Company history and milestone summaries
Licence
reviews
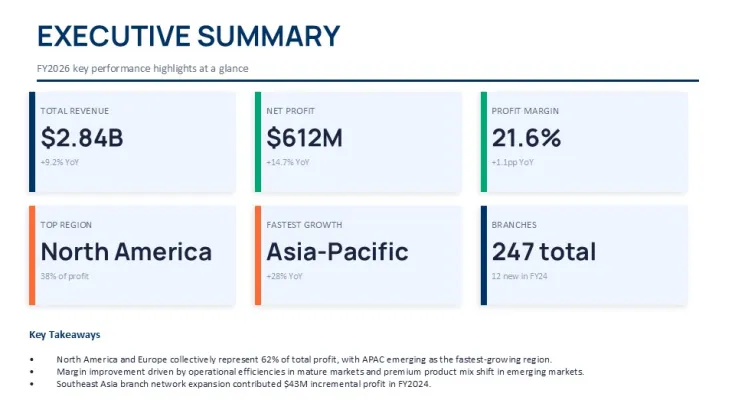
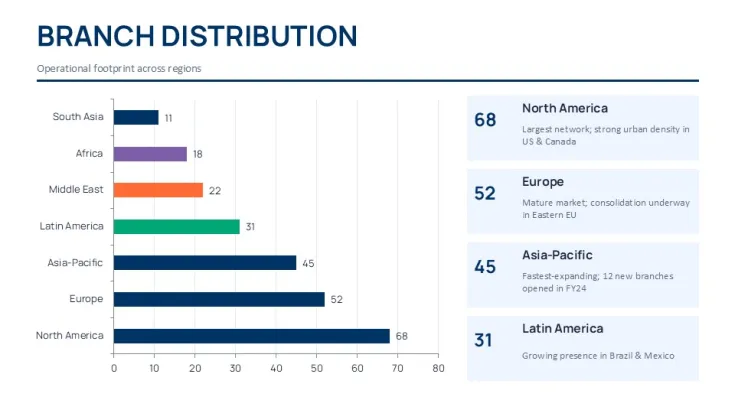
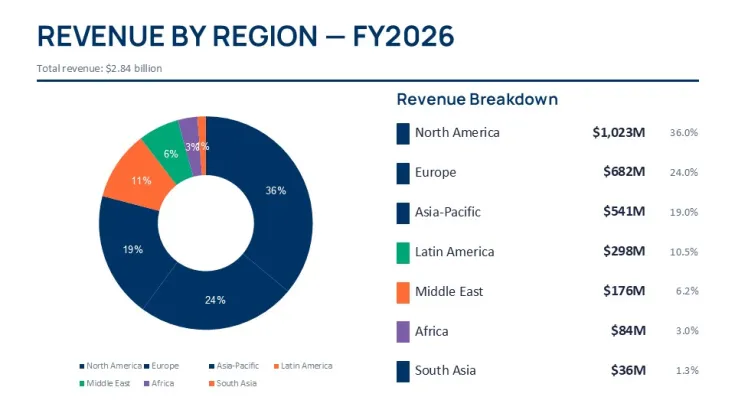
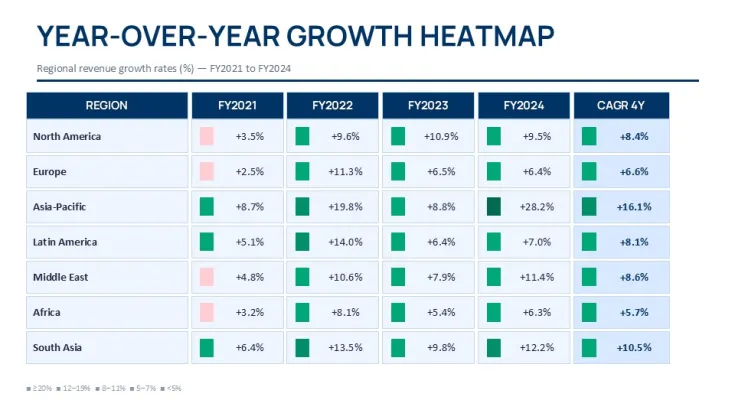
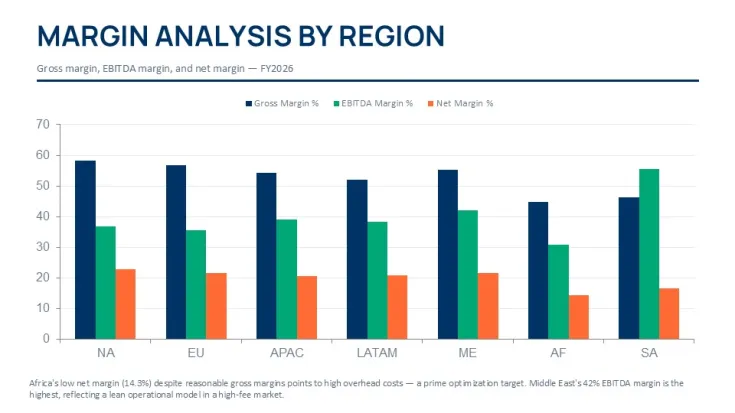
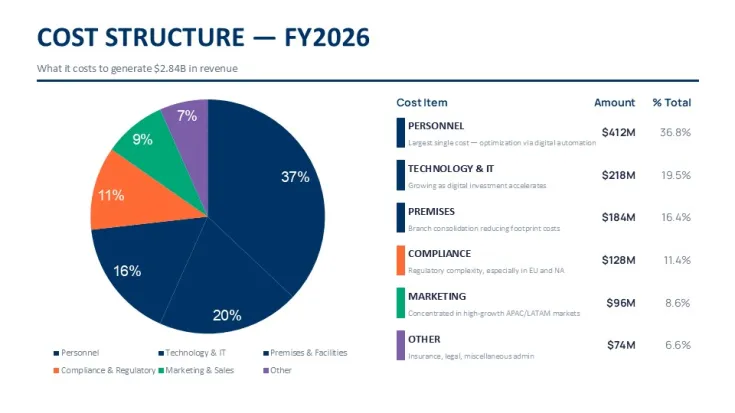
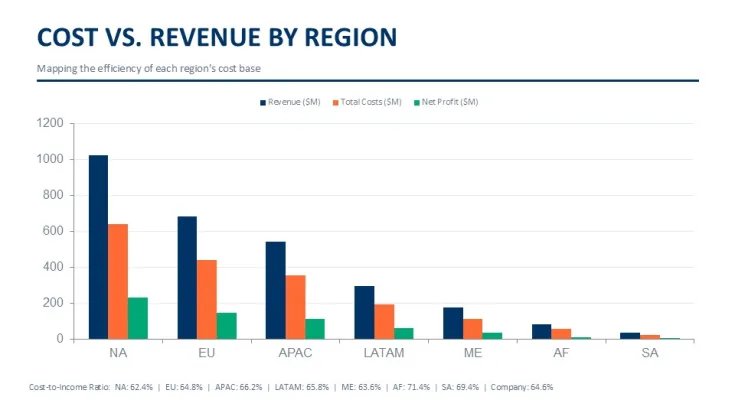
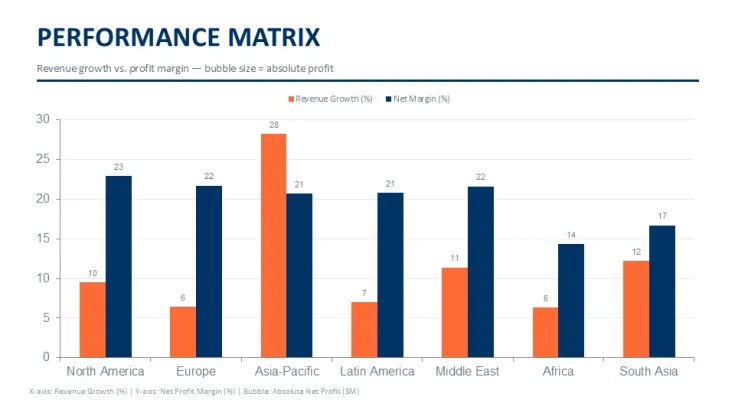
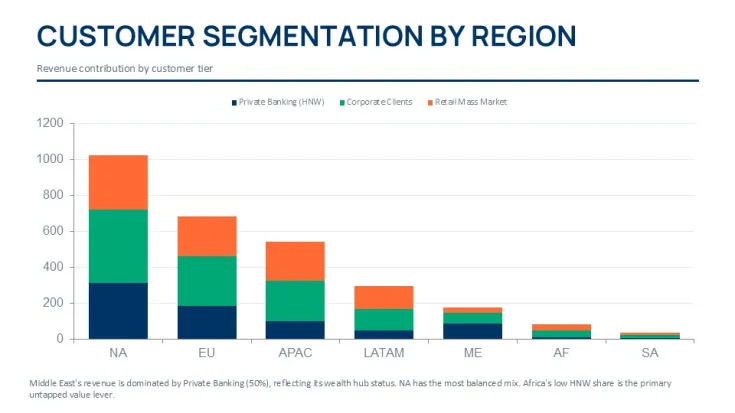
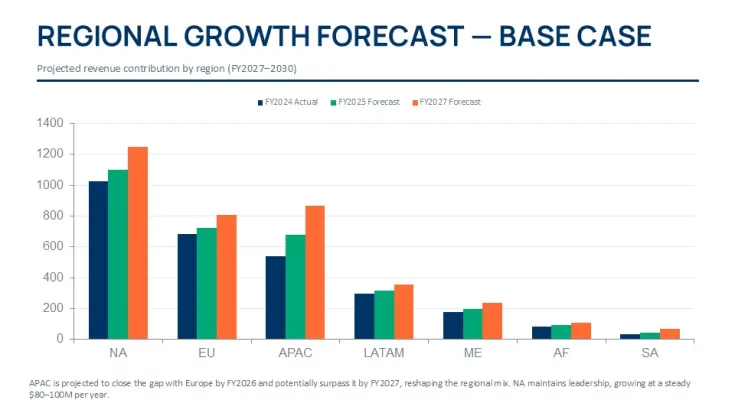
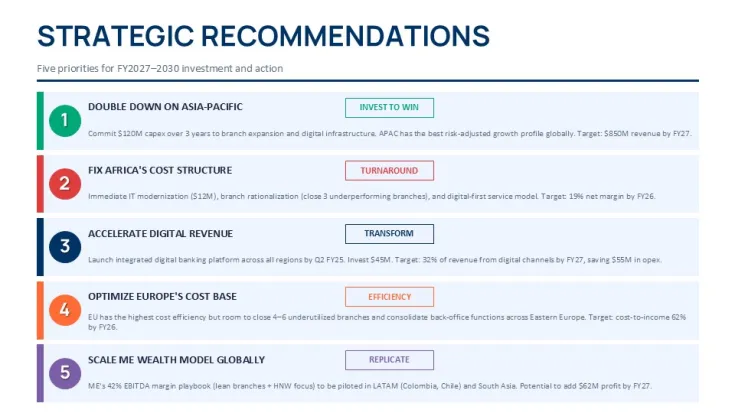
The bubble matrices with even spacing left to right and top to bottom helped me break down profit by region for a quarterly board deck. The heatmaps used tight rectangular cells filled by color intensity which made variance obvious.
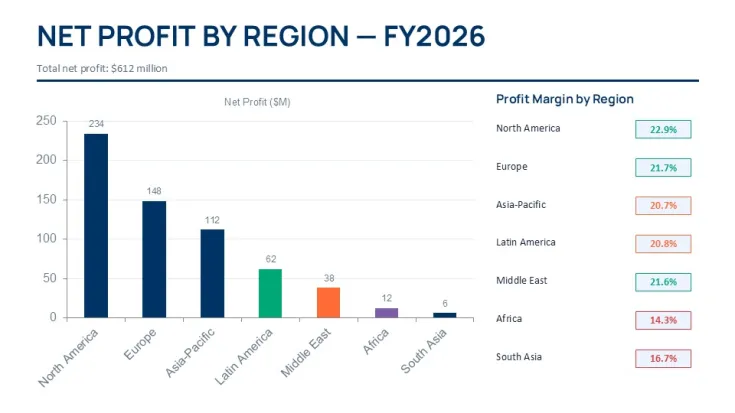
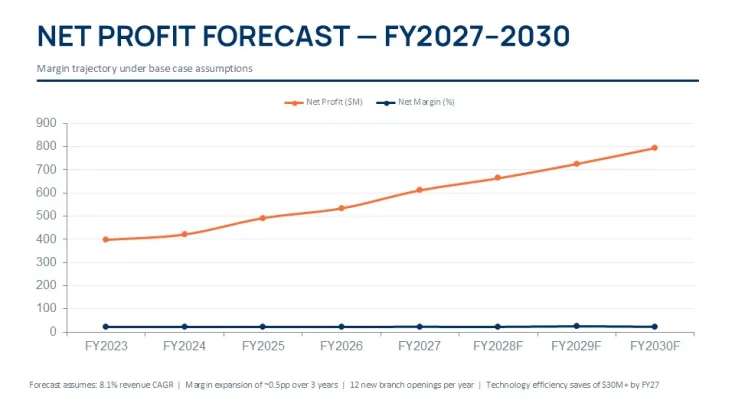
Paid version runs $30 for the complete editable set which is worth it if you do branch performance reports every quarter. The vertical alignment here makes comparing regions side by side actually usable.
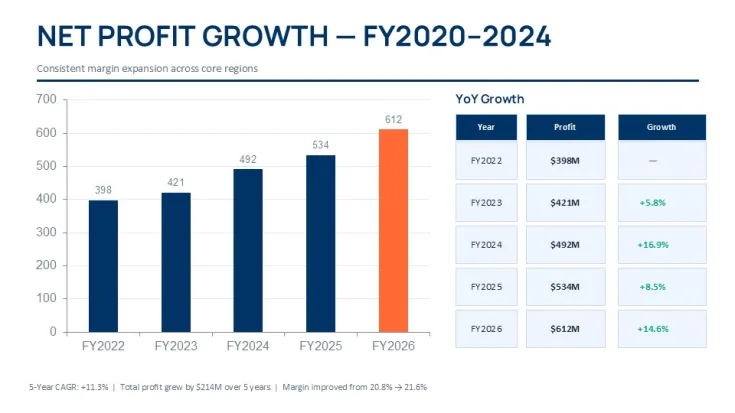
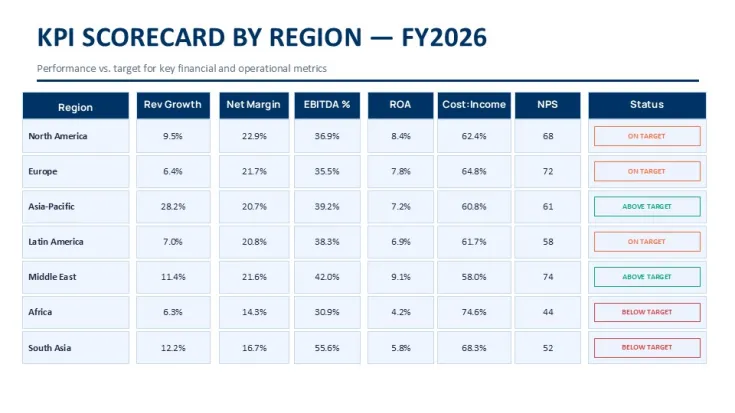
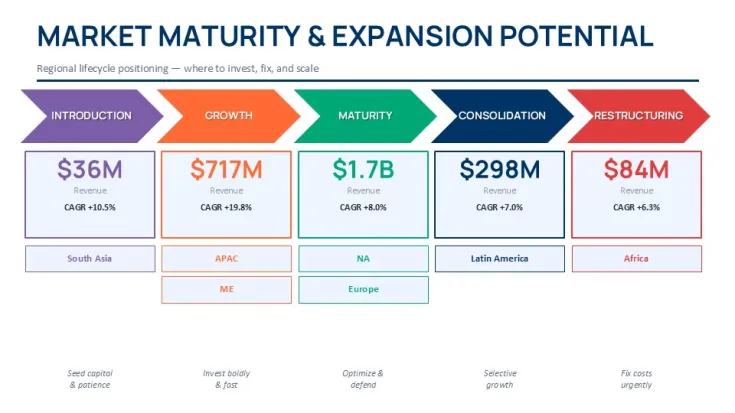
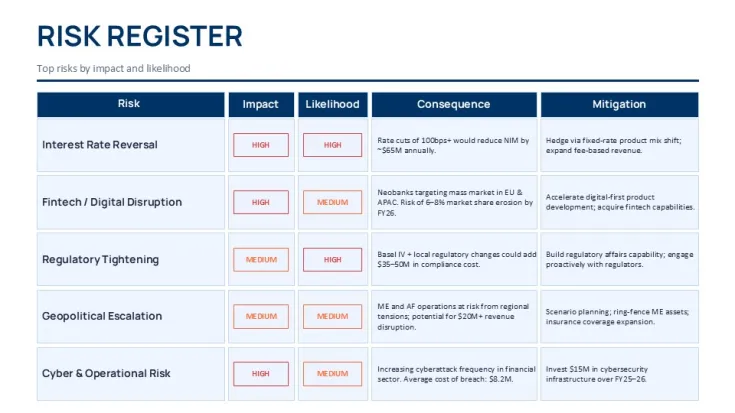
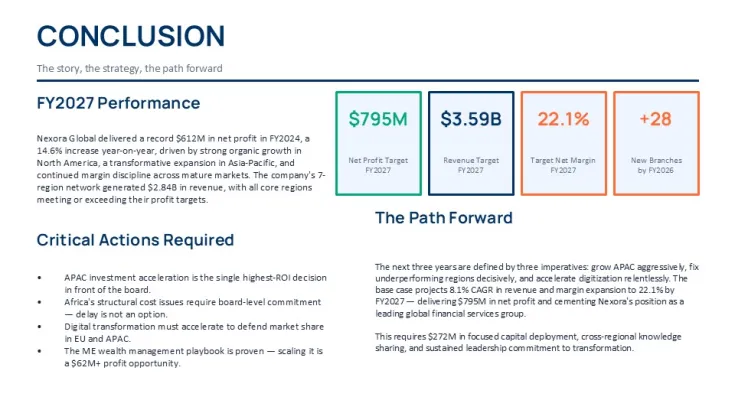
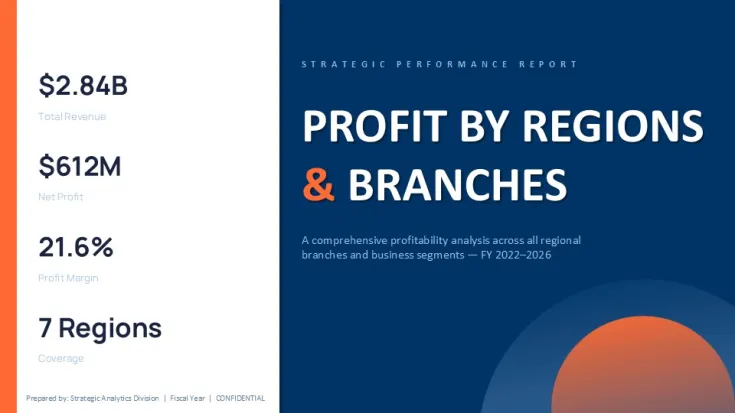
Used this for a finance director update and the KPI scorecards in a loose card grid had plenty of space around each number. Dropped in my data and it worked as-is.
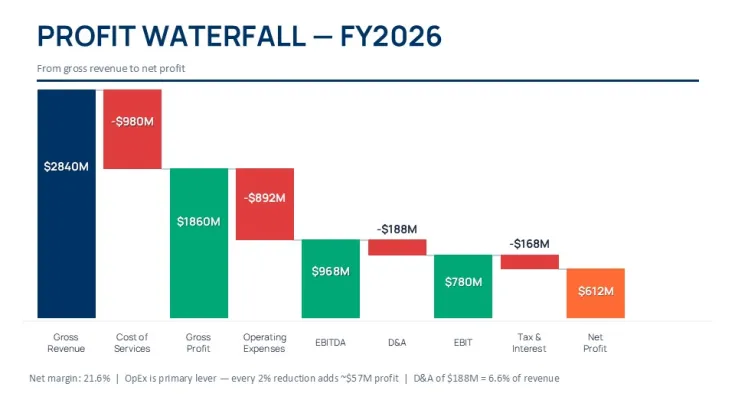
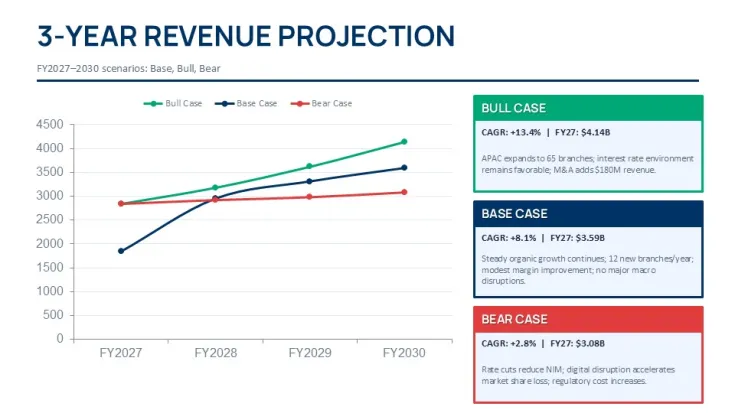
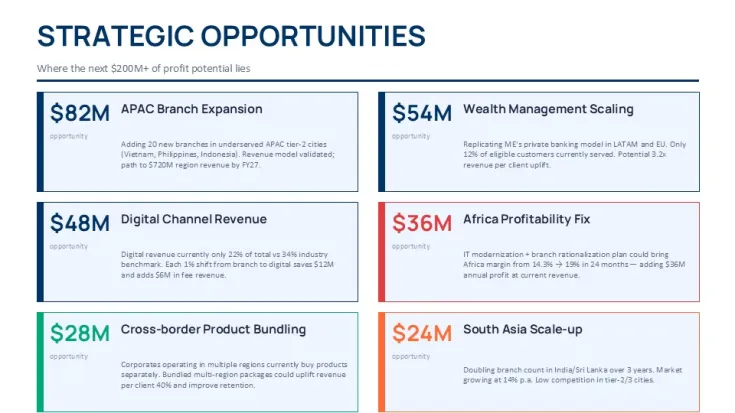
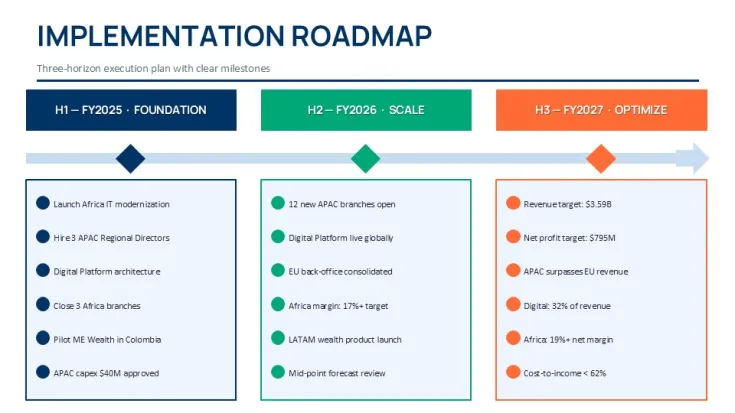
The waterfall charts run horizontal with bars stacking left to right which worked for my regional analysis. The layouts stay pretty fixed so not great for brainstorming but perfect for data comparison.
The slide master color changes update the whole deck which saved me time. The bubble matrices keep balanced spacing even if you push longer labels in there. Took maybe five minutes to get it ready.
FAQ
Will it work in Google Slides?
Are fonts embedded?
Can I use this for client work?
What's the refund policy?
Do you update the template after purchase?
Similar templates
See all PowerPoint Charts →
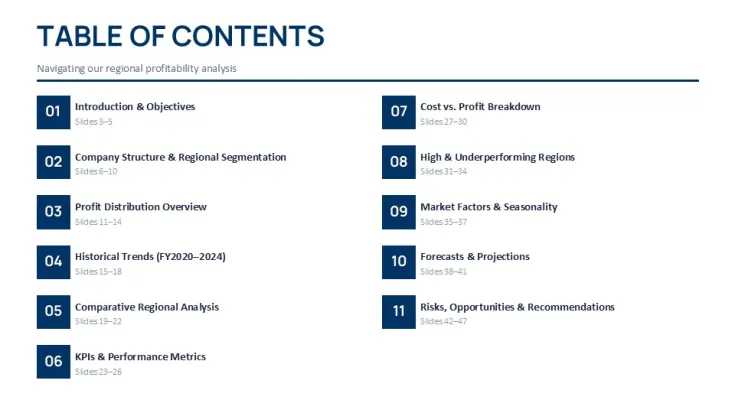
All 49 slides