Organizational PowerPoint Diagrams
Formerly known as organizational powerpoint diagram templates - this collection now covers organizational charts.
These templates contain pre-built layouts for company hierarchies, reporting relationships, and departmental structures in PowerPoint. An HR manager preparing the quarterly update for the executive team or a consultant documenting roles in a client proposal reaches for one of these files the moment the meeting invite lands.
Take a product director at a growing SaaS company who must present the new cross-functional team setup to investors next week. Opening the matrix layout template lets her swap in department names and adjust levels in under 30 minutes, leaving the rest of the afternoon for refining the narrative. Consistent alignment across every box ensures the slide reads as a single coherent argument.
Choose the format that matches your organization and open the file to begin.
 (603)
(603) Employee PowerPoint Diagrams: Training & GrowthID: #PD00215$16.00
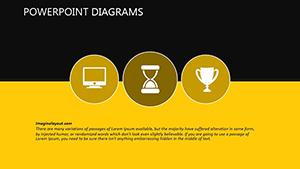 (117)
(117) Black Business Corporation PowerPoint DiagramsID: #PD00213$19.00
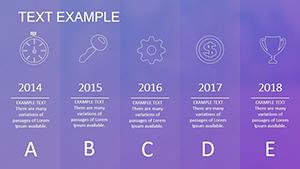 (770)
Collective PowerPoint Diagrams for GrowthID: #PD00212$16.00
(770)
Collective PowerPoint Diagrams for GrowthID: #PD00212$16.00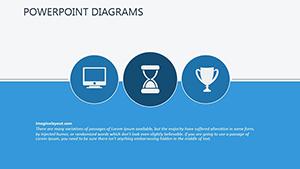 (844)
Business Corporation Structure PowerPoint TemplateID: #PD00211$19.00
(844)
Business Corporation Structure PowerPoint TemplateID: #PD00211$19.00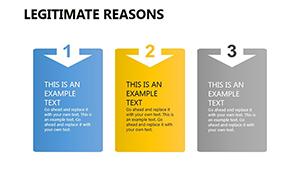 (712)
(712) Legitimate Reasons PowerPoint Diagram Template: Empower Ethical NarrativesID: #PD00193$19.00
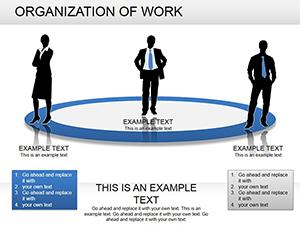 (743)
Organization of Work PowerPoint Diagrams: Download PPTXID: #PD00172$25.00
(743)
Organization of Work PowerPoint Diagrams: Download PPTXID: #PD00172$25.00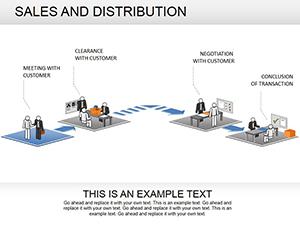 (505)
Sales And Distribution PowerPoint Diagrams: Chart Your Path to RevenueID: #PD00168$26.00
(505)
Sales And Distribution PowerPoint Diagrams: Chart Your Path to RevenueID: #PD00168$26.00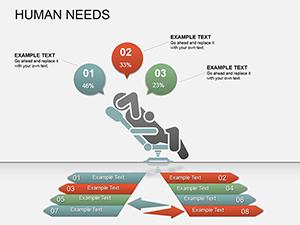 (785)
Innovative Startup Ideas PPT Diagrams - Fully EditableID: #PD00154$20.00
(785)
Innovative Startup Ideas PPT Diagrams - Fully EditableID: #PD00154$20.00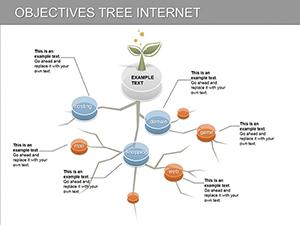 (511)
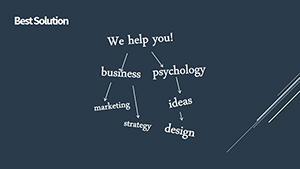
Dynamic Objectives Tree PowerPoint Diagrams: Elevate Your PresentationsID: #PD00113$20.00
(511)
Dynamic Objectives Tree PowerPoint Diagrams: Elevate Your PresentationsID: #PD00113$20.00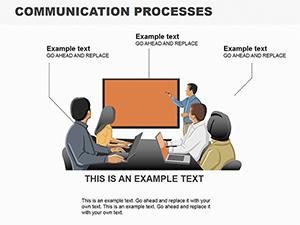 (201)
Communication Processes PowerPoint Diagrams: Download PresentationID: #PD00106$20.00
(201)
Communication Processes PowerPoint Diagrams: Download PresentationID: #PD00106$20.00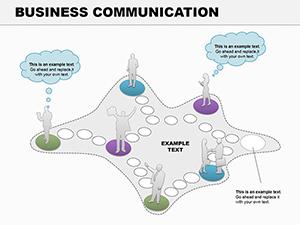 (355)
Business Communication PPT Diagrams: Weave Words into ImpactID: #PD00080$14.00
(355)
Business Communication PPT Diagrams: Weave Words into ImpactID: #PD00080$14.00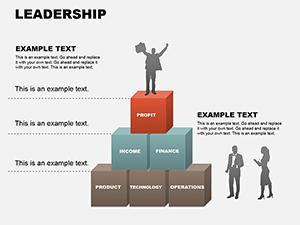 (604)
Leadership PowerPoint Diagrams: Motivate and GuideID: #PD00073$15.00
(604)
Leadership PowerPoint Diagrams: Motivate and GuideID: #PD00073$15.00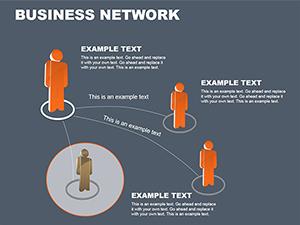 (883)
Business Network PowerPoint Diagrams Template: Download PPTXID: #PD00071$22.00
(883)
Business Network PowerPoint Diagrams Template: Download PPTXID: #PD00071$22.00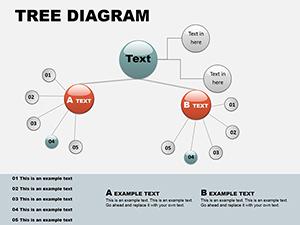 (1068)
Circular Tree PowerPoint Template: Branch into Radial BrillianceID: #PD00060$16.00
(1068)
Circular Tree PowerPoint Template: Branch into Radial BrillianceID: #PD00060$16.00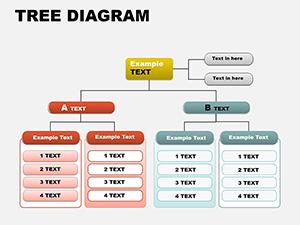 (870)
Tree Organizational PowerPoint DiagramsID: #PD00057$16.00
(870)
Tree Organizational PowerPoint DiagramsID: #PD00057$16.00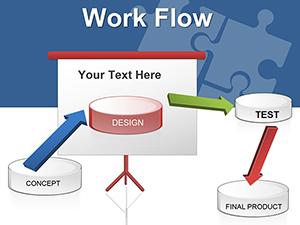 (478)
Workflow PowerPoint Diagram TemplateID: #PD00039$24.00
(478)
Workflow PowerPoint Diagram TemplateID: #PD00039$24.00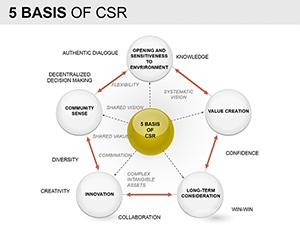 (212)
Basis of CSR PowerPoint Diagrams TemplateID: #PD00012$28.00
(212)
Basis of CSR PowerPoint Diagrams TemplateID: #PD00012$28.00
Real Situations Where These Organizational Chart Templates Deliver Results
An HR director at a manufacturing firm with 450 employees faces an urgent restructuring after a division merger. The stakeholder meeting is in 48 hours, and the existing chart is outdated with overlapping lines. She selects the hierarchical layout, inserts the new reporting lines, adds photo placeholders for key leads, and the slide is ready for the all-hands call. The clear levels prevent any confusion during Q&A.
A management consultant documents the client organization during final due diligence for an acquisition. The tree structure template allows quick insertion of division heads and adjustment of connector styles to reflect the merged reporting flow. The client executive team reviews the deck the same afternoon with full understanding of the new structure.
A finance vice president prepares the departmental budget overview for the CFO. The flat organizational chart layout groups cost centers clearly, with color-coded boxes that match the financial model. Alignment holds across the entire 16:9 slide so the presentation moves smoothly to the action items.
A startup founder updates the team slide for the next investor pitch. The circular layout template fits the small core group plus advisors, with photo placeholders scaled automatically. The result communicates a compact, agile structure that resonates in the 10-minute slot.
The Hidden Time Cost of Drawing Organizational Charts from Blank Slides
Starting from a blank slide forces you to decide box dimensions that scale across seven levels, then spend time routing connectors so they snap without crossing text. By the eighth slide the color palette drifts and font sizes vary. These templates remove those repeated decisions so your thinking stays on the hierarchy itself rather than the mechanics of shapes.
Managing Recurring Organizational Updates with Slide Masters
Quarterly updates become routine when the slide master locks the base layout. Change the corporate color once and every chart in the deck updates. Multiple departments can pull from the same master file and still maintain brand consistency even when contributors work in parallel on the annual report.
Practical Steps for Adapting Multi-Department Charts
Group entire branches before repositioning them to keep connector angles intact. Use the selection pane to temporarily hide guide lines while fine-tuning. Test the finished chart in presenter view to confirm the flow reads correctly on widescreen displays.
Configuring Aspect Ratio and Export Settings in PowerPoint
Set the slide size to 16:9 in the design tab before any edits. When exporting the deck to PDF for board packets, embed fonts and select high-quality print. Thin connectors stay crisp on high-resolution projectors and printed handouts.
What Sets These Organizational Charts Apart for Business Use
The designs prioritize editing speed and readability over decoration. Every connector remains a native shape you can reroute in one click. Photo placeholders scale without distortion and the collection contains no locked images that break when resized.
If your next presentation needs structured data analysis instead, explore the analysis Keynote diagrams templates. When you require layered metric comparisons, the cubes PowerPoint chart templates provide depth. For presentations built in Keynote with three-dimensional impact, see the 3D Keynote diagrams templates.
Find the organizational chart layout that matches your current project and open the PPTX file.
How These Templates Support Executive Storytelling
Executives scan a hierarchy slide in seconds when boxes align and connectors follow a logical path. The built-in layouts already enforce that visual order so you focus on the story of growth, consolidation, or realignment rather than fixing spacing.
Are the organizational chart templates compatible with Google Slides?
Yes, the PPTX files open directly in Google Slides with all shapes, text boxes, and connectors preserved. Some advanced connector styles may simplify, but the overall hierarchy remains fully editable. If you notice minor alignment shifts after import, use the arrange tools to snap objects back to grid. This compatibility lets teams collaborate without everyone owning a desktop copy of PowerPoint.
Can I share these templates with colleagues in my organization?
The license permits sharing and editing within your company or team for internal business purposes. You can distribute the files via email or shared drive for collaborative projects like annual planning or onboarding materials. The only restriction is against reselling the templates themselves or using them in products offered to third parties for a fee. This setup supports cross-department workflows without additional purchases.
Do the files include a slide master for theme updates?
Most templates feature a configured slide master so that changing the presentation theme colors or fonts updates every organizational chart automatically. This saves time when aligning with corporate brand guidelines. If your company updates its palette quarterly, apply the change once in the master and the entire deck reflects it instantly. Check the slide master view after opening to confirm the layout placeholders are active.
How easy is it to add or remove hierarchy levels?
The editable shapes and smart connectors allow you to duplicate a box, reroute the line, and adjust text in seconds without manual realignment of the entire chart. Group related branches first for bulk moves when expanding a department. This flexibility means you can evolve the chart from a flat structure to a five-level matrix during a single editing session if the organization changes mid-project.
What PowerPoint version works best for full functionality?
The templates are optimized for PowerPoint 2016 and newer versions on Windows or Mac, where native connectors and alignment tools perform best. Earlier versions open the files but may lose some connector curvature or require manual adjustment. For best results with PDF export, use 365 or 2021 editions to ensure embedded fonts render without substitution on recipient machines.