Cycle PowerPoint Diagrams
This collection contains cycle diagram slides built to show repeating business processes. A project manager mapping quarterly product releases or an operations lead explaining Six Sigma stages opens these files because the circular logic and directional cues are already solved.
Instead of manually rotating arrows and aligning segments on every slide, you simply edit the text placeholders and the visual flow stays balanced.
Choose the cycle template that fits your current workflow and begin editing.
 (75)
(75) Responsive Style PowerPoint Diagram Template: Adapt and CaptivateID: #PD00191$15.00
 (857)
(857) Achievement PowerPoint DiagramsID: #PD00188$15.00
 (1110)
 Various Data PowerPoint Template: Infuse Your Presentations with Visual IntelligenceID: #PD00182$20.00
 (205)
Available Types PowerPoint Diagrams: Weave Data Dependencies into Compelling VisualsID: #PD00180$20.00
(205)
Available Types PowerPoint Diagrams: Weave Data Dependencies into Compelling VisualsID: #PD00180$20.00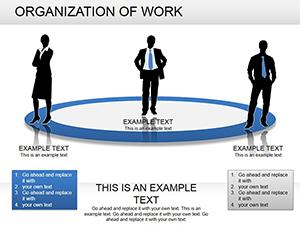 (743)
Organization of Work PowerPoint Diagrams: Download PPTXID: #PD00172$25.00
(743)
Organization of Work PowerPoint Diagrams: Download PPTXID: #PD00172$25.00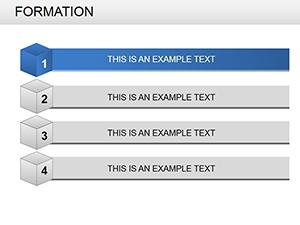 (44)
Versatile Formation PowerPoint Diagram TemplatesID: #PD00165$22.00
(44)
Versatile Formation PowerPoint Diagram TemplatesID: #PD00165$22.00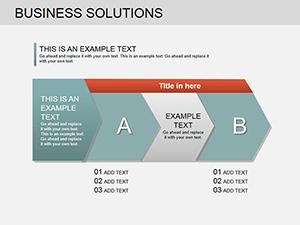 (827)
Business Solutions PowerPoint Diagrams TemplateID: #PD00163$23.00
(827)
Business Solutions PowerPoint Diagrams TemplateID: #PD00163$23.00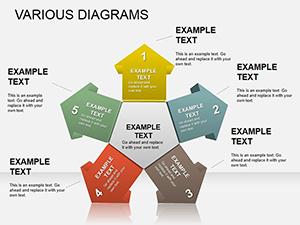 (529)
Construction Timeline PowerPoint Diagram: Build Your Project Story with PrecisionID: #PD00160$26.00
(529)
Construction Timeline PowerPoint Diagram: Build Your Project Story with PrecisionID: #PD00160$26.00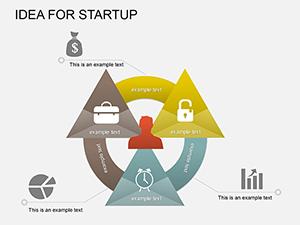 (333)
(333) Innovative Startup Ideas PowerPoint Diagrams: Download PPTXID: #PD00156$22.00
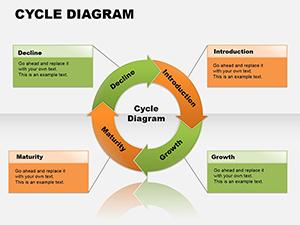 (172)
Cycle Analytical PowerPoint Diagrams TemplateID: #PD00084$16.00
(172)
Cycle Analytical PowerPoint Diagrams TemplateID: #PD00084$16.00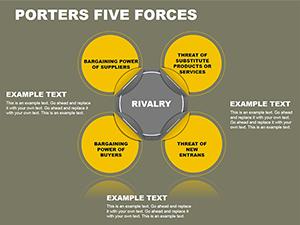 (196)
Porter's Five Forces PPT Template: Strategy InsightsID: #PD00069$18.00
(196)
Porter's Five Forces PPT Template: Strategy InsightsID: #PD00069$18.00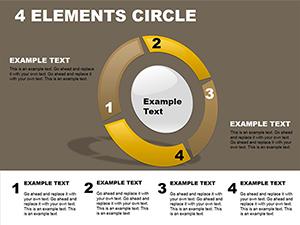 (757)
4 Elements Circle PowerPoint Template: Piecing Together Perfect PresentationsID: #PD00065$18.00
(757)
4 Elements Circle PowerPoint Template: Piecing Together Perfect PresentationsID: #PD00065$18.00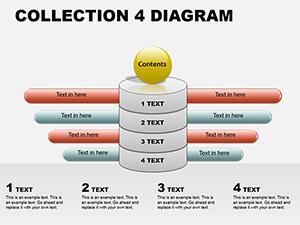 (156)
PowerPoint Diagram Collection 4: Sculpting Ideas in 3DID: #PD00062$18.00
(156)
PowerPoint Diagram Collection 4: Sculpting Ideas in 3DID: #PD00062$18.00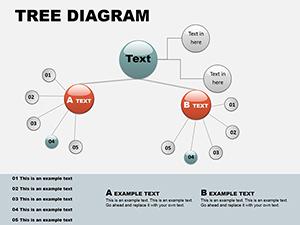 (1068)
Circular Tree PowerPoint Template: Branch into Radial BrillianceID: #PD00060$16.00
(1068)
Circular Tree PowerPoint Template: Branch into Radial BrillianceID: #PD00060$16.00 (6)
Fully Editable Cycle, Pyramid, Arrow, Pie & Puzzle PowerPoint Diagram Templates - 11 Slides | Instant DownloadID: #PD00059$12.00
(6)
Fully Editable Cycle, Pyramid, Arrow, Pie & Puzzle PowerPoint Diagram Templates - 11 Slides | Instant DownloadID: #PD00059$12.00 (44)
PowerPoint Diagrams Collection 2: Craft Data Stories That StickID: #PD00058$28.00
(44)
PowerPoint Diagrams Collection 2: Craft Data Stories That StickID: #PD00058$28.00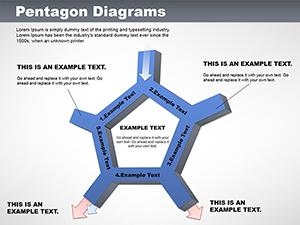 (184)
Versatile Pentagon PowerPoint Diagrams TemplateID: #PD00051$18.00
(184)
Versatile Pentagon PowerPoint Diagrams TemplateID: #PD00051$18.00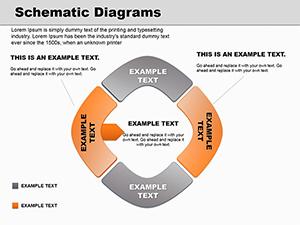 (360)
Schematic PowerPoint Diagrams: 18 Editable PPTX SlidesID: #PD00050$20.00
(360)
Schematic PowerPoint Diagrams: 18 Editable PPTX SlidesID: #PD00050$20.00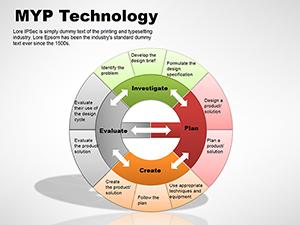 (882)
MYP Technology PowerPoint Diagrams TemplateID: #PD00048$15.00
(882)
MYP Technology PowerPoint Diagrams TemplateID: #PD00048$15.00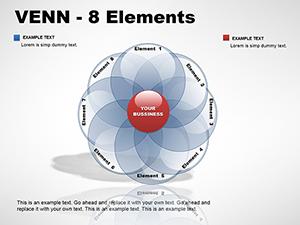 (54)
8-Element Venn PowerPoint DiagramsID: #PD00045$24.00
(54)
8-Element Venn PowerPoint DiagramsID: #PD00045$24.00 (82)
Discs Venn PowerPoint Diagrams - Editable PPTX | ImagineLayoutID: #PD00044$22.00
(82)
Discs Venn PowerPoint Diagrams - Editable PPTX | ImagineLayoutID: #PD00044$22.00 (691)
Probability Venn PowerPoint Diagrams: Master Set Visuals with EaseID: #PD00042$28.00
(691)
Probability Venn PowerPoint Diagrams: Master Set Visuals with EaseID: #PD00042$28.00 (478)
Workflow PowerPoint Diagram TemplateID: #PD00039$24.00
(478)
Workflow PowerPoint Diagram TemplateID: #PD00039$24.00 (614)
Porter's Diamond PowerPoint Diagram: Forge Competitive Edges VisuallyID: #PD00035$25.00
(614)
Porter's Diamond PowerPoint Diagram: Forge Competitive Edges VisuallyID: #PD00035$25.00 (92)
Cycle Diagrams for PowerPointID: #PD00026$28.00
(92)
Cycle Diagrams for PowerPointID: #PD00026$28.00 (212)
Basis of CSR PowerPoint Diagrams TemplateID: #PD00012$28.00
(212)
Basis of CSR PowerPoint Diagrams TemplateID: #PD00012$28.00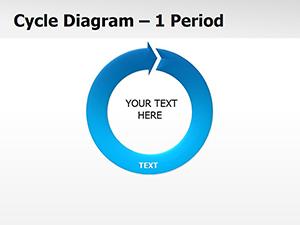 (980)
Cycle Periods PowerPoint Diagrams TemplateID: #PD00011$24.00
(980)
Cycle Periods PowerPoint Diagrams TemplateID: #PD00011$24.00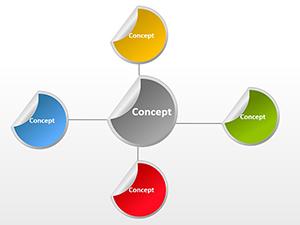 (1029)
Round Sticker PowerPoint Diagrams TemplateID: #PD00008$12.00
(1029)
Round Sticker PowerPoint Diagrams TemplateID: #PD00008$12.00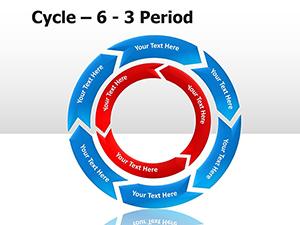 (393)
Cycle Period PowerPoint DiagramsID: #PD00006$22.00
(393)
Cycle Period PowerPoint DiagramsID: #PD00006$22.00
Why Linear Slides Fail to Show Repeating Processes
A timeline slide can only go left to right. When the story loops back, as most real business processes do, the audience loses the connection. Cycle diagrams close that loop visually so the conversation can focus on improvement rather than sequence.
The Alignment Work You Skip
Rotating each segment to perfect angles, distributing text evenly around the circle, ensuring every arrowhead points exactly at the next step; these micro-adjustments multiply across a 40-slide deck and disappear from thinking time.
Four Cycle Use Cases in Practice
The HR director presents the employee lifecycle from onboarding to offboarding. The four-segment circle already groups each phase so leadership sees retention gaps at a glance.
A manufacturing manager reviews the production loop. The gear-shaped cycle diagram highlights where downtime occurs without needing extra callouts.
A sales leader maps the customer journey. The five-ring cycle shows where leads drop off and where upselling opportunities sit.
An R&D team shares the innovation cycle. The overlapping circles illustrate how ideation feeds back into testing.
PowerPoint Technique for Cycle Diagrams
Select the entire cycle group, go to Shape Format and choose "Edit Points" to adjust one node. The connected arrows automatically follow because they are anchored to the shape handles rather than floating lines.
Animation Behavior to Watch
When you apply entrance animations keep the group intact; PowerPoint treats the cycle as one object so the whole loop appears together. If you need staggered segment reveals, ungroup once, animate, then regroup to keep the file size under control.
For supporting documents see our energy and power Word templates or check food and beverage business card templates when you need matching physical collateral.
Download the cycle diagram that matches your process and finish the presentation before the review.
FAQ
Do the cycle diagrams work in PowerPoint for Mac?
Yes, all files are native PPTX and open without conversion on both Mac and Windows. SmartArt alternatives are avoided so vector precision stays identical across platforms.
Can I change the number of segments?
Each diagram is built from individual editable shapes. Duplicate or delete a segment, then reconnect the arrows using the built-in connection points. The layout stays balanced because the angles are defined by the group rather than fixed numbers.
Are the files suitable for Google Slides?
Import works cleanly for most templates. Complex gradients may need one manual adjustment after upload. Text placeholders remain fully editable once the file is in Google Slides.
What license covers client presentations?
The commercial license permits use in paid client work and internal training. You may not redistribute the original template files or offer them as part of a design service.