PowerPoint Slide Size: 16:9 vs. 4:3 — Which Should You Use?
Choosing between 16:9 and 4:3 in PowerPoint is really a question of where your deck will be seen, shared, printed, or reused.
Design tips, tutorials, product updates, and industry insights.
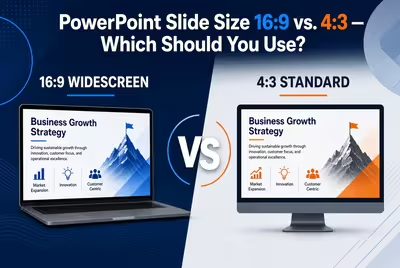
Choosing between 16:9 and 4:3 in PowerPoint is really a question of where your deck will be seen, shared, printed, or reused.
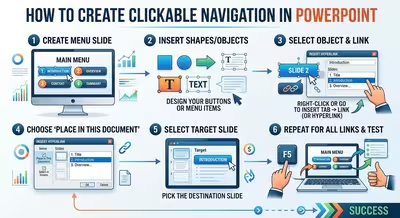
Turn a standard PowerPoint deck into a clickable presentation with practical navigation, hyperlinks, Action Buttons, Zoom, and reliable return paths.
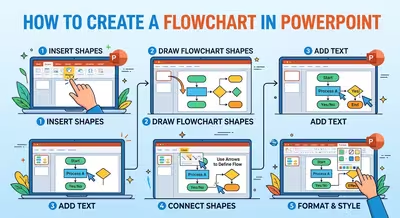
Learn how to create a clear, editable PowerPoint flowchart using SmartArt or shapes, with practical guidance for decisions, connectors, and complex processes.

Build a KPI dashboard in PowerPoint that makes performance, targets, trends, and problem areas understandable within seconds.
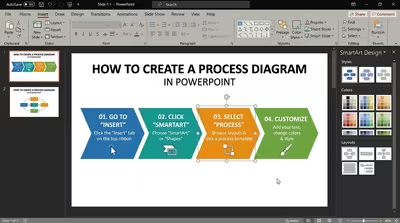
A practical guide to building process diagrams in PowerPoint, from choosing the right structure to controlling shapes, connectors, text, and flow.
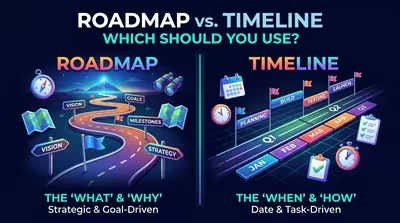
A roadmap and a timeline may look similar, but they answer different questions. Learn which visual works better for strategy, planning, milestones, and project progress.
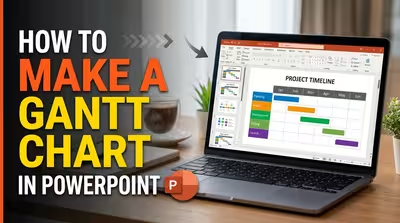
Learn how to make a Gantt chart in PowerPoint to show project tasks, durations, milestones, dependencies, and progress clearly.

Learn how to create a roadmap in PowerPoint, organize phases and milestones, and turn a complex plan into a clear presentation.
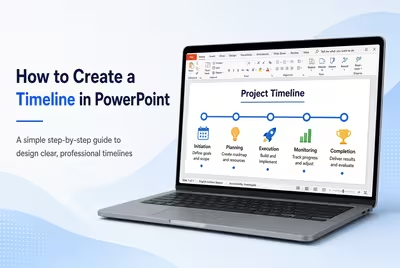
Learn how to create a clear PowerPoint timeline, organize milestones, choose the right layout, and refine it for presentations.