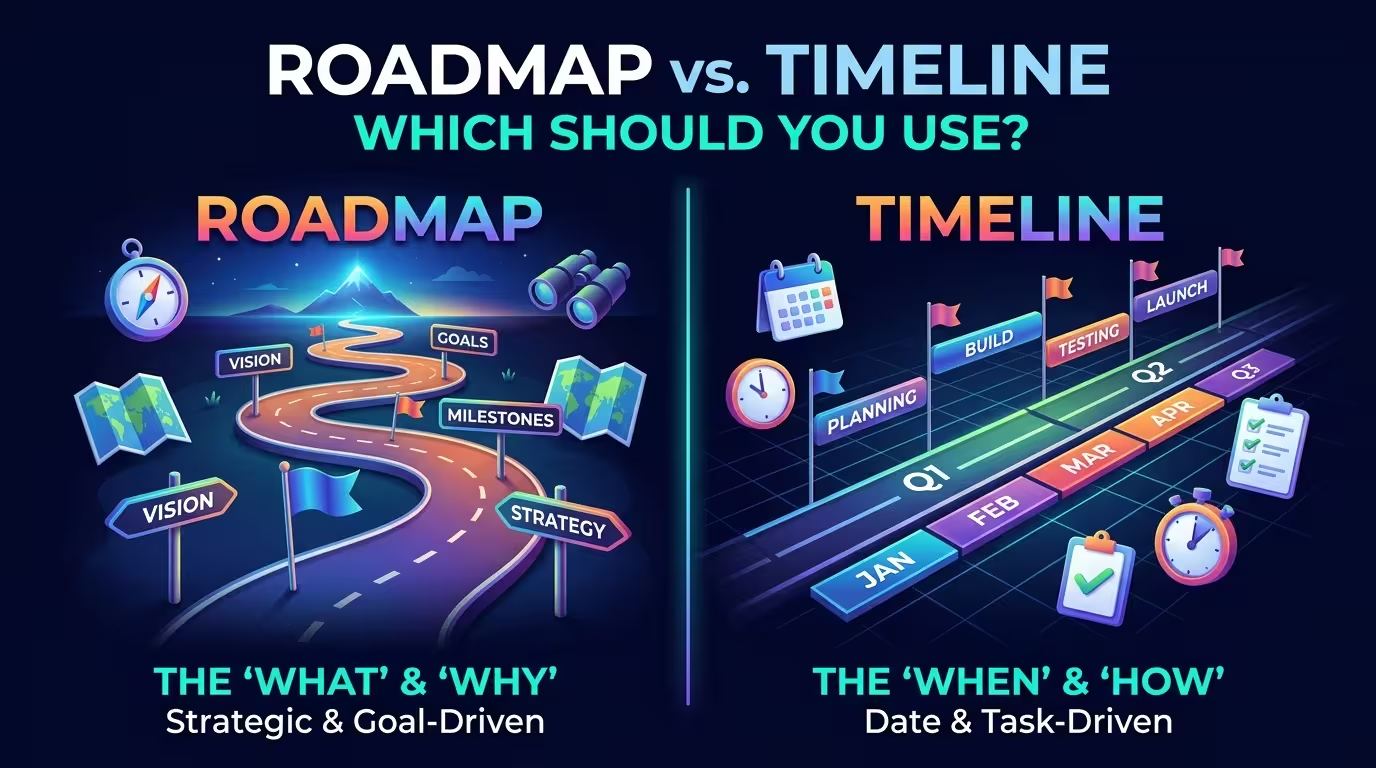
Roadmap vs. Timeline: Start With the Question You Need to Answer
A roadmap and a timeline can both show a sequence of work, which is why they are often used interchangeably in presentations. But they are not quite doing the same job. One is usually about direction and priorities; the other is about sequence and time.
That distinction becomes important when a slide needs to answer a specific question. If your audience wants to know where a product or project is heading, a roadmap may be the better visual. If they need to understand when events happened or when milestones are expected, a timeline is usually more direct.
ImagineLayout's presentation resources reflect this distinction through timeline diagrams, project timelines, process layouts, and planning-oriented visuals that can be adapted for different presentation purposes.
What Is a Roadmap?
A roadmap communicates a planned direction. It normally groups work around goals, themes, priorities, product areas, or strategic phases rather than simply listing events by date.
For example, a product roadmap might be organized like this:
- Now: Improve onboarding
- Next: Introduce collaboration features
- Later: Expand reporting capabilities
The important information is not necessarily the exact day each activity starts. The audience needs to understand what is being prioritized and how the pieces fit together.
This makes a roadmap particularly useful for product planning, strategic presentations, quarterly priorities, and initiatives where the future may change as decisions are made.
A roadmap can contain dates, but dates do not have to be its organizing principle.
What Is a Timeline?
A timeline puts chronology at the center of the visual. Events, milestones, or phases are positioned according to when they occur.
A simple project timeline might show:
- January — Project kickoff
- February — Research completed
- March — Prototype approved
- April — Testing
- May — Launch
Here, the audience is expected to follow the progression of time. The exact order and timing are part of the message, not merely supporting information.
ImagineLayout's timeline resources include horizontal flows, vertical sequences, circular variations, milestone markers, and phase-based layouts.
Roadmap vs. Timeline: The Practical Difference
The easiest way to separate the two is to ask what the audience should understand after looking at the slide.
| Roadmap | Timeline |
|---|---|
| Shows direction and priorities | Shows chronological progression |
| Often focuses on what comes next | Focuses on when events occur |
| Can use flexible time periods | Usually relies on a defined sequence or dates |
| Useful for strategy and product planning | Useful for milestones and historical or project sequences |
| Can change as priorities change | Usually emphasizes a fixed or intended sequence |
There is considerable overlap. A roadmap can contain a timeline, and a timeline can communicate part of a roadmap. The difference comes from what the visual is asking the audience to pay attention to.
Use a Roadmap When Direction Matters More Than Exact Dates
Suppose you are presenting a product plan for the next several quarters. You know which capabilities the team wants to address, but exact delivery dates are not finalized.
A traditional timeline can create a false impression of precision. Putting a specific date next to every initiative may make the audience assume those dates are firm commitments.
A roadmap gives you more room to communicate intent without pretending that every future decision is already fixed.
Use a roadmap when the presentation needs to emphasize:
- Strategic priorities
- Product direction
- Major initiatives
- Future capabilities
- Business objectives
- High-level phases
For this type of slide, grouping information into Now / Next / Later, quarters, themes, or strategic stages can be more useful than placing every item on a precise date axis.
Use a Timeline When Sequence and Timing Are the Story
Now consider a project review where stakeholders need to understand what happened from kickoff to completion. In this case, changing the visual into a flexible roadmap could remove exactly the information the audience needs.
A timeline works particularly well for:
- Project milestones
- Company history
- Event schedules
- Implementation phases
- Launch sequences
- Historical development
- Completed and upcoming activities
ImagineLayout's timeline collections include dedicated milestone and project-oriented layouts, making this structure useful when dates and progression need to remain visually prominent.
The test is straightforward: if removing the dates would significantly damage the meaning of the slide, you are probably dealing with a timeline.
Where Roadmaps and Timelines Overlap
The boundary becomes less obvious when a roadmap includes quarters or target dates. At that point, the visual may look almost identical to a timeline.
That is not necessarily a problem. A single presentation can use both.
For example, an executive presentation might begin with a roadmap that explains the strategic direction:
Improve product experience → Expand collaboration → Add advanced analytics
A later slide could use a timeline to explain how one initiative will progress:
Research → Prototype → Testing → Release
The first slide answers “Where are we going?” The second answers “When and in what sequence will this happen?”
Trying to force both questions onto one diagram can make the slide harder to interpret.
Do Not Turn a Roadmap Into a Fake Schedule
One of the most useful distinctions is the difference between planning intent and schedule commitment.
If a roadmap says that an initiative belongs in Q4, that does not necessarily mean the audience should interpret it as a fixed delivery date. A roadmap can intentionally communicate relative priority while leaving implementation details open.
If exact start dates, durations, task dependencies, and overlapping activities matter, a more schedule-oriented visualization may be appropriate. For example, a Gantt-style chart can show task bars, milestones, and dependency relationships rather than only strategic direction.
ImagineLayout provides Gantt timeline layouts specifically built around task sequencing, dependency connectors, and milestone markers.
This creates a useful hierarchy:
- Roadmap: where the initiative is going.
- Timeline: when important events occur.
- Gantt-style chart: how tasks occupy time and relate to one another.
How to Choose the Right Visual for Your PowerPoint Slide
Before designing the slide, finish this sentence:
“After seeing this visual, my audience should understand…”
If the answer is “our strategic direction and priorities,” start with a roadmap.
If the answer is “the order and timing of important events,” start with a timeline.
If the answer is “how long tasks take and how they overlap,” consider a Gantt-style chart instead.
There is also a useful test for presentations that contain uncertain future plans: remove the dates temporarily. If the slide still communicates its main message, it may be functioning as a roadmap. If removing the dates destroys the meaning, chronology is probably the core of the visual.
Roadmap or Timeline? Choose Based on the Message
The visual should follow the question, not the other way around.
Choose a roadmap when you need to communicate direction, priorities, strategic initiatives, or a flexible view of what comes next. Choose a timeline when the audience needs to understand chronological order, milestones, or specific points in time.
And when the presentation needs detailed scheduling, neither may be enough on its own. A Gantt-style visualization can provide the additional information about duration and dependencies that a simple roadmap or timeline leaves out.
Once that distinction is clear, the design decision becomes much easier: use the visual that answers the audience's actual question.
Comments (0)